Concerns about research credibility have stimulated the growth of meta-science, a field that examines the reproducibility, robustness, and replicability of scientific findings (Ioannidis, 2005; Munafò et al., 2017). This literature has documented publication bias, low statistical power, inflated effect size estimates, and disappointing replication rates in some areas of research (Button et al., 2013; Ioannidis, 2005; Open Science Collaboration, 2015; Tyner et al., 2026). While initial studies focused on psychology and neuroscience, but a recent article suggested that the problems are more general. Tyner et al. (2026) reported that only about 50% of originally significant claims were successfully replicated.
A replication rate of 50% invites different interpretations. An optimistic interpretation is that most original studies detected effects in the correct direction, but that the average probability of obtaining another significant result in a new sample was only about 50%. In this scenario, selective publication of significant results inflates observed effect sizes, so replication studies often fail even when the original studies were not false positives. Many of the failures are therefore false negatives. A pessimistic interpretation is that many original results were false positives, whereas the remaining studies examined true effects with high power. In that case, the same 50% replication rate could arise from a mixture of null effects and highly powered true effects. Thus, the average replication rate alone is consistent with very different underlying realities.
To move beyond average replication rates, it is necessary to avoid reducing results to a dichotomy of significant versus non-significant. A cutoff at z = 1.96 is useful for decision making, but it discards quantitative information about the strength of evidence. A result with z = 6 provides much stronger evidence for a positive effect than a result with z = 2, just as z = -6 provides much stronger evidence for a negative effect than z = -2. This point is straightforward, but broad evaluations of replication outcomes have largely ignored differences in original evidential strength.
I used z-curve to examine heterogeneity in the strength of evidence across the original significant findings included in the two large replication projects (Brunner & Schimmack, 2020; Bartoš & Schimmack, 2022). Z-curve uses the distribution of significant z-values and corrects for the inflation in observed test statistics introduced by selection for significance. It provides two key estimates. The first is the Expected Replication Rate (ERR), which is the average probability that a significant result would be significant again in an exact replication with a new sample of the same size. The second is the Expected Discovery Rate (EDR), which is the estimated proportion of all studies, including unpublished non-significant ones, that would be expected to yield a significant result.
The EDR can be used to evaluate publication bias and to derive an upper bound on the false discovery rate using Sorić’s (1989) formula. Performance of z-curve has been examined in extensive simulation studies, which show that its 95% confidence intervals perform well when at least 100 significant results are available (Bartoš & Schimmack, 2022). Because z-curve is designed to accommodate heterogeneity in evidential strength, it is especially suitable for a diverse set of studies such as those included in the replication projects. Previous applications have shown substantial variation in ERR and EDR across research areas (Schimmack, 2020; Schimmack & Bartoš, 2023; Soto & Schimmack, 2024; Credé & Sotola, 2024; Sotola, 2022, 2024).”One limitation of previous applications is that they sometimes relied on automatically extracted p-values or focused on specific literatures. The replication projects provide gold-standard test statistics from a representative sample of social science research, avoiding both concerns. This makes it possible to examine heterogeneity in replicability across a broad range of research areas.
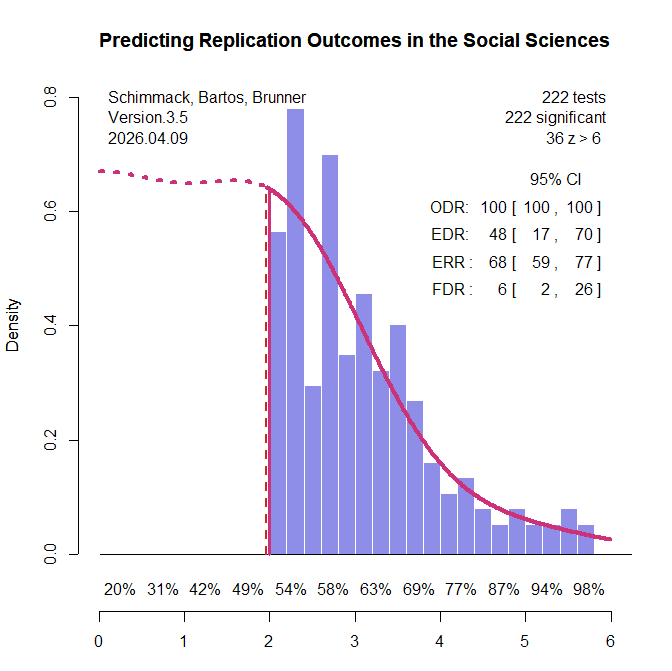
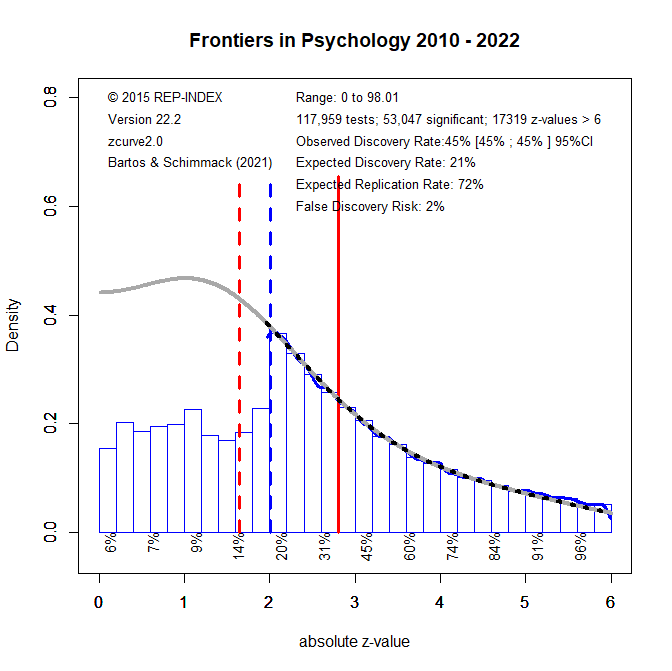
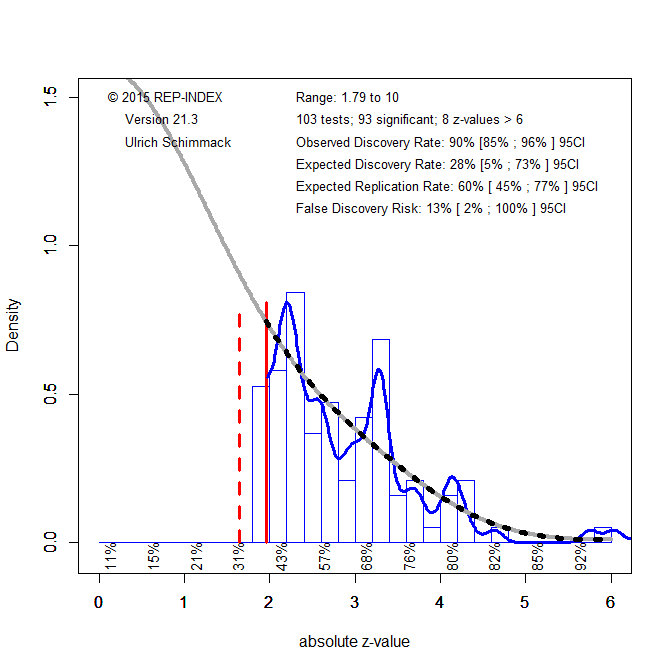
All original studies in the two replication projects were eligible for inclusion. For articles with multiple claims, the focal claim was identified from the abstract using a large language model (see OSF for details and cross-validation). When exact p-values were not reported in the project materials, the original articles were consulted to recover the necessary information. Articles without exact p-values were excluded. Original studies that claimed an effect without meeting the conventional significance threshold of p < .05 were also excluded. A small number of studies were further excluded because the replication reports did not provide sufficient information to evaluate the replication outcome. This screening process yielded k = 222 significant results (k1 = 88, k2 = 134), including k = 130 from psychology and k = 92 from other social sciences. The replication rate in this subset was similar to that in the full set of studies: 43% overall (project 1: 33%, project 2: 49%; psychology: 37%; other social sciences: 51%; see OSF for details). Figure 1 shows the z-curve analysis of these 222 original significant results.
The most striking result is that the expected replication rate (ERR) is substantially higher than the observed replication rate in the replication studies (68% versus 42%). Even the lower bound of the 95% confidence interval for the ERR, 59%, exceeds the observed replication rate. This discrepancy is especially noteworthy because the replication studies often used larger sample sizes than the original studies, which should have increased, not decreased, the probability of obtaining a significant result. Thus, the lower effect sizes observed in the replication studies cannot be attributed to regression to the mean alone. An additional factor appears to be that population effect sizes in the replication studies were systematically smaller than in the original studies.
Z-curve also limits the range of scenarios that are compatible with the data. The estimated EDR of 48% implies that no more than 6% of the significant results can be false positive results (Soric, 1989). Even the lower limit of the EDR confidence interval, 17%, limits the false positive rate to no more than 26%. With 50% replication failures, this suggests that no more than half of the replication failures are false positives. This finding shows the importance of distinguishing clearly between replication rates and false positive rates (Maxwell et al., 2015).
The false positive risk also varies as a function of the significance criterion. Marginally significant results are more likely to be false positives than results with high z-values (Benjamin et al., 2018). Z-curve makes it possible to address Benjamini and Hechtlinger’s (2014) call to control, rather than merely estimate, the science-wise false discovery rate. A stricter alpha criterion reduces the discovery rate, but it reduces the false discovery rate more. Benjamin et al. (2018) suggested reducing the false positive risk by lowering the significance criterion to alpha = .005. A z-curve analysis with this criterion estimated the FDR at 2% and the upper limit of the 95% CI was 6%. This finding provides empirical support for Benjamin et al.’s (2018) suggestion. It also addresses Lakens et al.’s (2018) concern that alpha levels should be justified. Here the strength of evidence provides the justification. In other literatures, alpha = .01 is sufficient to keep the FDR below 5% (Schimmack & Bartoš, 2023; Soto & Schimmack, 2024), but sometimes even alpha = .001 is insufficient to control false positives (Chen et al., 2025; Schimmack, 2025).
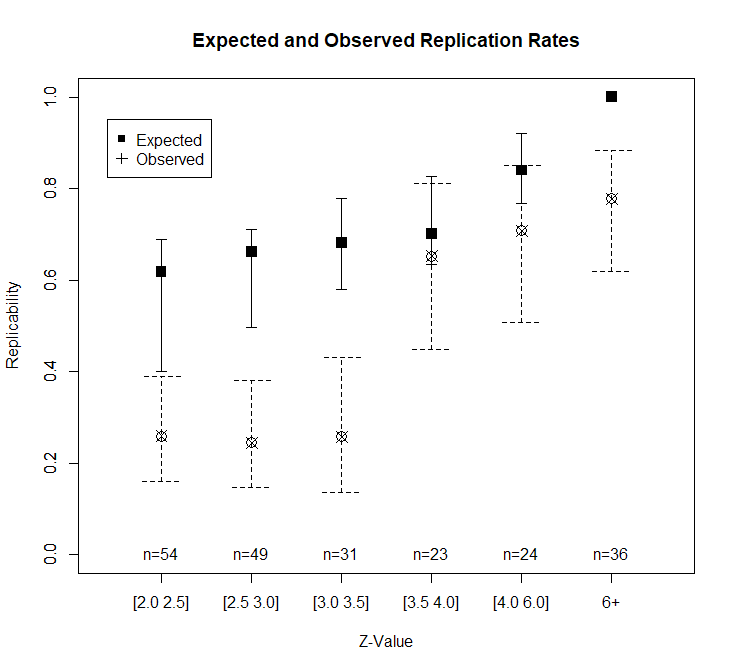
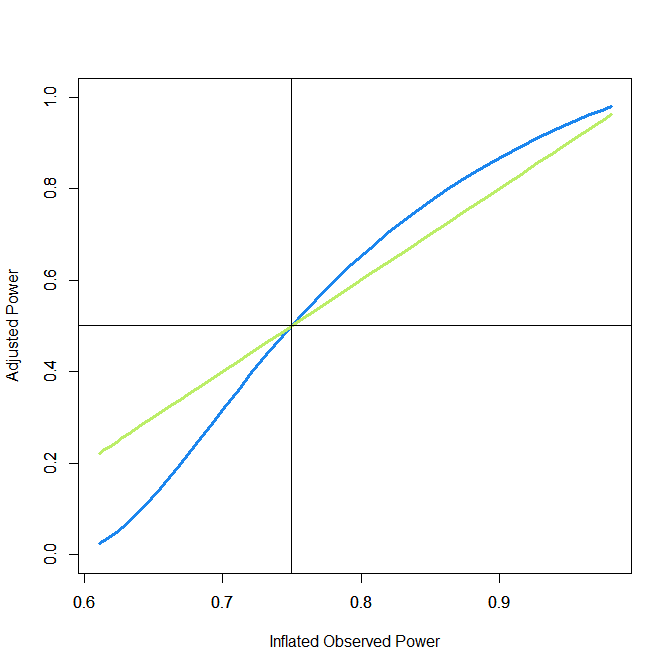
Heterogeneity in strength of evidence also makes it possible to predict replication outcomes as a function of z-values. Figure 1 shows power for z-value intervals below the x-axis. Expected replication rates increase from 54% for just significant results to over 90% for z-values greater than 5. Another 36 z-values have z-values greater than 6 that are practically guaranteed to replicate in exact replication studies. Figure 2 shows the expected replication rates and the observed replication rates for z-value ranges.
Studies with modest evidence (z = 2 to 3.5) replicate at significantly lower rates than expected based on z-curve. As expected, replication rates increase with stronger evidence. Given the small number of observations per bin, it is not possible to test whether z-curve predictions remain too optimistic at moderate z-values. The most surprising finding is that observed replication rates for studies with strong evidence (z > 6) fall below the expected rate.
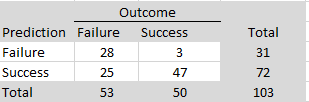
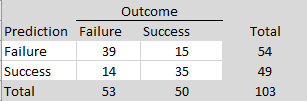
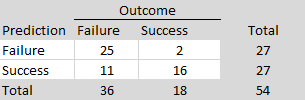
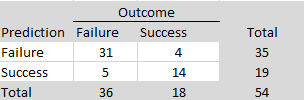
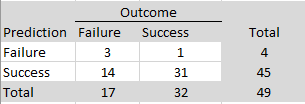
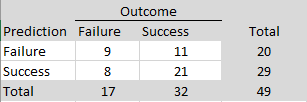
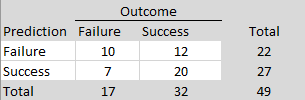
In exploratory analyses, I examined possible reasons for these surprising replication failures. I used two large language models (ChatGPT and Claude) to score the replication reports of studies with strong original evidence (z > 6). Studies were coded on five dimensions (match of populations, materials, design, time period, and implementation) with scores from 0 to 2 each to produce total scores ranging from 0 to 10. Inter-rater agreement for the total scores was high, ICC(A,1) = .85, 95%CI = .73, .92. I averaged the two scores and used a total of 7 or higher as the criterion for a close match. Of the 24 close replications, 21 were successful (88%). Of the 12 studies that were not close replications, only 6 were successful (50%).
I further examined the three close replications that failed. While Farris et al. (2008) closely matched the original in many aspects, the original participants were from the US and the replication was conducted in the UK. Subsequent studies have replicated the finding with US samples (Farris et al., 2009/2010; Treat et al., 2017), ruling out a simple false positive explanation. The replication failure of Hurst and Kavanagh (2017) likely reflects a sampling problem in the original study. Participants from the general population and users of community mental health services were analyzed in a single analysis, which can inflate effect sizes (Preacher et al., 2005). McDevitt examined the influence of plumbing business names starting with numbers or A to be first in the yellow pages. A replication in 2020 cannot reproduce this effect because google searches replaced yellow pages.
While these exploratory results are based on a small sample, they support the broader claim that original results with strong evidence (z > 6) are likely to replicate in close replications and that failures may stem from meaningful differences in study design.
Conclusion
Z-curve analysis of two major replication projects reveals that replicability in the social sciences is not a single number. The expected replication rate based on the strength of original evidence (68%) substantially exceeds the observed replication rate (42%), indicating that effect size shrinkage beyond statistical regression to the mean contributes to replication failures. The false discovery rate is low (6%), confirming that most replication failures reflect reduced effect sizes rather than false positives. Adjusting the significance criterion to alpha = .005 reduces the estimated false discovery rate to 2%.
The most practically useful finding is that original results with strong evidence (z > 6) are highly replicable when the replication closely matches the original study design (88% success rate). Replication failures among these strong results were attributable to identifiable differences between the original and replication studies — different populations, changed market conditions, or heterogeneous samples. This suggests that the strength of statistical evidence, combined with methodological similarity, is a reliable predictor of replication success.
These findings argue against treating all significant results as equally credible and against interpreting average replication rates as informative about any particular study. Replicability is predictable from information already available in the original publication.
In the 2010s, it became apparent that empirical psychology had a replication problem. When psychologists tested the replicability of 100 results, they found that only 36% of the 97 significant results in original studies could be reproduced (Open Science Collaboration, 2015). In addition, several prominent cases of research fraud further undermined trust in published results. Over the past decade, several proposals were made to improve the credibility of psychology as a science. Replicability Reports aim to improve the credibilty of psychological science by examining the amount of publication bias and the strength of evidence for empirical claims in psychology journals.
The main problem in psychological science is the selective publishing of statistically significant results and the blind trust in statistically significant results as evidence for researchers’ theoretical claims. Unfortunately, psychologists have been unable to self-regulate their behaviour and continue to use unscientific practices to hide evidence that disconfirms their predictions. Moreover, ethical researchers who do not use unscientific practices are at a disadvantage in a game that rewards publishing many articles without concern about these findings’ replicability.
My colleagues and I have developed a statistical tool that can reveal the use of unscientific practices and predict the outcome of replication studies (Brunner & Schimmack, 2021; Bartos & Schimmack, 2022). This method is called z-curve. Z-curve cannot be used to evaluate the credibility of a single study. However, it can provide valuable information about the research practices in a particular research domain.
Replicability-Reports (RR) use z-curve to provide information about psychological journal research and publication practices. This information can aid authors choose journals they want to publish in, provide feedback to journal editors who influence selection bias and replicability of published results, and, most importantly, to readers of these journals.
Evolutionary Psychology
Evolutionary Psychology was founded in 2003. The journal focuses on publishing empirical theoretical and review articles investigating human behaviour from an evolutionary perspective. On average, Evolutionary Psychology publishes about 35 articles in 4 annual issues.
As a whole, evolutionary psychology has produced both highly robust and questionable results. Robust results have been found for sex differences in behaviors and attitudes related to sexuality. Questionable results have been reported for changes in women’s attitudes and behaviors as a function of hormonal changes throughout their menstrual cycle.
According to Web of Science, the impact factor of Evolutionary Psychology ranks 88th in the Experimental Psychology category (Clarivate, 2024). The journal has a 48 H-Index (i.e., 48 articles have received 48 or more citations).
In its lifetime, Evolutionary Psychology has published over 800 articles The average citation rate in this journal is 13.76 citations per article. So far, the journal’s most cited article has been cited 210 times. The article was published in 2008 and investigated the influence of women’s mate value on standards for a long-term mate (Buss & Shackelford, 2008).
The current Editor-in-Chief is Professor Todd K. Shackelford. Additionally, the journal has four other co-editors Dr. Bernhard Fink, Professor Mhairi Gibson, Professor Rose McDermott, and Professor David A. Puts.
Extraction Method
Replication reports are based on automatically extracted test statistics such as F-tests, t-tests, z-tests, and chi2-tests. Additionally, we extracted 95% confidence intervals of odds ratios and regression coefficients. The test statistics were extracted from collected PDF files using a custom R-code. The code relies on the pdftools R package (Ooms, 2024) to render all textboxes from a PDF file into character strings. Once converted the code proceeds to systematically extract the test statistics of interest (Soto & Schimmack, 2024). PDF files identified as editorials, review papers and meta-analyses were excluded. Meta-analyses were excluded to avoid the inclusion of test statistics that were not originally published in Evolution & Human Behavior. Following extraction, the test statistics are converted into absolute z-scores.
Results For All Years
Figure 1 shows a z-curve plot for all articles from 2003-2023 (see Schimmack, 2023, for a detailed description of z-curve plots). However, the total available test statistics available for 2003, 2004 and 2005 were too low to be used individually. Therefore, these years were joined to ensure the plot had enough test statistics for each year. The plot is essentially a histogram of all test statistics converted into absolute z-scores (i.e., the direction of an effect is ignored). Z-scores can be interpreted as the strength of evidence against the null hypothesis that there is no statistical relationship between two variables (i.e., the effect size is zero and the expected z-score is zero). A z-curve plot shows the standard criterion of statistical significance (alpha = .05, z = 1.96) as a vertical red dotted line.
Figure 1
Z-curve plots are limited to values less than z = 6. The reason is that values greater than 6 are so extreme that a successful replication is all but certain unless the value is a computational error or based on fraudulent data. The extreme values are still used for the computation of z-curve statistics but omitted from the plot to highlight the shape of the distribution for diagnostic z-scores in the range from 2 to 6. Using the expectation maximization (EM) algorithm, Z-curve estimates the optimal weights for seven components located at z-values of 0, 1, …. 6 to fit the observed statistically significant z-scores. The predicted distribution is shown as a blue curve. Importantly, the model is fitted to the significant z-scores, but the model predicts the distribution of non-significant results. This makes it possible to examine publication bias (i.e., selective publishing of significant results). Using the estimated distribution of non-significant and significant results, z-curve provides an estimate of the expected discovery rate (EDR); that is, the percentage of significant results that were actually obtained without selection for significance. Using Soric’s (1989) formula the EDR is used to estimate the false discovery risk; that is, the maximum number of significant results that are false positives (i.e., the null-hypothesis is true).
Selection for Significance
The extent of selection bias in a journal can be quantified by comparing the Observed Discovery Rate (ODR) of 68%, 95%CI = 67% to 70% with the Expected Discovery Rate (EDR) of 49%, 95%CI = 26%-63%. The ODR is higher than the upper limit of the confidence interval for the EDR, suggesting the presence of selection for publication. Even though the distance between the ODR and the EDR estimate is narrower than those commonly seen in other journals the present results may underestimate the severity of the problem. This is because the analysis is based on all statistical results. Selection bias is even more problematic for focal hypothesis tests and the ODR for focal tests in psychology journals is often close to 90%.
Expected Replication Rate
The Expected Replication Rate (ERR) estimates the percentage of studies that would produce a significant result again if exact replications with the same sample size were conducted. A comparison of the ERR with the outcome of actual replication studies shows that the ERR is higher than the actual replication rate (Schimmack, 2020). Several factors can explain this discrepancy, such as the difficulty of conducting exact replication studies. Thus, the ERR is an optimist estimate. A conservative estimate is the EDR. The EDR predicts replication outcomes if significance testing does not favour studies with higher power (larger effects and smaller sampling error) because statistical tricks make it just as likely that studies with low power are published. We suggest using the EDR and ERR in combination to estimate the actual replication rate.
The ERR estimate of 72%, 95%CI = 67% to 77%, suggests that the majority of results should produce a statistically significant, p < .05, result again in exact replication studies. However, the EDR of 49% implies that there is some uncertainty about the actual replication rate for studies in this journal and that the success rate can be anywhere between 49% and 72%.
False Positive Risk
The replication crisis has led to concerns that many or even most published results are false positives (i.e., the true effect size is zero). Using Soric’s formula (1989), the maximum false discovery rate can be calculated based on the EDR.
The EDR of 49% implies a False Discovery Risk (FDR) of 6%, 95%CI = 3% to 15%, but the 95%CI of the FDR allows for up to 15% false positive results. This estimate contradicts claims that most published results are false (Ioannidis, 2005).
Changes Over Time
One advantage of automatically extracted test-statistics is that the large number of test statistics makes it possible to examine changes in publication practices over time. We were particularly interested in changes in response to awareness about the replication crisis in recent years.
Z-curve plots for every publication year were calculated to examine time trends through regression analysis. Additionally, the degrees of freedom used in F-tests and t-tests were used as a metric of sample size to observe if these changed over time. Both linear and quadratic trends were considered. The quadratic term was included to observe if any changes occurred in response to the replication crisis. That is, there may have been no changes from 2000 to 2015, but increases in EDR and ERR after 2015.
Degrees of Freedom
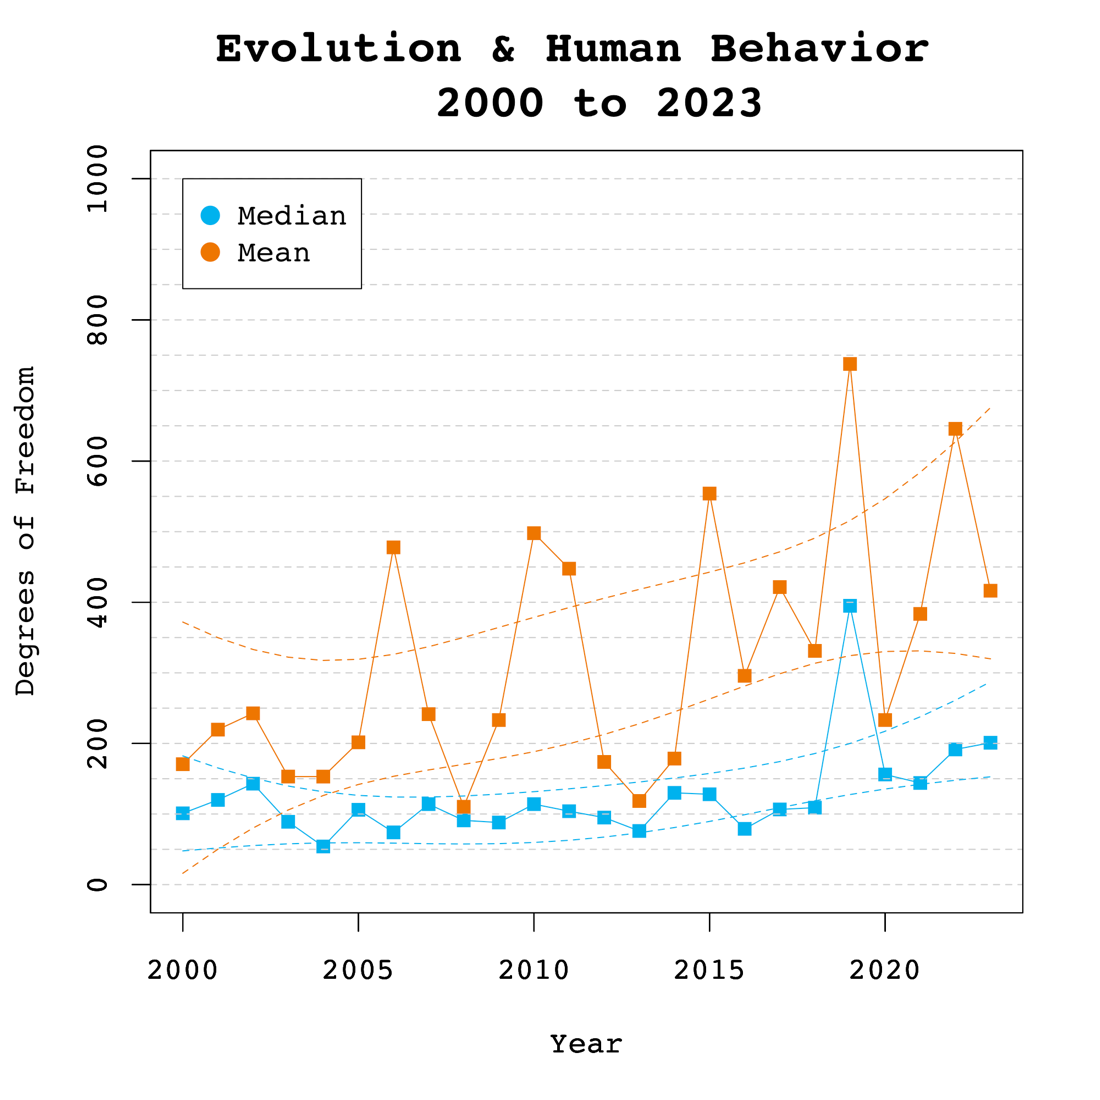
Figure 2 shows the median and mean degrees of freedom used in F-tests and t-tests reported in Evolutionary Psychology. The mean results are highly variable due to a few studies with extremely large sample sizes. Thus, we focus on the median to examine time trends. The median degrees of freedom over time was 121.54, ranging from 75 to 373. Regression analyses of the median showed a significant linear increase by 6 degrees of freedom per year, b = 6.08, SE = 2.57, p = 0.031. However, there was no evidence that the replication crisis influenced a significant increase in sample sizes as seen by the lack of a significant non-linear trend and a small regression coefficient, b = 0.46, SE = 0.53, p = 0.400.
Figure 2
Observed and Expected Discovery Rates
Figure 3 shows the changes in the ODR and EDR estimates over time. There were no significant linear, b = -0.52 (SE = 0.26 p = 0.063) or non-linear, b = -0.02 (SE = 0.05, p = 0.765) trends observed in the ODR estimate. The regression results for the EDR estimate showed no significant linear, b = -0.66 (SE = 0.64 p = 0.317) or non-linear, b = 0.03 (SE = 0.13 p = 0.847) changes over time. These findings indicate the journal has not increased its publication of non-significant results and continues to report more significant results than one would predict based on the mean power of studies.
Expected Replicability Rates and False Discovery Risks
Figure 4 depicts the false discovery risk (FDR) and the Estimated Replication Rate (ERR). It also shows the Expected Replication Failure rate (EFR = 1 – ERR). A comparison of the EFR with the FDR provides information for the interpretation of replication failures. If the FDR is close to the EFR, many replication failures may be due to false positive results in original studies. In contrast, if the FDR is low, most replication failures will likely be false negative results in underpowered replication studies.
The ERR estimate did not show a significant linear increase over time, b = 0.36, SE = 0.24, p = 0.165. Additionally, no significant non-linear trend was observed, b = -0.03, SE = 0.05, p = 0.523. These findings suggest the increase in sample sizes did not contribute to a statistically significant increase in the power of the published results. These results suggests that replicability of results in this journal has not increased over time and that the results in Figure 1 can be applied to all years.
Figure 4
Visual inspection of Figure 4 depicts the EFR between 30% and 40% and an FDR between 0 and 10%. This suggests that more than half of replication failures are likely to be false negatives in replication studies with the same sample sizes rather than false positive results in the original studies. Studies with large sample sizes and small confidence intervals are needed to distinguish between these two alternative explanations for replication failures.
Adjusting Alpha
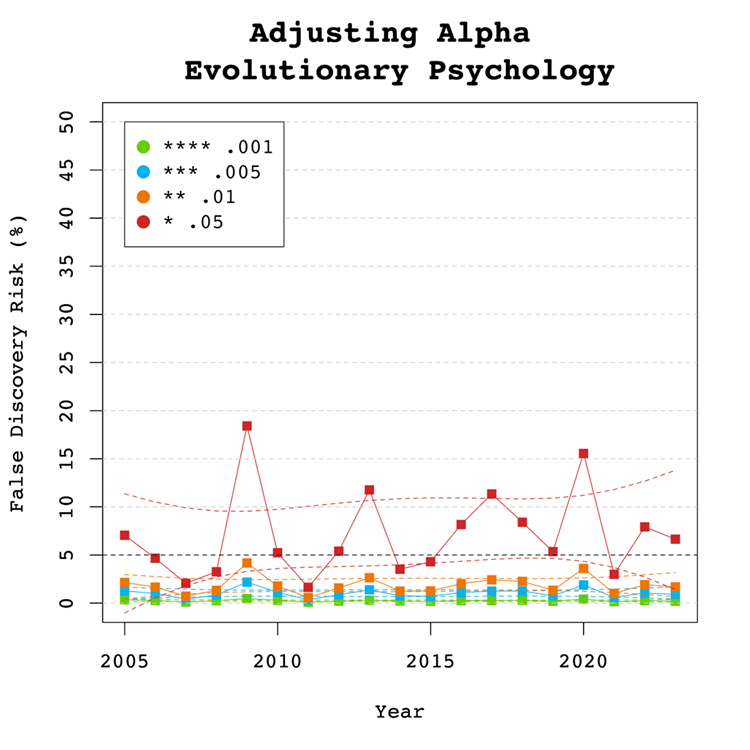
A simple solution to a crisis of confidence in published results is to adjust the criterion to reject the null-hypothesis. For example, some researchers have proposed to set alpha to .005 to avoid too many false positive results. With z-curve we can calibrate alpha to keep the false discovery risk at an acceptable level without discarding too many true positive results. To do so, we set alpha to .05, .01, .005, and .001 and examined the false discovery risk.
Figure 5
Figure 5 shows that the conventional criterion of p < .05 produces false discovery risks above 5%. The high variability in annual estimates also makes it difficult to provide precise estimates of the FDR. However, adjusting alpha to .01 is sufficient to produce an FDR with tight confidence intervals below 5%. The benefits of reducing alpha further to .005 or .001 are minimal.
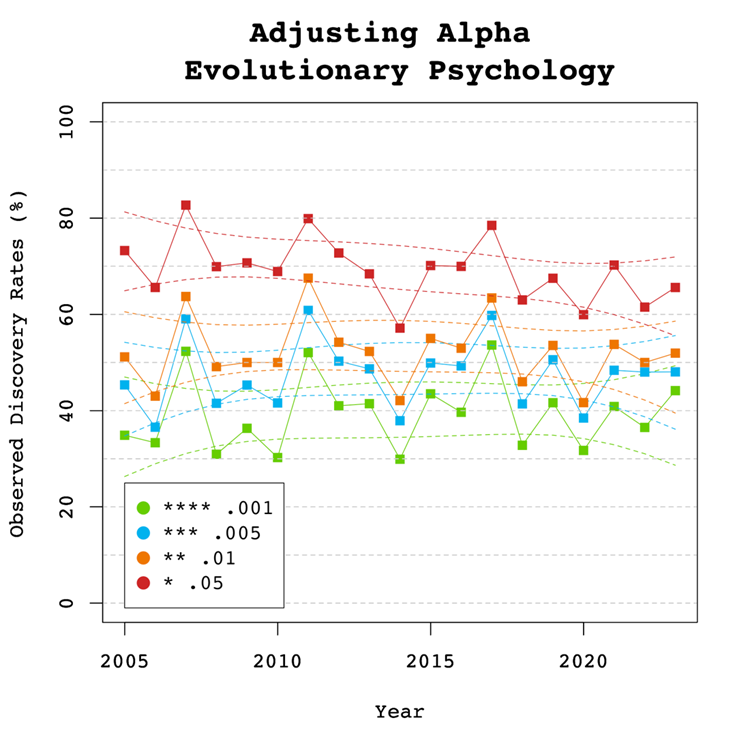
Figure 6
Figure 6 shows the impact of lowering the significance criterion, alpha, on the discovery rate (lower alpha implies fewer significant results). In Evolutionary Psychology lowering alpha to .01 reduces the observed discovery rate by about 20 to 10 percentage points. This implies that 20% of results reported p-values between .05 and .01. These results often have low success rates in actual replication studies (OSC, 2015). Thus, our recommendation is to set alpha to .01 to reduce the false positive risk to 5% and to disregard studies with weak evidence against the null-hypothesis. These studies require actual successful replications with larger samples to provide credible evidence for an evolutionary hypothesis.
There are relatively few studies with p-values between .01 and .005. Thus, more conservative researchers can use alpha = .005 without losing too many additional results.
Limitations
The main limitation of these results is the use of automatically extracted test statistics. This approach cannot distinguish between theoretically important statistical results and other results that are often reported but do not test focal hypotheses (e.g., testing the statistical significance of a manipulation check, reporting a non-significant result for a factor in a complex statistical design that was not expected to produce a significant result).
To examine the influence of automatic extraction on our results, we can compare the results to hand-coding results of over 4,000 hand-coded focal hypotheses in over 40 journals in 2010 and 2020. The ODR was 90% around 2010 and 88% around 2020. Thus, the tendency to report significant results for focal hypothesis tests is even higher than the ODR for all results and there is no indication that this bias has decreased notably over time. The ERR increased a bit from 61% to 67%, but these values are a bit lower than those reported here. Thus, it is possible that focal tests also have lower average power than other tests, but this difference seems to be small. The main finding is that the publishing of non-significant results for focal tests remains an exception in psychology journals and probably also in this journal.
One concern about the publication of our results is that it merely creates a new criterion to game publications. Rather than trying to get p-values below .05, researchers may use tricks to get p-values below .01. However, this argument ignores that it becomes increasingly harder to produce lower p-values with tricks (Simmons et al., 2011). Moreover, z-curve analysis makes it easy to see selection bias for different levels of significance. Thus, a more plausible response to these results is that researchers will increase sample sizes or use other methods to reduce sampling error to increase power.
Conclusion
The replicability report shows that the average power to report a significant result (i.e., a discovery) ranges from 49% to 72% in Evolutionary Psychology. This finding is higher than previous estimates observed in evolutionary psychology journals. However, the confidence intervals are wide and suggest that many published studies remain underpowered. The report did not capture any significant changes over time in the power and replicability as captured by the EDR and the ERR estimates. The false positive risk is modest and can be controlled by setting alpha to .01. Replication attempts of original findings with p-values above .01 should increase sample sizes to produce more conclusive evidence. Lastly, the journal shows clear evidence of selection bias.
There are several ways, the current or future editors of this journal can improve the credibility of results published in this journal. First, results with weak evidence (p-values between .05 and .01) should only be reported as suggestive results that require replication or even request a replication before publication. Second, editors should try to reduce publication bias by prioritizing research questions over results. A well-conducted study with an important question should be published even if the results are not statistically significant. Pre-registration and registered reports can help to reduce publication bias. Editors may also ask for follow-up studies with higher power to follow up on a non-significant result.
Publication bias also implies that point estimates of effect sizes are inflated. It is therefore important to take uncertainty in these estimates into account. Small samples with large sampling errors are usually unable to provide meaningful information about effect sizes and conclusions should be limited to the direction of an effect.
The present results serve as a benchmark for future years to track progress in this journal to ensure trust in research by evolutionary psychologists.
Citation: Soto, M. & Schimmack, U. (2024, July 4/08/13).  2024 Replicability Report for the Journal of Experimental Social Psychology.  Replicability Index.
https://replicationindex.com/2024/07/04/rr24-jesp/
Introduction
In the 2010s, it became apparent that empirical psychology had a replication problem. When psychologists tested the replicability of 100 results, they found that only 36% of the 97 significant results in original studies could be reproduced (Open Science Collaboration, 2015). In addition, several prominent cases of research fraud further undermined trust in published results. Over the past decade, several proposals were made to improve the credibility of psychology as a science. Replicability Reports aim to improve the credibility of psychological science by examining the amount of publication bias and the strength of evidence for empirical claims in psychology journals.
The main problem in psychological science is the selective publishing of statistically significant results and the blind trust in statistically significant results as evidence for researchers’ theoretical claims. Unfortunately, psychologists have been unable to self-regulate their behaviour and continue to use unscientific practices to hide evidence that disconfirms their predictions. Moreover, ethical researchers who do not use unscientific practices are at a disadvantage in a game that rewards publishing many articles without concern about these findings’ replicability. Replicability reports aim to reward journals that publish credible results and use open science practices that encourage honest reporting of results like preregistration or registered reports.
My colleagues and I have developed a statistical tools that can reveal the use of unscientific practices and predict the outcome of replication studies (Brunner & Schimmack, 2021; Bartos & Schimmack, 2022). This method is called z-curve. Z-curve cannot be used to evaluate the credibility of a single study. However, it can provide valuable information about the research practices in a particular research domain. Replicability-Reports (RR) analyze the statistical results reported in a journal with z-curve to estimate the replicability of published results, the amount of publication bias, and the risk that significant results are false positive results (i.e, the sign of a mean difference or correlation of a significant result does not match the sign in the population).
Journal of Experimental Social Psychology
The Journal of Experimental Social Psychology (JESP) was established in 1965. It is the oldest journal that specializes on experimental studies of social cognitions and behaviors. A replicability analysis of this journal is particularly interesting for several reasons. First, the long history of the journal makes it possible to examine historic trends in research practices in this field over a long time period. Second, experimental social psychology has triggered the crisis of confidence in psychological science with studies on extrasensory perception (Bem, 2011), implicit priming (Bargh et al., 1996), and ego depletion (Baumeister et al., 1996) that failed to replicate. At the same time, social psychology has responded to these replication failures by increasing sample sizes and rewarding open science practices like preregistration of analyses plans that limit researchers’ degrees of freedom to fish for significance or change hypotheses after examining the data.
On average, JESP publishes about 150 articles in 6 annual issues. According to Web of Science, the impact factor of JESP ranks 15th in the Psychology, Social category (Clarivate, 2024). The journal has an H-Index of 196 (i.e., 196 articles have received 196 or more citations).
In its lifetime, Journal of Experimental Social Psychology (JESP) has published over 4,200 articles with an average citation rate of 56.01 citations. So far, the journal has published 10 articles with more than 1,000 citations. Most of these have been published before the 2000s. The three most cited articles in the 2000s focus on improving methods used in social psychology research (Oppenheimer et al., 2009; Leys et al., 2013; Peer et al., 2017).
The Open Science Collaboration observed how only 14 out of 55 (25%) social psychology effects were replicated. A similar replicability estimate of 16% to 44% was measured for social psychology by Bartoš & Schimmack (2022). In response, many journals have implemented multiple strategies to improve the replicability and credibility of their published findings. Similarly, JESP introduced the “JESP’s 10-Item Submission Checklist” in 2022. The list entails a series of requirements that authors must fulfill to have their manuscripts reviewed. This checklist requires that authors provide their priori power analysis, sample size determination, and full reporting of all statistics including non-significant ones, among other items that aim to improve the quality of the submitted manuscripts. JESP’s focus on social psychology allows this report to highlight whether the proposed strategies to reform social psychology research meet their expectations.
The current Editor-in-Chief is Professor Nicholas Rule. Professor Kristin Laurin serves as the Senior Associate Editor. The associate editors are Professor Rachel Barkan, Professor Pamela K Smith, Professor Fiona Barlow, Professor Paul Conway, Professor Jarret Crawford, Professor Sarah Gaither, Professor Shlomo Hareli, Professor Edward Hirt, Professor Rachael Jack, Professor Joris Lammers, Professor Pranjal H. Mehta, Professor Kristin Pauker, Professor Brett Peters, Professor Evava Pietr, and Professor Karina Schumann.
Extraction Method
Replication reports are based on automatically extracted test statistics such as F-tests, t-tests, z-tests, and chi2-tests. Additionally, we extracted 95% confidence intervals of odds ratios and regression coefficients. The test statistics were extracted from collected PDF files using a custom R-code. The code relies on the pdftools R package (Ooms, 2024) to render all textboxes from a PDF file into character strings. Once converted the code proceeds to systematically extract the test statistics of interest (Soto & Schimmack, 2024). PDF files identified as editorials, review papers and meta-analyses were excluded. Meta-analyses were excluded to avoid the inclusion of test statistics that were not originally published in the Journal of Experimental Social Psychology. Following extraction, the test statistics are converted into absolute z-scores.
Results For All Years
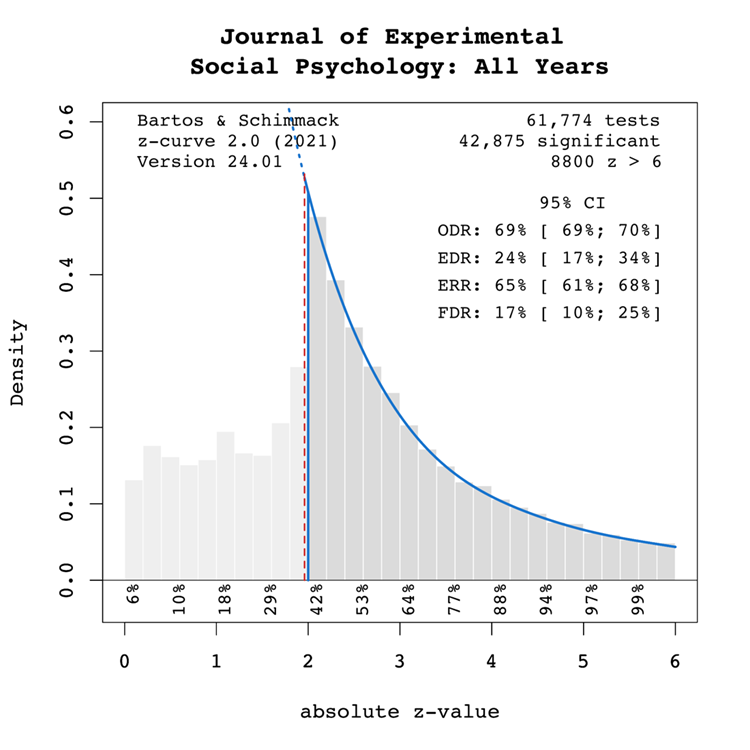
Figure 1 shows a z-curve plot for all articles from 2000-2023 (see Schimmack, 2023, for a detailed description of z-curve plots). The plot is essentially a histogram of all test statistics converted into absolute z-scores (i.e., the direction of an effect is ignored). Z-scores can be interpreted as the strength of evidence against the null hypothesis that there is no statistical relationship between two variables (i.e., the effect size is zero and the expected z-score is zero). A z-curve plot shows the standard criterion of statistical significance (alpha = .05, z = 1.96) as a vertical red dotted line.
Figure 1
Z-curve plots are limited to values less than z = 6. The reason is that values greater than 6 are so extreme that a successful replication is all but certain unless the value is a computational error or based on fraudulent data. The extreme values are still used for the computation of z-curve statistics but omitted from the plot to highlight the shape of the distribution for diagnostic z-scores in the range from 2 to 6. Using the expectation maximization (EM) algorithm, Z-curve estimates the optimal weights for seven components located at z-values of 0, 1, …. 6 to fit the observed statistically significant z-scores. The predicted distribution is shown as a blue curve. Importantly, the model is fitted to the significant z-scores, but the model predicts the distribution of non-significant results. This makes it possible to examine publication bias (i.e., selective publishing of significant results). Using the estimated distribution of non-significant and significant results, z-curve provides an estimate of the expected discovery rate (EDR); that is, the percentage of significant results that were actually obtained without selection for significance. Using Soric’s (1989) formula the EDR is used to estimate the false discovery risk; that is, the maximum number of significant results that are false positives (i.e., the null-hypothesis is true).
Selection for Significance
The extent of selection bias in a journal can be quantified by comparing the Observed Discovery Rate (ODR) of 69%, 95%CI = 69% to 70% with the Expected Discovery Rate (EDR) of 24%, 95%CI = 17%-34%. The ODR is notably higher than the upper confidence interval limit for the EDR, indicating statistically significant publication bias. Furthermore, there is clear evidence of selection for significance given that the ODR estimate is more than double the point estimate of the EDR.
It is also noteworthy that the present results probably underestimate severity of selection bias for focal hypothesis test. The present results do no distinguish between theoretically important and complementary analyses. It is known that focal hypothesis tests in psychology before the replication crisis have an observed success rate over 90% (Sterling, 1959; Sterling et al., 1995; Motyl et al., 2017). While it is possible that focal tests also have higher power, it is likely that the differences in the ODR larger than the differences in the EDR.
In conclusion, the present results are consistent with the finding that replication studies are more likely to produce non-significant results than reported original findings because selection for significance inflates the percentage of significant results in published articles (OSC, 2015).
Expected Replication Rate
The Expected Replication Rate (ERR) estimates the percentage of studies that would produce a significant result again if exact replications with the same sample size were conducted. A comparison of the ERR with the outcome of actual replication studies shows that the ERR is higher than the actual replication rate (Schimmack, 2020). Several factors can explain this discrepancy, including the difficulty of conducting exact replication studies. Thus, the ERR is an optimist estimate. A conservative estimate is the EDR. The EDR predicts replication outcomes if significance testing does not favour studies with higher power (larger effects and smaller sampling error) because statistical tricks make it just as likely that studies with low power are published. We suggest using the EDR and ERR in combination to estimate the actual replication rate.
The Expected Replication Rate (ERR) estimates the percentage of studies that would produce a significant result again if exact replications with the same sample size were conducted. A comparison of the ERR with the outcome of actual replication studies shows that the ERR is higher than the actual replication rate (Schimmack, 2020). Several factors can explain this discrepancy, such as the difficulty of conducting exact replication studies. Thus, the ERR is an optimist estimate. A conservative estimate is the EDR. The EDR predicts replication outcomes if significance testing does not favour studies with higher power (larger effects and smaller sampling error) because statistical tricks make it just as likely that studies with low power are published. We suggest using the EDR and ERR in combination to estimate the actual replication rate.
The ERR estimate of 65%, 95%CI = 61% to 68%, suggests that most results should produce a statistically significant, p < .05, result again in exact replication studies. However, the EDR of 24% implies considerable uncertainty about the actual replication rate for studies in this journal and that the success rate can be between 24% and 65%. These estimates can be compared with the actual success rate of replications of social psychological experiments in the Reproducibility Project of 25% (OSC, 2015). While this estimate is based on a small, unrepresentative sample, it does confirm that the replication rate of social psychological experiments can be as low as 1 out of 4 studies. This justifies concerns about the credibility of results published in JESP (see also Schimmack, 2020).
False Positive Risk
The replication crisis has led to concerns that many or even most published results are false positives (i.e., the true effect size is zero or in the opposite direction). The high rate of replication failures, however, may simply reflect low power to produce significant results for true positives and does not tell us how many published results are false positives. We can provide some information about the false positive risk based on the EDR. Using Soric’s formula (1989), the EDR can be used to calculate the maximum false discovery rate.
The EDR of 24% implies a False Discovery Risk (FDR) of 17%, 95%CI = 10% to 25%, but the 95%CI of the FDR allows for up to 25% false positive results. This estimate contradicts claims that most published results are false (Ioannidis, 2005), but the results also create uncertainty about the credibility of results with statistically significant results, if up to 1 out of 4 results can be false positives. For readers it may be difficult to decide whether a published results can be trusted.
Time Trends
One advantage of automatically extracted test-statistics is that the large number of test statistics makes it possible to examine changes in publication practices over time. We were particularly interested in changes in response to awareness about the replication crisis in recent years.
Z-curve plots for every publication year were calculated to examine time trends through regression analysis. Additionally, the degrees of freedom used in F-tests and t-tests were used as a metric of sample size to observe if these changed over time. Both linear and quadratic trends were considered. The quadratic term was included to observe if any changes occurred in response to the replication crisis. That is, there may have been no changes from 2000 to 2015, but increases in EDR and ERR after 2015.
Degrees of Freedom
Figure 2 shows the median and mean degrees of freedom used in F-tests and t-tests reported in the Journal of Experimental Social Psychology. The mean results are highly variable due to a few studies with extremely large sample sizes. Thus, we focus on the median to examine time trends. The median degree of freedom over time was 82.25, ranging from 60 to 302. Regression analyses of the median showed a significant linear increase by about 9 degrees of freedom per year, b = 9.13, SE = 0.62, p < 0.0001. Furthermore, there was a statistically significant non-linear increase, b = 0.94, SE = 0.10, p < 0.0001, suggesting that the replication crisis led to an increase in sample sizes. As larger samples increase power, we would expect an increase in the ERR and EDR.
Figure 2
Observed and Expected Discovery Rates
Figure 3 shows the changes in the ODR and EDR estimates over time. There was a significant linear decrease to the ODR estimate by 0.44 percentage points per year, b = -0.44, SE = 0.08, p < 0.0001. No significant non-linear, b = 0.01 (SE = 0.01, p = 0.27) trend was observed in the ODR estimate. These results show that researchers have published more non-significant results over time, leading to a decrease in selection bias.
The regression results for the EDR estimate showed significant linear, b = 1.14 (SE = 0.25 p < 0.001) and non-linear, b = 0.17 (SE = 0.04 p < 0.001) changes over time. The non-linear trend is consistent with the results for the degrees of freedom and confirms that power has increased after the replication crisis due to the use of larger samples. This also reduces selection bias. The trends for the ODR and EDR have narrowed the gap between the ODR and the EDR as seen in Figure 3. However, it remains to be seen whether this trend also applies to focal hypothesis tests.
Figure 3
Expected Replicability Rates and False Discovery Risks
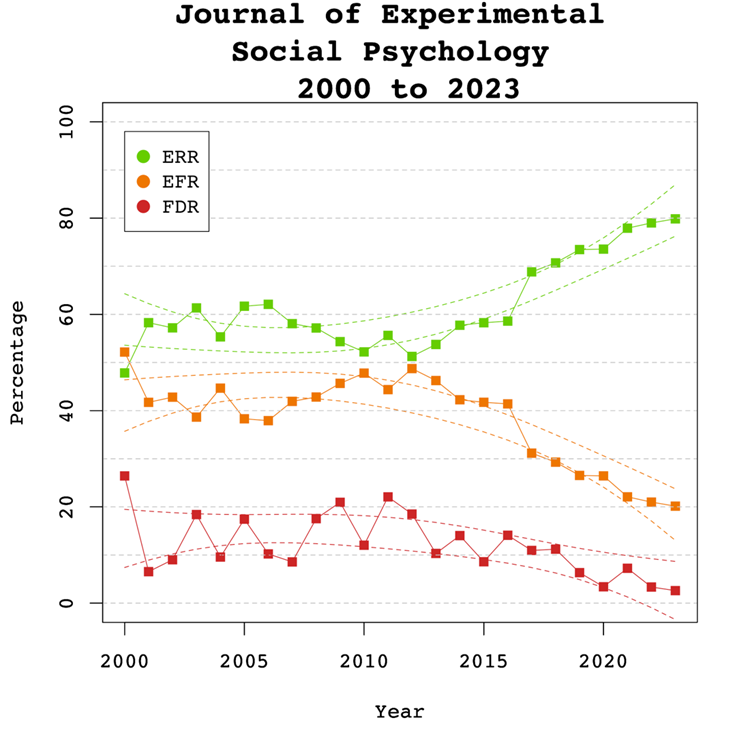
Figure 4 depicts the false discovery risk (FDR) and the Estimated Replication Rate (ERR). It also shows the Expected Replication Failure rate (EFR = 1 – ERR). A comparison of the EFR with the FDR provides information for the interpretation of replication failures. If the FDR is close to the EFR, many replication failures may be due to false positive results in original studies. In contrast, if the FDR is low, most replication failures will likely be false negative results in underpowered replication studies.
There were no significant linear, b = 0.13, SE = 0.10, p = 0.204 or non-linear, b = 0.01, SE = 0.16, p = 0.392 trends observed in the ERR estimate. These findings are inconsistent with the observed significant increase in sample sizes as the reduction in sampling error often increases the likelihood that an effect will replicate. One possible explanation for this is that the type of studies has changed. If a journal publishes more studies from disciplines with large samples and small effect sizes, sample sizes go up without increasing power. Thus, analysis of sample size alone provide insufficient information about the credibility of published results.
Visual inspection of Figure 4 depicts the EFR consistently around 30% and the FDR around 10%, suggesting that about one-third of replication failures are false positive results in original studies. The larger decrease for the EFR than the FDR suggests that larger samples have mainly reduced false negative results and increasing the probability that a replication failure reveals a false positive result in the original study.
Figure 4
Adjusting Alpha
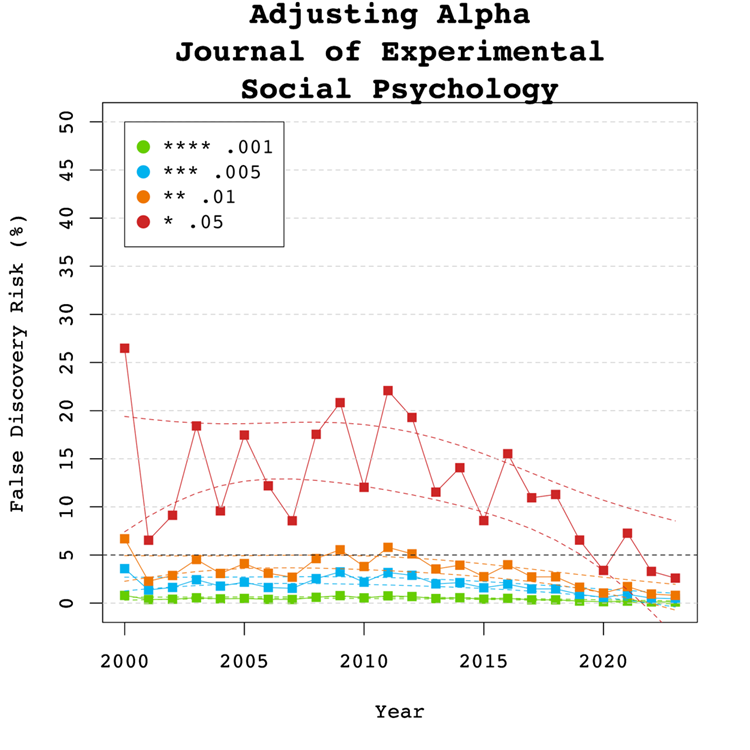
A simple solution to a crisis of confidence in published results is to adjust the criterion to reject the null-hypothesis. For example, some researchers have proposed to set alpha to .005 to avoid too many false positive results. With z-curve we can calibrate alpha to keep the false discovery risk at an acceptable level without discarding too many true positive results. To do so, we set alpha to .05, .01, .005, and .001 and examined the false discovery risk.
Figure 5
Figure 5 shows that the conventional criterion of p < .05 produces false discovery risks above 5%. The high variability in annual estimates also makes it difficult to provide precise estimates of the FDR. However, adjusting alpha to .01 is sufficient to produce an FDR with tight confidence intervals below 5%. More conservative readers might adjust to p < 0.005 for results published between 2007 and 2013. Overall, the benefits of reducing alpha further to .005 or .001 are minimal.
Figure 6
Figure 6 shows the impact of lowering the significance criterion, alpha, on the discovery rate (lower alpha implies fewer significant results). In the Journal of Experimental Social Psychology lowering alpha to .01 reduces the observed discovery rate considerably in the years before the replication crisis from about 70-80% to just 40-50% of reported results. The reason is that statistical tricks are more likely to produce just significant results between .05 and .01 than lower p-values (Simmons et al., 2011). Therese results are also much less likely to replicate (OSC, 2015). Thus, it is reasonable to treat these results as not significant and to require a credible replication study. In recent years, more p-values are below .01 and using alpha = .01 as significance criterion has relatively little impact on the discovery rate. Lowering alpha further has relatively little effect on the discovery rate. While these results should not be interpreted as a call for official changes to the alpha criterion, they help readers to evaluate the costs and benefits of using a specific alpha level. We believe that alpha = .01 provides an optimal trade-off for results published in JESP.
Limitations
One concern about the publication of our results is that it merely creates a new criterion to game publications. Rather than trying to get p-values below .05, researchers may use tricks to get p-values below .01. However, this argument ignores that it becomes increasingly harder to produce lower p-values with tricks (Simmons et al., 2011). Moreover, z-curve analysis makes it easy to see selection bias for different levels of significance. Thus, a more plausible response to these results is that researchers will increase sample sizes or use other methods to reduce sampling error to increase power. Our trend analyses show that this has already happened and that results published after 2015 are more credible.
A bigger concern is that our results underestimate the severity of the problem because they do not distinguish between theoretically important (focal) and additional (non-focal) hypothesis tests. To address this concern it is necessary to identify focal hypothesis tests and to hand-code results of these tests. For JESP, we were able to use hand-coded data from Motyl et al.’s (2017) article that randomly selected focal hypothesis tests from several journals, including JESP. The data are based on the years 2003, 2004, 2013, and 2014 and are representative for the years before reforms increased replicability (see Figures 3 & 4).
Figure 7
The ODR is similar to the ODR for all test statistics (70% vs. 69%, but non-significant results are clustered just below the significance level of .05 and are often used to reject the null-hypothesis with “marginal significance” (p < .10, z > 1.65). If these results are counted as ‘significant’, the ODR is 87%, which is close to Sterling et al.’s (1995) findings that over 90% of hypothesis tests in psychology reject the null-hypothesis. In contrast, the estimate of the expected discovery rate is only 14%, which is lower than the estimate for all hypothesis tests (Figure 1, 24%). Although the small number of studies leads to wide confidence intervals, the results suggest that focal tests have even lower power than other tests. The confidence interval for the EDR even includes 5%, which would imply that power equals alpha, which is the case when the population effect sizes are zero. This also implies that the confidence interval for the FDR includes 100%, suggesting that all focal hypothesis are false. Of course, it is unlikely that social psychologists only reported false results for decades, but the evidence is so weak that it is impossible to know which of these results are true and which ones are false. In this case, adjusting alpha does not help because the upper limit of the FDR confidence interval remains at 100% because the lower bound of the confidence interval for the EDR remains at 5%. Until more evidence for focal tests is obtained, it may be justified to use the results for all tests, but the false discovery risk for focal tests with p-values below .01 may be higher than 5%. Given so much uncertainty about results published in JESP before 2015, single studies should not be interpreted and important studies should be replicated with larger samples and preregistration.
Conclusion
The replicability report for the Journal of Experimental Social Psychology suggests that the power to obtain a significant result to report a significant result (i.e., a discovery) ranges from 24% to 65%, and may be even lower for focal hypothesis tests. This finding suggests that many studies are underpowered and require luck to get a significant result. The false positive risk is considerable but can be controlled by setting alpha to .01 during most years. However, an analysis of a small set of focal tests suggests that this criterion is too liberal for focal tests, but it is impossible to quantify the false discovery risk for focal tests.
Our results show clear evidence of improvement in response to the replication crisis. Power has increased with the help of larger samples and selection bias has decreased. This is a welcome development. It also means that our recommendation to use alpha of .01 penalizes only a smaller set of studies with p-values between .05 and .01. Of course, these results can occur by chance and can be false negatives, but in this case researchers should conduct additional studies to strengthen evidence for their hypothesis.
Hand-coding of focal tests after 2015 would provide important information about the credibility of focal tests in recent years. One important question is whether the journal publishes studies with non-significant results in large samples that suggest a hypothesis was false. These results would best be reported with 95%CI that limit plausible effect sizes to values close to zero. After all, risky hypotheses are bound to be false sometimes.
In conclusion, our results provide some valuable empirical evidence about the credibility of results published in JESP. The main finding is that results before the replication crisis had low credibility and were often obtained by selectively reporting confirmatory evidence. This has changed and results in recent years have much less selection bias and are more credible.
In the 2010s, it became apparent that empirical psychology has a replication problem. When psychologists tested the replicability of 100 results, they found that only 36% of the 97 significant results in original studies could be reproduced (Open Science Collaboration, 2015). In addition, several prominent cases of research fraud further undermined trust in published results. Over the past decade, several proposals were made to improve the credibility of psychology as a science. Replicability reports are the results of one of these initiatives.
The main problem in psychological science is the selective publishing of statistically significant results and the blind trust in statistically significant results as evidence for researchers’ theoretical claims. Unfortunately, psychologists have been unable to self-regulate their behavior and continue to use unscientific practices to hide evidence that disconfirms their predictions. Moreover, ethical researchers who do not use unscientific practices are at a disadvantage in a game that rewards publishing many articles without any concern about the replicability of these findings.
My colleagues and I have developed a statistical tools that can reveal the use of unscientific practices and predict the outcome of replication studies (Brunner & Schimmack, 2021; Bartos & Schimmack, 2022). This method is called z-curve. Z-curve cannot be used to evaluate the credibility of a single study. However, it can provide valuable information about the research practices in a particular research domain.
Research reports use z-curve to provide information about psychological journals. This information can be used by authors to chose journals they want to publish in, provides feedback to journal editors who have influence on selection bias and replicability of results published in their journals, and most importantly to readers of these journals.
List of Journals with Replicability Reports for 2024
In the 2010s, it became apparent that empirical psychology had a replication problem. When psychologists tested the replicability of 100 results, they found that only 36% of the 97 significant results in original studies could be reproduced (Open Science Collaboration, 2015). In addition, several prominent cases of research fraud further undermined trust in published results. Over the past decade, several proposals were made to improve the credibility of psychology as a science. Replicability Reports aim to improve the credibility of psychological science by examining the amount of publication bias and the strength of evidence for empirical claims in psychology journals.
The main problem in psychological science is the selective publishing of statistically significant results and the blind trust in statistically significant results as evidence for researchers’ theoretical claims. Unfortunately, psychologists have been unable to self-regulate their behavior and continue to use unscientific practices to hide evidence that disconfirms their predictions. Moreover, ethical researchers who do not use unscientific practices are at a disadvantage in a game that rewards publishing many articles without any concern about the replicability of these findings.
My colleagues and I have developed a statistical tools that can reveal the use of unscientific practices and predict the outcome of replication studies (Brunner & Schimmack, 2021; Bartos & Schimmack, 2022). This method is called z-curve. Z-curve cannot be used to evaluate the credibility of a single study. However, it can provide valuable information about the research practices in a particular research domain. Replicability-Reports (RR) analyze the statistical results reported in a journal with z-curve to estimate the replicability of published results, the amount of publication bias, and the risk that significant results are false positive results (i.e, the sign of a mean difference or correlation of a significant result does not match the sign in the population).
Acta Psychologica
Acta Psychologica is an old psychological journal that was founded in 1936. The journal publishes articles from various areas of psychology, but cognitive psychological research seems to be the most common area. Since 2021, the journal is a Gold Open Access journal that charges authors a $2,000 publication fee.
On average, Acta Psychologica publishes about 150 articles a year in 9 annual issues.
According to Web of Science, the impact factor of Acta Psychologica ranks 44th in the Experimental Psychology category (Clarivate, 2024). The journal has an H-Index of 140 (i.e., 140 articles have received 140 or more citations).
In its lifetime, Acta Psychologica has published over 6,000 articles with an average citation rate of 21.5 citations. So far, the journal has published 5 articles with more than 1,000 citations. However, most of these articles were published in the 1960s and 1970s. The most highly cited article published in the 2000s examined the influence of response categories on the psychometric properties of survey items (Preston & Colman, 2000; 1055 citations).
Psychology literature has faced difficult realizations in the last decade. Acta Psychologica is a broad-scope journal that offers us the possibility to observe changes in the robustness of psychological research practices and results. The current report serves as a glimpse into overall trends in psychology literature as it considers research from multiple subfields.
Given the multidisciplinary nature of the journal, the journal has a team of editors. The current editors are Dr. Muhammad Abbas, Dr. Mohamed Alansari, Dr. Colin Cooper, Dr. Valerie De Cristofaro, Dr. Nerelie Freeman, Professor, Alessandro Gabbiadini, Professor Matthieu Guitton, Dr. Nhung T Hendy, Dr. Amanpreet Kaur, Dr. Shengjie Lin, Dr. Hui Jing Lu, Professor Robrecht Van Der Wel and Dr. Olvier Weigelt.
Extraction Method
Replication reports are based on automatically extracted test statistics such as F-tests, t-tests, z-tests, and chi2-tests. Additionally, we extracted 95% confidence intervals of odds ratios and regression coefficients. The test statistics were extracted from collected PDF files using a custom R-code. The code relies on the pdftools R package (Ooms, 2024) to render all textboxes from a PDF file into character strings. Once converted the code proceeds to systematically extract the test statistics of interest (Soto & Schimmack, 2024). PDF files identified as editorials, review papers and meta-analyses were excluded. Meta-analyses were excluded to avoid the inclusion of test statistics that were not originally published in Acta Psychologica Following extraction, the test statistics are converted into absolute z-scores.
Results For All Years
Figure 1 shows a z-curve plot for all articles from 2000-2023 (see Schimmack, 2022a, 2022b, for a detailed description of z-curve plots). The plot is essentially a histogram of all test statistics converted into absolute z-scores (i.e., the direction of an effect is ignored). Z-scores can be interpreted as the strength of evidence against the null hypothesis that there is no statistical relationship between two variables (i.e., the effect size is zero and the expected z-score is zero). A z-curve plot shows the standard criterion of statistical significance (alpha = .05, z = 1.96) as a vertical red dotted line.
Figure 1
Z-curve plots are limited to values less than z = 6. The reason is that values greater than 6 are so extreme that a successful replication is all but certain unless the value is a computational error or based on fraudulent data. The extreme values are still used for the computation of z-curve statistics but omitted from the plot to highlight the shape of the distribution for diagnostic z-scores in the range from 2 to 6. Using the expectation maximization (EM) algorithm, Z-curve estimates the optimal weights for seven components located at z-values of 0, 1, …. 6 to fit the observed statistically significant z-scores. The predicted distribution is shown as a blue curve. Importantly, the model is fitted to the significant z-scores, but the model predicts the distribution of non-significant results. This makes it possible to examine publication bias (i.e., selective publishing of significant results). Using the estimated distribution of non-significant and significant results, z-curve provides an estimate of the expected discovery rate (EDR); that is, the percentage of significant results that were actually obtained without selection for significance. Using Soric’s (1989) formula the EDR is used to estimate the false discovery risk; that is, the maximum number of significant results that are false positives (i.e., the null-hypothesis is true).
Selection for Significance
The extent of selection bias in a journal can be quantified by comparing the Observed Discovery Rate (ODR) of 70%, 95%CI = 70% to 71% with the Expected Discovery Rate (EDR) of 38%, 95%CI = 27%-54%. The ODR is notably higher than the upper limit of the confidence interval for the EDR, indicating statistically significant publication bias. It is noteworthy that the present results may underestimate the severity of the problem because the analysis is based on all statistical results. Selection bias is even more problematic for focal hypothesis tests and the ODR for focal tests in psychology journals is often higher than the ODR for all tests. Thus, the current results are a conservative estimate of bias for critical hypothesis tests.
Expected Replication Rate
The Expected Replication Rate (ERR) estimates the percentage of studies that would produce a significant result again if exact replications with the same sample size were conducted. A comparison of the ERR with the outcome of actual replication studies shows that the ERR is higher than the actual replication rate (Schimmack, 2020). Several factors can explain this discrepancy, including the difficulty of conducting exact replication studies. Thus, the ERR is an optimist estimate. A conservative estimate is the EDR. The EDR predicts replication outcomes if significance testing does not favour studies with higher power (larger effects and smaller sampling error) because statistical tricks make it just as likely that studies with low power are published. We suggest using the EDR and ERR in combination to estimate the actual replication rate.
The ERR estimate of 73%, 95%CI = 69% to 77%, suggests that the majority of results should produce a statistically significant, p < .05, result again in exact replication studies. However, the EDR of 38% implies that there is considerable uncertainty about the actual replication rate for studies in this journal and that the success rate can be anywhere between 27% and 77%.
False Positive Risk
The replication crisis has led to concerns that many or even most published results are false positives (i.e., the true effect size is zero or in the opposite direction). The high rate of replication failures, however, may simply reflect low power to produce significant results for true positives and does not tell us how many published results are false positives. We can provide some information about the false positive risk based on the EDR. Using Soric’s formula (1989), the EDR can be used to calculate the maximum false discovery rate.
The EDR of 38% for Acta Psychologica implies a False Discovery Risk (FDR) of 9%, 95%CI = 5% to 15%, but the 95%CI of the FDR allows for up to 15% false positive results. This estimate contradicts claims that most published results are false (Ioannidis, 2005), but is probably a bit higher than many readers of this journal would like.
Time Trends
One advantage of automatically extracted test-statistics is that the large number of test statistics makes it possible to examine changes in publication practices over time. We were particularly interested in changes in response to awareness about the replication crisis in recent years.
Z-curve plots for every publication year were calculated to examine time trends through regression analysis. Additionally, the degrees of freedom used in F-tests and t-tests were used as a metric of sample size to observe if these changed over time. Both linear and quadratic trends were considered. The quadratic term was included to observe if any changes occurred in response to the replication crisis. That is, there may have been no changes from 2000 to 2015 but increases in EDR and ERR after 2015.
Degrees of Freedom
Figure 2 shows the median and mean degrees of freedom used in F-tests and t-tests reported in Acta Psychologica. The mean results are highly variable due to a few studies with extremely large sample sizes. Thus, we focus on the median to examine time trends. The median degrees of freedom over time was 38, ranging from 22 to 74. Regression analyses of the median showed a significant linear increase of a 1.4 degrees of freedom per year, b = 1.39, SE = 3.00, p < 0.0001. Furthermore, the results suggest the replication crisis influenced a significant increase in sample sizes noted by the significant non-linear trend, b = 0.09, SE = 0.03, p = 0.007.
Figure 2
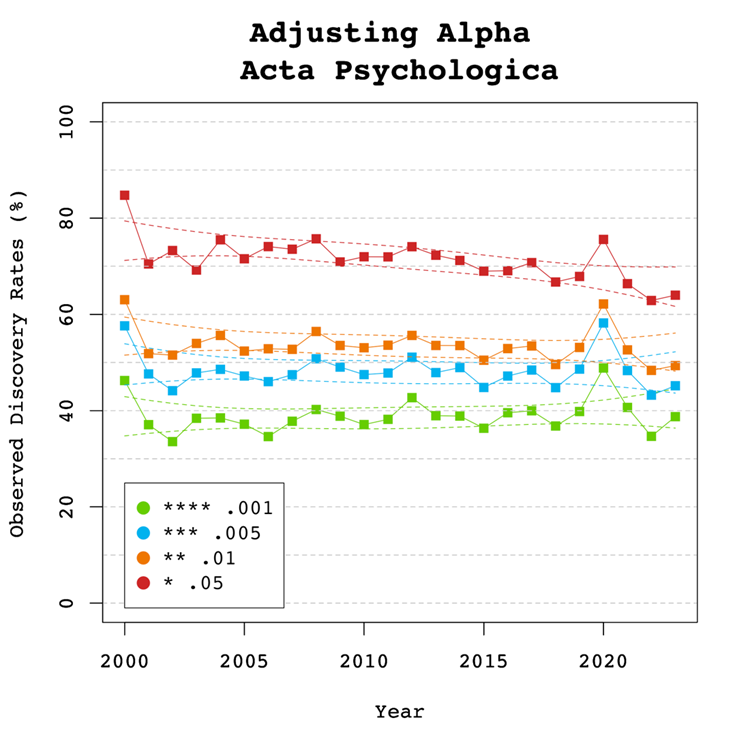
Observed and Expected Discovery Rates
Figure 3 shows the changes in the ODR and EDR estimates over time. The ODR estimate showed a significant linear decrease of about b = -0.42 (SE = 0.10 p = 0.001) percentage points per year. The results did not show a significant non-linear trend in the ODR estimate, b = -0.10 (SE = 0.02, p = 0.563. The regression results for the EDR estimate showed no significant trends, linear, b = 0.04, SE = 0.37, p = 0.903, non-linear, b = 0.01, SE = 0.06, p = 0.906.
These findings indicate the journal has increased the publication of non-significant results. However, there is no evidence that this change occurred in response to the replicability crisis. Even with this change, the ODR and EDR estimates do not overlap, indicating that selection bias is still present. Furthermore, the lack of changes to the EDR suggests that many studies continue to be statistically underpowered to detect true effects.
Figure 3
Expected Replicability Rates and False Discovery Risks
Figure 4 depicts the false discovery risk (FDR) and the Estimated Replication Rate (ERR). It also shows the Expected Replication Failure rate (EFR = 1 – ERR). A comparison of the EFR with the FDR provides information for the interpretation of replication failures. If the FDR is close to the EFR, many replication failures may be due to false positive results in original studies. In contrast, if the FDR is low, most replication failures will likely be false negative results in underpowered replication studies.
There were no significant linear, b = 0.13, SE = 0.10, p = 0.204 or non-linear, b = 0.01, SE = 0.16, p = 0.392 trends observed in the ERR estimate. These findings are inconsistent with the observed significant increase in sample sizes as the reduction in sampling error often increases the likelihood that an effect will replicate. One possible explanation for this is that the type of studies has changed. If a journal publishes more studies from disciplines with large samples and small effect sizes, sample sizes go up without increasing power.
Given the lack of change in the EDR and ERR estimate over time, many published significant results are based on underpowered studies that are difficult to replicate.
Figure 4
Visual inspection of Figure 4 depicts the EFR consistently around 30% and the FDR around 10%, suggesting that about 30% of replication failures are false positives.
Adjusting Alpha
A simple solution to a crisis of confidence in published results is to adjust the criterion to reject the null-hypothesis. For example, some researchers have proposed to set alpha to .005 to avoid too many false positive results. With z-curve, we can calibrate alpha to keep the false discovery risk at an acceptable level without discarding too many true positive results. To do so, we set alpha to .05, .01, .005, and .001 and examined the false discovery risk.
Figure 5
Figure 5 shows that the conventional criterion of p < .05 produces false discovery risks above 5%. The high variability in annual estimates also makes it difficult to provide precise estimates of the FDR. However, adjusting alpha to .01 is sufficient to produce an FDR with tight confidence intervals below 5%. The benefits of reducing alpha further to .005 or .001 are minimal.
Figure 6
Figure 6 shows the impact of lowering the significance criterion, alpha, on the discovery rate (lower alpha implies fewer significant results). In Acta Psychologica lowering alpha to .01 reduces the observed discovery rate by about 20 percentage points. This implies that 20% of results reported p-values between .05 and .01. These results often have low success rates in actual replication studies (OSC, 2015). Thus, our recommendation is to set alpha to .01 to reduce the false positive risk to 5% and to disregard studies with weak evidence against the null-hypothesis. These studies require actual successful replications with larger samples to provide credible evidence for an evolutionary hypothesis. There are relatively few studies with p-values between .01 and .005. Thus, more conservative researchers can use alpha = .005 without losing too many additional results.
Limitations
The main limitation of these results is the use of automatically extracted test statistics. This approach cannot distinguish between theoretically important statistical results and other results that are often reported but do not test focal hypotheses (e.g., testing the statistical significance of a manipulation check, reporting a non-significant result for a factor in a complex statistical design that was not expected to produce a significant result).
Hand-coding of 81 studies in 2010 and 112 studies from 2020 showed ODRs of 98%, 95%CI = 94%-100% and 91%, 95%CI = 86%-96%, suggesting a slight increase in reporting of non-significant focal tests. However, ODRs over 90% suggest that publication bias is still present in this journal. ERR estimates were similar and the small sample size made it impossible to obtain reliable estimates of the EDR and FDR.
One concern about the publication of our results is that it merely creates a new criterion to game publications. Rather than trying to get p-values below .05, researchers may use tricks to get p-values below .01. However, this argument ignores that it becomes increasingly harder to produce lower p-values with tricks (Simmons et al., 2011). Moreover, z-curve analysis makes it easy to see selection bias for different levels of significance. Thus, a more plausible response to these results is that researchers will increase sample sizes or use other methods to reduce sampling error to increase power.
Conclusion
The replicability report for Acta Psychologica shows clear evidence of selection bias, although there is a trend that selection bias has decreased due to reporting of more non-significant results, but not necessarily focal ones. The power to obtain a significant result to report a significant result (i.e., a discovery) ranges from 38% to 73%. This finding suggests that many studies are underpowered and require luck to get a significant result. The false positive risk is modest and can be controlled by setting alpha to .01. Replication attempts of original findings with p-values above .01 should increase sample sizes to produce more conclusive evidence.
There are several ways, the current or future editors of this journal can improve credibility of results published in this journal. First, results with weak evidence (p-values between .05 and .01) should only be reported as suggestive results that require replication or even request a replication before publication. Second, editors should try to reduce publication bias by prioritizing research questions over results. A well-conducted study with an important question should be published even if the results are not statistically significant. Pre-registration and registered reports can help to reduce publication bias. Editors may also ask for follow-up studies with higher power to follow up on a non-significant result.
Publication bias also implies that point estimates of effect sizes are inflated. It is therefore important to take uncertainty in these estimates into account. Small samples with large sampling errors are usually unable to provide meaningful information about effect sizes and conclusions should be limited to the direction of an effect.
We hope that these results provide readers of this journal with useful informatoin to evaluate the credibility of results reported in this journal. The results also provide a benchmark to evaluate the influence of reforms on the credibility of psychological science. We hope that reform initiatives will increase power and decrease publication bias and false positive risks.
In the 2010s, it became apparent that empirical psychology had a replication problem. When psychologists tested the replicability of 100 results, they found that only 36% of the 97 significant results in original studies could be reproduced (Open Science Collaboration, 2015). In addition, several prominent cases of research fraud further undermined trust in published results. Over the past decade, several proposals were made to improve the credibility of psychology as a science. Replicability Reports aim to improve the credibilty of psychological science by examining the amount of publication bias and the strength of evidence for empirical claims in psychology journals.
The main problem in psychological science is the selective publishing of statistically significant results and the blind trust in statistically significant results as evidence for researchers’ theoretical claims. Unfortunately, psychologists have been unable to self-regulate their behaviour and continue to use unscientific practices to hide evidence that disconfirms their predictions. Moreover, ethical researchers who do not use unscientific practices are at a disadvantage in a game that rewards publishing many articles without concern about these findings’ replicability.
My colleagues and I have developed a statistical tool that can reveal the use of unscientific practices and predict the outcome of replication studies (Brunner & Schimmack, 2021; Bartos & Schimmack, 2022). This method is called z-curve. Z-curve cannot be used to evaluate the credibility of a single study. However, it can provide valuable information about the research practices in a particular research domain.
Replicability-Reports (RR) use z-curve to provide information about psychological journal research and publication practices. This information can aid authors choose journals they want to publish in, provide feedback to journal editors who influence selection bias and replicability of published results, and, most importantly, to readers of these journals.
Evolution & Human Behavior
Evolution & Human Behavior is the official journal of the Human Behaviour and Evolution Society. It is an interdisciplinary journal founded in 1997. The journal publishes articles on human behaviour from an evolutionary perspective. On average, Evolution & Human Behavior publishes about 70 articles a year in 6 annual issues.
Evolutionary psychology has produced both highly robust and questionable results. Robust results have been found for sex differences in behaviors and attitudes related to sexuality. Questionable results have been reported for changes in women’s attitudes and behaviors as a function of hormonal changes throughout their menstrual cycle.
According to Web of Science, the impact factor of Evolution & Human Behaviour ranks 5th in the Behavioural Sciences category and 2nd in the Psychology, Biological category (Clarivate, 2024). The journal has an H-Index of 122 (i.e., 122 articles have received 122 or more citations).
In its lifetime, Evolution & Human Behavior has published over 1,400. Articles published by this journal have an average citation rate of 46.2 citations. So far, the journal has published 2 articles with more than 1,000 citations. The most highly cited article dates back to 2001 in which the authors argued that prestige evolved as a non-coercive social status to enhance the quality of “information goods” acquired via cultural transmission (Henrich & Gil-White, 2001).
The current Editor-in-Chief is Professor Debra Lieberman. The associate editors are Professor Greg Bryant, Professor Aaron Lukaszewski, and Professor David Puts.
Extraction Method
Replication reports are based on automatically extracted test statistics such as F-tests, t-tests, z-tests, and chi2-tests. Additionally, we extracted 95% confidence intervals of odds ratios and regression coefficients. The test statistics were extracted from collected PDF files using a custom R-code. The code relies on the pdftools R package (Ooms, 2024) to render all textboxes from a PDF file into character strings. Once converted the code proceeds to systematically extract the test statistics of interest (Soto & Schimmack, 2024). PDF files identified as editorials, review papers and meta-analyses were excluded. Meta-analyses were excluded to avoid the inclusion of test statistics that were not originally published in Evolution & Human Behavior. Following extraction, the test statistics are converted into absolute z-scores.
Results For All Years
Figure 1 shows a z-curve plot for all articles from 2000-2023 (see Schimmack, 2023, for a detailed description of z-curve plots). The plot is essentially a histogram of all test statistics converted into absolute z-scores (i.e., the direction of an effect is ignored). Z-scores can be interpreted as the strength of evidence against the null hypothesis that there is no statistical relationship between two variables (i.e., the effect size is zero and the expected z-score is zero). A z-curve plot shows the standard criterion of statistical significance (alpha = .05, z = 1.96) as a vertical red dotted line.
Figure 1
Z-curve plots are limited to values less than z = 6. The reason is that values greater than 6 are so extreme that a successful replication is all but certain unless the value is a computational error or based on fraudulent data. The extreme values are still used for the computation of z-curve statistics but omitted from the plot to highlight the shape of the distribution for diagnostic z-scores in the range from 2 to 6. Using the expectation maximization (EM) algorithm, Z-curve estimates the optimal weights for seven components located at z-values of 0, 1, …. 6 to fit the observed statistically significant z-scores. The predicted distribution is shown as a blue curve. Importantly, the model is fitted to the significant z-scores, but the model predicts the distribution of non-significant results. This makes it possible to examine publication bias (i.e., selective publishing of significant results). Using the estimated distribution of non-significant and significant results, z-curve provides an estimate of the expected discovery rate (EDR); that is, the percentage of significant results that were actually obtained without selection for significance. Using Soric’s (1989) formula the EDR is used to estimate the false discovery risk; that is, the maximum number of significant results that are false positives (i.e., the null-hypothesis is true).
Selection for Significance
The extent of selection bias in a journal can be quantified by comparing the Observed Discovery Rate (ODR) of 64%, 95%CI = 63% to 65% with the Expected Discovery Rate (EDR) of 28%, 95%CI = 17%-42%. The ODR is notably higher than the upper limit of the confidence interval for the EDR, indicating statistically significant publication bias. The ODR is also more than double than the point estimate of the EDR, indicating that publication bias is substantial. Thus, there is clear evidence of the common practice to omit reports of non-significant results. The present results may underestimate the severity of the problem because the analysis is based on all statistical results. Selection bias is even more problematic for focal hypothesis tests and the ODR for focal tests in psychology journals is often close to 90%.
Expected Replication Rate
The Expected Replication Rate (ERR) estimates the percentage of studies that would produce a significant result again if exact replications with the same sample size were conducted. A comparison of the ERR with the outcome of actual replication studies shows that the ERR is higher than the actual replication rate (Schimmack, 2020). Several factors can explain this discrepancy, such as the difficulty of conducting exact replication studies. Thus, the ERR is an optimist estimate. A conservative estimate is the EDR. The EDR predicts replication outcomes if significance testing does not favour studies with higher power (larger effects and smaller sampling error) because statistical tricks make it just as likely that studies with low power are published. We suggest using the EDR and ERR in combination to estimate the actual replication rate.
The ERR estimate of 71%, 95%CI = 66% to 77%, suggests that the majority of results should produce a statistically significant, p < .05, result again in exact replication studies. However, the EDR of 28% implies that there is considerable uncertainty about the actual replication rate for studies in this journal and that the success rate can be anywhere between 28% and 71%.
False Positive Risk
The replication crisis has led to concerns that many or even most published results are false positives (i.e., the true effect size is zero). Using Soric’s formula (1989), the maximum false discovery rate can be calculated based on the EDR.
The EDR of 28% implies a False Discovery Risk (FDR) of 14%, 95%CI = 7% to 26%, but the 95%CI of the FDR allows for up to 26% false positive results. This estimate contradicts claims that most published results are false (Ioannidis, 2005), but the results also create uncertainty about the credibility of results with statistically significant results, if up to 1 out of 4 results can be false positives.
Changes Over Time
One advantage of automatically extracted test-statistics is that the large number of test statistics makes it possible to examine changes in publication practices over time. We were particularly interested in changes in response to awareness about the replication crisis in recent years.
Z-curve plots for every publication year were calculated to examine time trends through regression analysis. Additionally, the degrees of freedom used in F-tests and t-tests were used as a metric of sample size to observe if these changed over time. Both linear and quadratic trends were considered. The quadratic term was included to observe if any changes occurred in response to the replication crisis. That is, there may have been no changes from 2000 to 2015, but increases in EDR and ERR after 2015.
Degrees of Freedom
Figure 2 shows the median and mean degrees of freedom used in F-tests and t-tests reported in Evolution & Human Behavior. The mean results are highly variable due to a few studies with extremely large sampel sizes. Thus, we focus on the median to examine time trends. The median degrees of freedom over time was 107.75, ranging from 54 to 395. Regression analyses of the median showed a significant linear increase by 4 to 5 degrees of freedom per year, b = 4.57, SE = 1.69, p = 0.013. However, there was no evidence that the replication crisis influenced a significant increase in sample sizes as seen by the lack of a significant non-linear trend and a small regression coefficient, b = 0.50, SE = 0.27, p = 0.082.
Figure 2
Observed and Expected Discovery Rates
Figure 3 shows the changes in the ODR and EDR estimates over time. There were no significant linear, b = 0.06 (SE = 0.17 p = 0.748) or non-linear, b = -0.02 (SE = 0.03, p = 0.435) trends observed in the ODR estimate. The regression results for the EDR estimate showed no significant linear, b = 0.75 (SE = 0.51 p = 0.153) or non-linear, b = 0.04 (SE = 0.08 p = 0.630) changes over time. These findings indicate the journal has not increased its publication of non-significant results even though selection bias is heavily present. Furthermore, the lack of changes to the EDR suggests that many studies continue to be statistically underpowered to measure the effect sizes of interest.
Figure 3
Expected Replicability Rates and False Discovery Risks
Figure 4 depicts the false discovery risk (FDR) and the Estimated Replication Rate (ERR). It also shows the Expected Replication Failure rate (EFR = 1 – ERR). A comparison of the EFR with the FDR provides information for the interpretation of replication failures. If the FDR is close to the EFR, many replication failures may be due to false positive results in original studies. In contrast, if the FDR is low, most replication failures will likely be false negative results in underpowered replication studies.
The ERR estimate showed a significant linear increase over time, b = 0.61, SE = 0.26, p = 0.031. No significant non-linear trend was observed, b = 0.07, SE = 0.4, p = 0.127. These findings are consistent with the observed significant increase in sample sizes as the reduction in sampling error increases the likelihood that an effect will replicate.
The significant increase in the ERR without a significant increase in the EDR is partially explained by the higher power of the test for the ERR that can be estimated with higher precision. However, it is also possible that the ERR increases more because there is an increase in the heterogeneity of studies. That is, the number of studies with low power has remained constant, but the number of studies with high power has increased. This would result in a bigger increase in the ERR than the EDR.
Figure 4
Visual inspection of Figure 4 depicts the EFR higher than the FDR over time, suggesting that replication failures of studies in Evolution & Human Behavior are more likely to be false negatives rather than false positives. Up to 30% of the published results might not be replicable, and up to 50% of those results may be false positives.
It is noteworthy that the gap between the EFR and the FDR appears to be narrowing over time. This trend is supported by the significant increase in the Estimated Replicability Rate (ERR), where EFR is defined as 1 – ERR. Meanwhile, the Expected Discovery Rate (EDR) has remained constant, indicating that the FDR has also remained unchanged, given that the FDR is derived from a transformation of the EDR. The findings suggest that while original results have become more likely to replicate, the probability that replication failures are false positives remains unchanged.
Adjusting Alpha
A simple solution to a crisis of confidence in published results is to adjust the criterion to reject the null-hypothesis. For example, some researchers have proposed to set alpha to .005 to avoid too many false positive results. With z-curve we can calibrate alpha to keep the false discovery risk at an acceptable level without discarding too many true positive results. To do so, we set alpha to .05, .01, .005, and .001 and examined the false discovery risk.
Figure 5
Figure 5 shows that the conventional criterion of p < .05 produces false discovery risks above 5%. The high variability in annual estimates also makes it difficult to provide precise estimates of the FDR. However, adjusting alpha to .01 is sufficient to produce an FDR with tight confidence intervals below 5%. The benefits of reducing alpha further to .005 or .001 are minimal.
Figure 6
Figure 6 shows the impact of lowering the significance criterion, alpha, on the discovery rate (lower alpha implies fewer significant results). In Evolution & Human Behavior lowering alpha to .01 reduces the observed discovery rate by about 20 percentage points. This implies that 20% of results reported p-values between .05 and .01. These results often have low success rates in actual replication studies (OSC, 2015). Thus, our recommendation is to set alpha to .01 to reduce the false positive risk to 5% and to disregard studies with weak evidence against the null-hypothesis. These studies require actual successful replications with larger samples to provide credible evidence for an evolutionary hypothesis.
There are relatively few studies with p-values between .01 and .005. Thus, more conservative researchers can use alpha = .005 without losing too many additional results.
Limitations
The main limitation of these results is the use of automatically extracted test statistics. This approach cannot distinguish between theoretically important statistical results and other results that are often reported but do not test focal hypotheses (e.g., testing the statistical significance of a manipulation check, reporting a non-significant result for a factor in a complex statistical design that was not expected to produce a significant result).
To examine the influence of automatic extraction on our results, we can compare the results to hand-coding results of over 4,000 hand-coded focal hypotheses in over 40 journals in 2010 and 2020. The ODR was 90% around 2010 and 88% around 2020. Thus, the tendency to report significant results for focal hypothesis tests is even higher than the ODR for all results and there is no indication that this bias has decreased notably over time. The ERR increased a bit from 61% to 67%, but these values are a bit lower than those reported here. Thus, it is possible that focal tests also have lower average power than other tests, but this difference seems to be small. The main finding is that publishing of non-significant results for focal tests remains an exception in psychology journals and probably also in this journal.
One concern about the publication of our results is that it merely creates a new criterion to game publications. Rather than trying to get p-values below .05, researchers may use tricks to get p-values below .01. However, this argument ignores that it becomes increasingly harder to produce lower p-values with tricks (Simmons et al., 2011). Moreover, z-curve analysis makes it easy to see selection bias for different levels of significance. Thus, a more plausible response to these results is that researchers will increase sample sizes or use other methods to reduce sampling error to increase power.
Conclusion
The replicability report for Evolution & Human Behavior suggests that the power to obtain a significant result to report a significant result (i.e., a discovery) ranges from 28% to 71%. This finding suggests that many studies are underpowered and require luck to get a significant result. The false positive risk is modest and can be controlled by setting alpha to .01. Replication attempts of original findings with p-values above .01 should increase sample sizes to produce more conclusive evidence. The journal shows clear evidence of selection bias.
There are several ways, the current or future editors of this journal can improve credibility of results published in this journal. First, results with weak evidence (p-values between .05 and .01) should only be reported as suggestive results that require replication or even request a replication before publication. Second, editors should try to reduce publication bias by prioritizing research questions over results. A well-conducted study with an important question should be published even if the results are not statistically significant. Pre-registration and registered reports can help to reduce publication bias. Editors may also ask for follow-up studies with higher power to follow up on a non-significant result.
Publication bias also implies that point estimates of effect sizes are inflated. It is therefore important to take uncertainty in this estimates into account. Small samples with large sampling error are usually unable to provide meaningful information about effect sizes and conclusions should be limited to the direct of an effect.
The present results serve as a benchmark for future years to track progress in this journal to ensure trust in research by evolutionary psychologists.
The z-curve analysis of results in this journal shows (a) that many published results are based on studies with low to modest power, (b) selection for significance inflates effect size estimates and the discovery rate of reported results, and (c) there is no evidence that research practices have changed over the past decade. Readers should be careful when they interpret results and recognize that reported effect sizes are likely to overestimate real effect sizes, and that replication studies with the same sample size may fail to produce a significant result again. To avoid misleading inferences, I suggest using alpha = .005 as a criterion for valid rejections of the null-hypothesis. Using this criterion, the risk of a false positive result is below 2%. I also recommend computing a 99% confidence interval rather than the traditional 95% confidence interval for the interpretation of effect size estimates.
Given the low power of many studies, readers also need to avoid the fallacy to report non-significant results as evidence for the absence of an effect. With 50% power, the results can easily switch in a replication study so that a significant result becomes non-significant and a non-significant result becomes significant. However, selection for significance will make it more likely that significant results become non-significant than observing a change in the opposite direction.
The average power of studies in a heterogeneous journal like Frontiers of Psychology provides only circumstantial evidence for the evaluation of results. When other information is available (e.g., z-curve analysis of a discipline, author, or topic, it may be more appropriate to use this information).
Report
Frontiers of Psychology was created in 2010 as a new online-only journal for psychology. It covers many different areas of psychology, although some areas have specialized Frontiers journals like Frontiers in Behavioral Neuroscience.
The business model of Frontiers journals relies on publishing fees of authors, while published articles are freely available to readers.
The number of articles in Frontiers of Psychology has increased quickly from 131 articles in 2010 to 8,072 articles in 2022 (source Web of Science). With over 8,000 published articles Frontiers of Psychology is an important outlet for psychological researchers to publish their work. Many specialized, print-journals publish fewer than 100 articles a year. Thus, Frontiers of Psychology offers a broad and large sample of psychological research that is equivalent to a composite of 80 or more specialized journals.
Another advantage of Frontiers of Psychology is that it has a relatively low rejection rate compared to specialized journals that have limited journal space. While high rejection rates may allow journals to prioritize exceptionally good research, articles published in Frontiers of Psychology are more likely to reflect the common research practices of psychologists.
To examine the replicability of research published in Frontiers of Psychology, I downloaded all published articles as PDF files, converted PDF files to text files, and extracted test-statistics (F, t, and z-tests) from published articles. Although this method does not capture all published results, there is no a priori reason that results reported in this format differ from other results. More importantly, changes in research practices such as higher power due to larger samples would be reflected in all statistical tests.
As Frontiers of Psychology only started shortly before the replication crisis in psychology increased awareness about the problem of low statistical power and selection for significance (publication bias), I was not able to examine replicability before 2011. I also found little evidence of changes in the years from 2010 to 2015. Therefore, I use this time period as the starting point and benchmark for future years.
Figure 1 shows a z-curve plot of results published from 2010 to 2014. All test-statistics are converted into z-scores. Z-scores greater than 1.96 (the solid red line) are statistically significant at alpha = .05 (two-sided) and typically used to claim a discovery (rejection of the null-hypothesis). Sometimes even z-scores between 1.65 (the dotted red line) and 1.96 are used to reject the null-hypothesis either as a one-sided test or as marginal significance. Using alpha = .05, the plot shows 71% significant results, which is called the observed discovery rate (ODR).
Visual inspection of the plot shows a peak of the distribution right at the significance criterion. It also shows that z-scores drop sharply on the left side of the peak when the results do not reach the criterion for significance. This wonky distribution cannot be explained with sampling error. Rather it shows a selective bias to publish significant results by means of questionable practices such as not reporting failed replication studies or inflating effect sizes by means of statistical tricks. To quantify the amount of selection bias, z-curve fits a model to the distribution of significant results and estimates the distribution of non-significant (i.e., the grey curve in the range of non-significant results). The discrepancy between the observed distribution and the expected distribution shows the file-drawer of missing non-significant results. Z-curve estimates that the reported significant results are only 31% of the estimated distribution. This is called the expected discovery rate (EDR). Thus, there are more than twice as many significant results as the statistical power of studies justifies (71% vs. 31%). Confidence intervals around these estimates show that the discrepancy is not just due to chance, but active selection for significance.
Using a formula developed by Soric (1989), it is possible to estimate the false discovery risk (FDR). That is, the probability that a significant result was obtained without a real effect (a type-I error). The estimated FDR is 12%. This may not be alarming, but the risk varies as a function of the strength of evidence (the magnitude of the z-score). Z-scores that correspond to p-values close to p =.05 have a higher false positive risk and large z-scores have a smaller false positive risk. Moreover, even true results are unlikely to replicate when significance was obtained with inflated effect sizes. The most optimistic estimate of replicability is the expected replication rate (ERR) of 69%. This estimate, however, assumes that a study can be replicated exactly, including the same sample size. Actual replication rates are often lower than the ERR and tend to fall between the EDR and ERR. Thus, the predicted replication rate is around 50%. This is slightly higher than the replication rate in the Open Science Collaboration replication of 100 studies which was 37%.
Figure 2 examines how things have changed in the next five years.
The observed discovery rate decreased slightly, but statistically significantly, from 71% to 66%. This shows that researchers reported more non-significant results. The expected discovery rate increased from 31% to 40%, but the overlapping confidence intervals imply that this is not a statistically significant increase at the alpha = .01 level. (if two 95%CI do not overlap, the difference is significant at around alpha = .01). Although smaller, the difference between the ODR of 60% and the EDR of 40% is statistically significant and shows that selection for significance continues. The ERR estimate did not change, indicating that significant results are not obtained with more power. Overall, these results show only modest improvements, suggesting that most researchers who publish in Frontiers in Psychology continue to conduct research in the same way as they did before, despite ample discussions about the need for methodological reforms such as a priori power analysis and reporting of non-significant results.
The results for 2020 show that the increase in the EDR was a statistical fluke rather than a trend. The EDR returned to the level of 2010-2015 (29% vs. 31), but the ODR remained lower than in the beginning, showing slightly more reporting of non-significant results. The size of the file drawer remains large with an ODR of 66% and an EDR of 72%.
The EDR results for 2021 look again better, but the difference to 2020 is not statistically significant. Moreover, the results in 2022 show a lower EDR that matches the EDR in the beginning.
Overall, these results show that results published in Frontiers in Psychology are selected for significance. While the observed discovery rate is in the upper 60%s, the expected discovery rate is around 35%. Thus, the ODR is nearly twice the rate of the power of studies to produce these results. Most concerning is that a decade of meta-psychological discussions about research practices has not produced any notable changes in the amount of selection bias or the power of studies to produce replicable results.
How should readers of Frontiers in Psychology articles deal with this evidence that some published results were obtained with low power and inflated effect sizes that will not replicate? One solution is to retrospectively change the significance criterion. Comparisons of the evidence in original studies and replication outcomes suggest that studies with a p-value below .005 tend to replicate at a rate of 80%, whereas studies with just significant p-values (.050 to .005) replicate at a much lower rate (Schimmack, 2022). Demanding stronger evidence also reduces the false positive risk. This is illustrated in the last figure that uses results from all years, given the lack of any time trend.
In the Figure the red solid line moved to z = 2.8; the value that corresponds to p = .005, two-sided. Using this more stringent criterion for significance, only 45% of the z-scores are significant. Another 25% were significant with alpha = .05, but are no longer significant with alpha = .005. As power decreases when alpha is set to more stringent, lower, levels, the EDR is also reduced to only 21%. Thus, there is still selection for significance. However, the more effective significance filter also selects for more studies with high power and the ERR remains at 72%, even with alpha = .005 for the replication study. If the replication study used the traditional alpha level of .05, the ERR would be even higher, which explains the finding that the actual replication rate for studies with p < .005 is about 80%.
The lower alpha also reduces the risk of false positive results, even though the EDR is reduced. The FDR is only 2%. Thus, the null-hypothesis is unlikely to be true. The caveat is that the standard null-hypothesis in psychology is the nil-hypothesis and that the population effect size might be too small to be of practical significance. Thus, readers who interpret results with p-values below .005 should also evaluate the confidence interval around the reported effect size, using the more conservative 99% confidence interval that correspondence to alpha = .005 rather than the traditional 95% confidence interval. In many cases, this confidence interval is likely to be wide and provide insufficient information about the strength of an effect.
Gordon et al. (2021) conducted a meta-analysis of 103 studies that were included in prediction markets to forecast the outcome of replication studies. The results show that prediction markets can forecast replication outcomes above chance levels, but the value of this information is limited. Without actual replication studies, it remains unclear which published results can be trusted or not. Here I compare the performance of prediction markets to the R-Index and the closely related p < .005 rule. These statistical forecasts perform nearly as well as markets and are much easier to use to make sense of thousands of published articles. However, even these methods have a high failure rate. The best solution to this problem is to rely on meta-analyses of studies rather than to predict the outcome of a single study. In addition to meta-analyses, it will be necessary to conduct new studies that are conducted with high scientific integrity to provide solid empirical foundations for psychology. Claims that are not supported by bias-corrected meta-analyses or new preregistered studies are merely suggestive and currently lack empirical support.
Introduction
Since 2011, it became apparent that many published results in psychology, especially social psychology fail to replicate in direct replication studies (Open Science Collaboration, 2015). In social psychology the success rate of replication studies is so low (25%) that it makes sense to bet on replication failures. This would produce 75% successful outcomes, but it would also imply that an entire literature has to be discarded.
It is practically impossible to redo all of the published studies to assess their replicability. Thus, several projects have attempted to predict replication outcomes of individual studies. One strategy is to conduct prediction markets in which participants can earn real money by betting on replication outcomes. There have been four prediction markets with a total of 103 studies with known replication outcomes (Gordon et al., 2021). The key findings are summarized in Table 1.
Markets have a good overall success rate, (28+47)/103 = 73% that is above chance (flipping a coin). Prediction markets are better at predicting failures, 28/31 = 90%, than predicting successes, 47/72 = 65%. The modest success rate for success is a problem because it would be more valuable to be able to identify studies that will replicate and do not require a new study to verify the results.
Another strategy to predict replication outcomes relies on the fact that the p-values of original studies and the p-values of replication studies are influenced by the statistical power of a study (Brunner & Schimmack, 2020). Studies with higher power are more likely to produce lower p-values and more likely to produce significant p-values in replication studies. As a result, p-values also contain valuable information about replication outcomes. Gordon et al. (2021) used p < .005 as a rule to predict replication outcomes. Table 2 shows the performance of this simple rule.
The overall success rate of this rule is nearly as good as the prediction markets, (39+35)/103 = 72%; a difference by k = 1 studies. The rule does not predict failures as well as the markets, 39/54 = 72% (vs. 90%), but it predicts successes slightly better than the markets, 35/49 = 71% (vs. 65%).
A logistic regression analysis showed that both predictors independently contribute to the prediction of replication outcomes, market b = 2.50, se = .68, p = .0002; p < .005 rule: b = 1.44, se = .48, p = .003.
In short, p-values provide valuable information about the outcome of replication studies.
The R-Index
Although a correlation between p-values and replication outcomes follows logically from the influence of power on p-values in original and replication studies, the cut-off value of .005 appears to be arbitrary. Gordon et al. (2017) justify its choice with an article by Benjamin et al. (2017) that recommended a lower significance level (alpha) to ensure a lower false positive risk. Moreover, they advocated for this rule for new studies that preregister hypotheses and do not suffer from selection bias. In contrast, the replication crisis was caused by selection for significance which produced success rates of 90% or more in psychology journals (Motyl et al., 2017; Sterling, 1959; Sterling et al., 1995). One main reason for replication failures is that selection for significance inflates effect sizes and due to regression to the mean, effect sizes in replication studies are bound to be weaker, resulting in non-significant results, especially if the original p-value was close to the threshold value of alpha = .05. The Open Science Collaboration (2015) replicability project showed that effect sizes are on average inflated by over 100%.
The R-Index provides a theoretical rational for the choice of a cut-off value for p-values. The theoretical cutoff value happens to be p = .0084. The fact that it is close to Benjamin et al.’s (2017) value of .005 is merely a coincidence.
P-values can be transformed into estimates of the statistical power of a study. These estimates rely on the observed effect size of a study and are sometimes called observed power or post-hoc power because power is computed after the results of a study are known. Figure 1 illustrates observed power with an example of a z-test that produced a z-statistic of 2.8 which corresponds to a two-sided p-value of .005.
A p-value of .005 corresponds to z-value of 2.8 for the standard normal distribution centered over zero (the nil-hypothesis). The standard level of statistical significance, alpha = .05 (two-sided) corresponds to z-value of 1.96. Figure 1 shows the sampling distribution of studies with a non-central z-score of 2.8. The green line cuts this distribution into a smaller area of 20% below the significance level and a larger area of 80% above the significance level. Thus, the observed power is 80%.
Selection for significance implies truncating the normal distribution at the level of significance. This means the 20% of non-significant results are discarded. As a result, the median of the truncated distribution is higher than the median of the full normal distribution. The new median can be found using the truncnorm package in R.
qtruncnorm(.5,a = qnorm(1-.05/2),mean=2.8) = 3.05
This value corresponds to an observed power of
qnorm(3.05,qnorm(1-.05/2) = .86
Thus, selection for significance inflates observed power of 80% to 86%. The amount of inflation is larger when power is lower. With 20% power, the inflated power after selection for significance is 67%.
Figure 3 shows the relationship between inflated power on the x-axis and adjusted power on the y-axis. The blue curve uses the truncnorm package. The green line shows the simplified R-Index that simply substracts the amount of inflation from the inflated power. For example, if inflated power is 86%, the inflation is 1-.86 = 14% and subtracting the inflation gives an R-Index of 86-14 = 82%. This is close to the actual value of 80% that produced the inflated value of 86%.
Figure 4 shows that the R-Index is conservative (underestimates power) when power is over 50%, but is liberal (overestimates power) when power is below 50%. The two methods are identical when power is 50% and inflated power is 75%. This is a fortunate co-incidence because studies with more than 50% power are expected to replicate and studies with less than 50% power are expected to fail in a replication attempt. Thus, the simple R-Index makes the same dichotomous predictions about replication outcomes as the more sophisticated approach to find the median of the truncated normal distribution.
The inflated power for actual power of 50% is 75% and 75% power corresponds to a z-score of 2.63, which in turn corresponds to a p-value of p = .0084.
Performance of the R-Index is slightly worse than the p < .005 rule because the R-Index predicts 5 more successes, but 4 of these predictions are failures. Given the small sample size, it is not clear whether this difference is reliable.
In sum, the R-Index is based on a transformation of p-values into estimates of statistical power, while taking into account that observed power is inflated when studies are selected for significance. It provides a theoretical rational for the atheoretical p < .005 rule, because this rule roughly cuts p-values into p-values with more or less than 50% power.
Predicting Success Rates
The overall success rate across the 103 replication studies was 50/103 = 49%. This percentage cannot be generalized to a specific population of studies because the 103 are not a representative sample of studies. Only the Open Science Collaboration project used somewhat representative sampling. However, the 49% success rate can be compared to the success rates of different prediction methods. For example, prediction markets predict a success rate of 72/103 = 70%, a significant difference (Gordon et al., 2021). In contrast, the R-Index predicts a success rate of 54/103 = 52%, which is closer to the actual success rate. The p < .005 rule does even better with a predicted success rate of 49/103 = 48%.
Another method that has been developed to estimate the expected replication rate is z-curve (Bartos & Schimmack, 2021; Brunner & Schimmack, 2020). Z-curve transforms p-values into z-scores and then fits a finite mixture model to the distribution of significant p-values. Figure 5 illustrates z-curve with the p-values from the 103 replicated studies.
The z-curve estimate of the expected replication rate is 60%. This is better than the prediction market, but worse than the R-Index or the p < .005 rule. However, the 95%CI around the ERR includes the true value of 49%. Thus, sampling error alone might explain this discrepancy. However, Bartos and Schimmack (2021) discussed several other reasons why the ERR may overestimate the success rate of actual replication studies. One reason is that actual replication studies are not perfect replicas of the original studies. So called, hidden moderators may create differences between original and replication studies. In this case, selection for significance produces even more inflation that the model assumes. In the worst case scenario, a better estimate of actual replication outcomes might be the expected discovery rate (EDR), which is the power of all studies that were conducted, including non-significant studies. The EDR for the 103 studies is 28%, but the 95%CI is wide and includes the actual rate of 49%. Thus, the dataset is too small to decide between the ERR or the EDR as best estimates of actual replication outcomes. At present it is best to consider the EDR the worst possible and the ERR the best possible scenario and to expect the actual replication rate to fall within this interval.
Social Psychology
The 103 studies cover studies from experimental economics, cognitive psychology, and social psychology. Social psychology has the largest set of studies (k = 54) and the lowest success rate, 33%. The prediction markets overpredict successes, 50%. The R-Index also overpredicted successes, 46%. The p < .005 rule had the least amount of bias, 41%.
Z-curve predicted an ERR of 55% s and the actual success rate fell outside the 95% confidence interval, 34% to 74%. The EDR of 22% underestimates the success rate, but the 95%CI is wide and includes the true value, 95%CI = 5% to 70%. Once more the actual success rate is between the EDR and the ERR estimates, 22% < 34% < 55%.
In short, prediction models appear to overpredict replication outcomes in social psychology. One reason for this might be that hidden moderators make it difficult to replicate studies in social psychology which adds additional uncertainty to the outcome of replication studies.
Regarding predictions of individual studies, prediction markets achieved an overall success rate of 76%. Prediction markets were good at predicting failures, 25/27 = 93%, but not so good in predicting successes, 16/27 = 59%.
The R-Index performed as well as the prediction markets with one more prediction of a replication failure.
The p < .005 rule was the best predictor because it predicted more replication failures.
Performance could be increased by combining prediction markets and the R-Index and only bet on successes when both predictors predicted a success. In particular, the prediction of success improved to 14/19 = 74%. However, due to the small sample size it is not clear whether this is a reliable finding.
Non-Social Studies
The remaining k = 56 studies had a higher success rate, 65%. The prediction markets overpredicted success, 92%. The R-Index underpredicted successes, 59%. The p < .005 rule underpredicted successes even more.
This time z-curve made the best prediction with an ERR of 67%, 95%CI = 45% to 86%. The EDR underestimates the replication rate, although the 95%CI is very wide and includes the actual success rate, 5% to 81%. The fact that z-curve overestimated replicability for social psychology, but not for other areas, suggests that hidden moderators may contribute to the replication problems in social psychology.
For predictions of individual outcomes, prediction markets had a success rate of (3 + 31)/49 = 76%. The good performance is due to the high success rate. Simply betting on success would have produced 32/49 = 65% successes. Predictions of failures had a s success rate of 3/4 = 75% and predictions of successes had a success rate of 31/45 = 69%.
The R-Index had a lower success rate of (9 +21)/49 = 61%. The R-Index was particularly poor at predicting failures, 9/20 = 45%, but was slightly better at predicting successes than the prediction markets, 21/29 = 72%.
The p < .500 rule had a success rate equal to the R-Index, (10 + 20)/49 = 61%, with one more correctly predicted failure and one less correctly predicted success.
Discussion
The present results reproduce the key findings of Gordon et al. (2021). First, prediction markets overestimate the success of actual replication studies. Second, prediction markets have some predictive validity in forecasting the outcome of individual replication studies. Third, a simple rule based on p-values also can forecast replication outcomes.
The present results also extend Gordon et al.’s (2021) findings based on additional analyses. First, I compared the performance of prediction markets to z-curve as a method for the prediction of the success rates of replication outcomes (Bartos & Schimmack, 2021; Brunner & Schimmack, 2021). Z-curve overpredicted success rates for all studies and for social psychology, but was very accurate for the remaining studies (economics, cognition). In all three comparisons, z-curve performed better than prediction markets. Z-curve also has several additional advantages over prediction markets. First, it is much easier to code a large set of test statistics than to run prediction markets. As a result, z-curve has already been used to estimate the replication rates for social psychology based on thousands of test statistics, whereas estimates of prediction markets are based on just over 50 studies. Second, z-curve is based on sound statistical principles that link the outcomes of original studies to the outcomes of replication studies (Brunner & Schimmack, 2020). In contrast, prediction markets rest on unknown knowledge of market participants that can vary across markets. Third, z-curve estimates are provided with validated information about the uncertainty in the estimates, whereas prediction markets provide no information about uncertainty and uncertainty is large because markets tend to be small. In conclusion, z-curve is more efficient and provides better estimates of replication rates than prediction markets.
The main goal of prediction markets is to assess the credibility of individual studies. Ideally, prediction markets would help consumers of published research to distinguish between studies that produced real findings (true positives) and studies that produced false findings (false positives) without the need to run additional studies. The encouraging finding is that prediction markets have some predictive validity and can distinguish between studies that replicate and studies that do not replicate. However, to be practically useful it is necessary to assess the practical usefulness of the information that is provided by prediction markets. Here we need to distinguish the practical consequences of replication failures and successes. Within the statistical framework of nil-hypothesis significance testing, successes and failures have different consequences.
A replication failure increases uncertainty about the original finding. Thus, more research is needed to understand why the results diverged. This is also true for market predictions. Predictions that a study would fail to replicate cast doubt about the original study, but do not provide conclusive evidence that the original study reported a false positive result. Thus, further studies are needed, even if a market predicts a failure. In contrast, successes are more informative. Replicating a previous finding successfully strengthens the original findings and provides fairly strong evidence that a finding was not a false positive result. Unfortunately, the mere prediction that a finding will replicate does not provide the same reassurance because markets only have an accuracy of about 70% when they predict a successful replication. The p < .500 rule is much easier to implement, but its ability to forecast successes is also around 70%. Thus, neither markets nor a simple statistical rule are accurate enough to avoid actual replication studies.
Meta-Analysis
The main problem of prediction markets and other forecasting projects is that single studies are rarely enough to provide evidence that is strong enough to evaluate theoretical claims. It is therefore not particularly important whether one study can be replicated successfully or not, especially when direct replications are difficult or impossible. For this reason, psychologists have relied for a long time on meta-analyses of similar studies to evaluate theoretical claims.
It is surprising that prediction markets have forecasted the outcome of studies that have been replicated many times before the outcome of a new replication study was predicted. Take the replication of Schwarz, Strack, and Mai (1991) in Many Labs 2 as an example. This study manipulated the item-order of questions about marital satisfaction and life-satisfaction and suggested that a question about marital satisfaction can prime information that is used in life-satisfaction judgments. Schimmack and Oishi (2005) conducted a meta-analysis of the literature and showed that the results by Schwarz et al. (1991) were unusual and that the actual effect size is much smaller. Apparently, the market participants were unaware of this meta-analysis and predicted that the original result would replicate successfully (probability of success = 72%). Contrary to the market, the study failed to replicate. This example suggests that meta-analyses might be more valuable than prediction markets or the p-value of a single study.
The main obstacle for the use of meta-analyses is that many published meta-analyses fail to take selection for significance into account and overestimate replicability. However, new statistical methods that correct for selection bias may address this problem. The R-Index is a rather simple tool that allows to correct for selection bias in small sets of studies. I use the article by Nairne et al. (2008) that was used for the OSC project as an example. The replication project focused on Study 2 that produced a p-value of .026. Based on this weak evidence alone, the R-Index would predict a replication failure (observed power = .61, inflation = .39, R-Index = .61 – .39 = .22). However, Study 1 produced much more convincing evidence for the effect, p = .0007. If this study had been picked for the replication attempt, the R-Index would have predicted a successful outcome (observed power = .92, inflation = .08, R-Index = .84). A meta-analysis would average across the two power estimates and also predict a successful replication outcome (mean observed power = .77, inflation = .23, R-Index = .53). The actual replication study was significant with p = .007 (observed power = .77, inflation = .23, R-Index = .53). A meta-analysis across all three studies also suggests that the next study will be a successful replication (R-Index = .53), but the R-Index also shows that replication failures are likely because the studies have relatively low power. In short, prediction markets may be useful when only a single study is available, but meta-analysis are likely to be superior predictors of replication outcomes when prior replication studies are available.
Conclusion
Gordon et al. (2021) conducted a meta-analysis of 103 studies that were included in prediction markets to forecast the outcome of replication studies. The results show that prediction markets can forecast replication outcomes above chance levels, but the value of this information is limited. Without actual replication studies, it remains unclear which published results can be trusted or not. Statistical methods that simply focus on the strength of evidence in original studies perform nearly as well and are much easier to use to make sense of thousands of published articles. However, even these methods have a high failure rate. The best solution to this problem is to rely on meta-analyses of studies rather than to predict the outcome of a single study. In addition to meta-analyses, it will be necessary to conduct new studies that are conducted with high scientific integrity to provide solid empirical foundations for psychology.
Welcome to the replicability rankings for 120 psychology journals. More information about the statistical method that is used to create the replicability rankings can be found elsewhere (Z-Curve; Video Tutorial; Talk; Examples). The rankings are based on automated extraction of test statistics from all articles published in these 120 journals from 2010 to 2020 (data). The results can be reproduced with the R-package zcurve.
To give a brief explanation of the method, I use the journal with the highest ranking and the journal with the lowest ranking as examples. Figure 1 shows the z-curve plot for the 2nd highest ranking journal for the year 2020 (the Journal of Organizational Psychology is ranked #1, but it has very few test statistics). Plots for all journals that include additional information and information about test statistics are available by clicking on the journal name. Plots for previous years can be found on the site for the 2010-2019 rankings (previous rankings).
To create the z-curve plot in Figure 1, the 361 test statistics were first transformed into exact p-values that were then transformed into absolute z-scores. Thus, each value represents the deviation from zero for a standard normal distribution. A value of 1.96 (solid red line) corresponds to the standard criterion for significance, p = .05 (two-tailed). The dashed line represents the treshold for marginal significance, p = .10 (two-tailed). A z-curve analysis fits a finite mixture model to the distribution of the significant z-scores (the blue density distribution on the right side of the solid red line). The distribution provides information about the average power of studies that produced a significant result. As power determines the success rate in future studies, power after selection for significance is used to estimate replicability. For the present data, the z-curve estimate of the replication rate is 84%. The bootstrapped 95% confidence interval around this estimate ranges from 75% to 92%. Thus, we would expect the majority of these significant results to replicate.
However, the graph also shows some evidence that questionable research practices produce too many significant results. The observed discovery rate (i.e., the percentage of p-values below .05) is 82%. This is outside of the 95%CI of the estimated discovery rate which is represented by the grey line in the range of non-significant results; EDR = .31%, 95%CI = 18% to 81%. We see that there are fewer results reported than z-curve predicts. This finding casts doubt about the replicability of the just significant p-values. The replicability rankings ignore this problem, which means that the predicted success rates are overly optimistic. A more pessimistic predictor of the actual success rate is the EDR. However, the ERR still provides useful information to compare power of studies across journals and over time.
Figure 2 shows a journal with a low ERR in 2020.
The estimated replication rate is 64%, with a 95%CI ranging from 55% to 73%. The 95%CI does not overlap with the 95%CI for the Journal of Sex Research, indicating that this is a significant difference in replicability. Visual inspection also shows clear evidence for the use of questionable research practices with a lot more results that are just significant than results that are not significant. The observed discovery rate of 75% is inflated and outside the 95%CI of the EDR that ranges from 10% to 56%.
To examine time trends, I regressed the ERR of each year on the year and computed the predicted values and 95%CI. Figure 3 shows the results for the journal Social Psychological and Personality Science as an example (x = 0 is 2010, x = 1 is 2020). The upper bound of the 95%CI for 2010, 62%, is lower than the lower bound of the 95%CI for 2020, 74%.
This shows a significant difference with alpha = .01. I use alpha = .01 so that only 1.2 out of the 120 journals are expected to show a significant change in either direction by chance alone. There are 22 journals with a significant increase in the ERR and no journals with a significant decrease. This shows that about 20% of these journals have responded to the crisis of confidence by publishing studies with higher power that are more likely to replicate.
Last update 8/25/2021 (expanded to 410 social/personality psychologists; included Dan Ariely)
Introduction
Since Fisher invented null-hypothesis significance testing, researchers have used p < .05 as a statistical criterion to interpret results as discoveries worthwhile of discussion (i.e., the null-hypothesis is false). Once published, these results are often treated as real findings even though alpha does not control the risk of false discoveries.
Statisticians have warned against the exclusive reliance on p < .05, but nearly 100 years after Fisher popularized this approach, it is still the most common way to interpret data. The main reason is that many attempts to improve on this practice have failed. The main problem is that a single statistical result is difficult to interpret. However, when individual results are interpreted in the context of other results, they become more informative. Based on the distribution of p-values it is possible to estimate the maximum false discovery rate (Bartos & Schimmack, 2020; Jager & Leek, 2014). This approach can be applied to the p-values published by individual authors to adjust p-values to keep the risk of false discoveries at a reasonable level, FDR < .05.
Researchers who mainly test true hypotheses with high power have a high discovery rate (many p-values below .05) and a low false discovery rate (FDR < .05). Figure 1 shows an example of a researcher who followed this strategy (for a detailed description of z-curve plots, see Schimmack, 2021).
We see that out of the 317 test-statistics retrieved from his articles, 246 were significant with alpha = .05. This is an observed discovery rate of 78%. We also see that this discovery rate closely matches the estimated discovery rate based on the distribution of the significant p-values, p < .05. The EDR is 79%. With an EDR of 79%, the maximum false discovery rate is only 1%. However, the 95%CI is wide and the lower bound of the CI for the EDR, 27%, allows for 14% false discoveries.
When the ODR matches the EDR, there is no evidence of publication bias. In this case, we can improve the estimates by fitting all p-values, including the non-significant ones. With a tighter CI for the EDR, we see that the 95%CI for the maximum FDR ranges from 1% to 3%. Thus, we can be confident that no more than 5% of the significant results wit alpha = .05 are false discoveries. Readers can therefore continue to use alpha = .05 to look for interesting discoveries in Matsumoto’s articles.
Figure 3 shows the results for a different type of researcher who took a risk and studied weak effect sizes with small samples. This produces many non-significant results that are often not published. The selection for significance inflates the observed discovery rate, but the z-curve plot and the comparison with the EDR shows the influence of publication bias. Here the ODR is similar to Figure 1, but the EDR is only 11%. An EDR of 11% translates into a large maximum false discovery rate of 41%. In addition, the 95%CI of the EDR includes 5%, which means the risk of false positives could be as high as 100%. In this case, using alpha = .05 to interpret results as discoveries is very risky. Clearly, p < .05 means something very different when reading an article by David Matsumoto or Shelly Chaiken.
Rather than dismissing all of Chaiken’s results, we can try to lower alpha to reduce the false discovery rate. If we set alpha = .01, the FDR is 15%. If we set alpha = .005, the FDR is 8%. To get the FDR below 5%, we need to set alpha to .001.
A uniform criterion of FDR < 5% is applied to all researchers in the rankings below. For some this means no adjustment to the traditional criterion. For others, alpha is lowered to .01, and for a few even lower than that.
The rankings below are based on automatrically extracted test-statistics from 40 journals (List of journals). The results should be interpreted with caution and treated as preliminary. They depend on the specific set of journals that were searched, the way results are being reported, and many other factors. The data are available (data.drop) and researchers can exclude articles or add articles and run their own analyses using the z-curve package in R (https://replicationindex.com/2020/01/10/z-curve-2-0/).
I am also happy to receive feedback about coding errors. I also recommended to hand-code articles to adjust alpha for focal hypothesis tests. This typically lowers the EDR and increases the FDR. For example, the automated method produced an EDR of 31 for Bargh, whereas hand-coding of focal tests produced an EDR of 12 (Bargh-Audit).
And here are the rankings. The results are fully automated and I was not able to cover up the fact that I placed only #188 out of 400 in the rankings. In another post, I will explain how researchers can move up in the rankings. Of course, one way to move up in the rankings is to increase statistical power in future studies. The rankings will be updated again when the 2021 data are available.
Despite the preliminary nature, I am confident that the results provide valuable information. Until know all p-values below .05 have been treated as if they are equally informative. The rankings here show that this is not the case. While p = .02 can be informative for one researcher, p = .002 may still entail a high false discovery risk for another researcher.
Good science requires not only open and objective reporting of new data; it also requires unbiased review of the literature. However, there are no rules and regulations regarding citations, and many authors cherry-pick citations that are consistent with their claims. Even when studies have failed to replicate, original studies are cited without citing the replication failures. In some cases, authors even cite original articles that have been retracted. Fortunately, it is easy to spot these acts of unscientific behavior. Here I am starting a project to list examples of bad scientific behaviors. Hopefully, more scientists will take the time to hold their colleagues accountable for ethical behavior in citations. They can even do so by posting anonymously on the PubPeer comment site.
Rank
Name
Tests
ODR
EDR
ERR
FDR
Alpha
1
Robert A. Emmons
53
87
89
90
1
.05
2
Allison L. Skinner
229
59
81
85
1
.05
3
David Matsumoto
378
83
79
85
1
.05
4
Linda J. Skitka
532
68
75
82
2
.05
5
Todd K. Shackelford
305
77
75
82
2
.05
6
Jonathan B. Freeman
274
59
75
81
2
.05
7
Virgil Zeigler-Hill
515
72
74
81
2
.05
8
Arthur A. Stone
310
75
73
81
2
.05
9
David P. Schmitt
207
78
71
77
2
.05
10
Emily A. Impett
549
77
70
76
2
.05
11
Paula Bressan
62
82
70
76
2
.05
12
Kurt Gray
487
79
69
81
2
.05
13
Michael E. McCullough
334
69
69
78
2
.05
14
Kipling D. Williams
843
75
69
77
2
.05
15
John M. Zelenski
156
71
69
76
2
.05
16
Amy J. C. Cuddy
212
83
68
78
2
.05
17
Elke U. Weber
312
69
68
77
0
.05
18
Hilary B. Bergsieker
439
67
68
74
2
.05
19
Cameron Anderson
652
71
67
74
3
.05
20
Rachael E. Jack
249
70
66
80
3
.05
21
Jamil Zaki
430
78
66
76
3
.05
22
A. Janet Tomiyama
76
78
65
76
3
.05
23
Benjamin R. Karney
392
56
65
73
3
.05
24
Phoebe C. Ellsworth
605
74
65
72
3
.05
25
Jim Sidanius
487
69
65
72
3
.05
26
Amelie Mummendey
461
70
65
72
3
.05
27
Carol D. Ryff
280
84
64
76
3
.05
28
Juliane Degner
435
63
64
71
3
.05
29
Steven J. Heine
597
78
63
77
3
.05
30
David M. Amodio
584
66
63
70
3
.05
31
Thomas N Bradbury
398
61
63
69
3
.05
32
Elaine Fox
472
79
62
78
3
.05
33
Miles Hewstone
1427
70
62
73
3
.05
34
Linda R. Tropp
344
65
61
80
3
.05
35
Rainer Greifeneder
944
75
61
77
3
.05
36
Klaus Fiedler
1950
77
61
74
3
.05
37
Jesse Graham
377
70
60
76
3
.05
38
Richard W. Robins
270
76
60
70
4
.05
39
Simine Vazire
137
66
60
64
4
.05
40
On Amir
267
67
59
88
4
.05
41
Edward P. Lemay
289
87
59
81
4
.05
42
William B. Swann Jr.
1070
78
59
80
4
.05
43
Margaret S. Clark
505
75
59
77
4
.05
44
Bernhard Leidner
724
64
59
65
4
.05
45
B. Keith Payne
879
71
58
76
4
.05
46
Ximena B. Arriaga
284
66
58
69
4
.05
47
Joris Lammers
728
69
58
69
4
.05
48
Patricia G. Devine
606
71
58
67
4
.05
49
Rainer Reisenzein
201
65
57
69
4
.05
50
Barbara A. Mellers
287
80
56
78
4
.05
51
Joris Lammers
705
69
56
69
4
.05
52
Jean M. Twenge
381
72
56
59
4
.05
53
Nicholas Epley
1504
74
55
72
4
.05
54
Kaiping Peng
566
77
54
75
4
.05
55
Krishna Savani
638
71
53
69
5
.05
56
Leslie Ashburn-Nardo
109
80
52
83
5
.05
57
Lee Jussim
226
80
52
71
5
.05
58
Richard M. Ryan
998
78
52
69
5
.05
59
Ethan Kross
614
66
52
67
5
.05
60
Edward L. Deci
284
79
52
63
5
.05
61
Roger Giner-Sorolla
663
81
51
80
5
.05
62
Bertram F. Malle
422
73
51
75
5
.05
63
George A. Bonanno
479
72
51
70
5
.05
64
Jens B. Asendorpf
253
74
51
69
5
.05
65
Samuel D. Gosling
108
58
51
62
5
.05
66
Tessa V. West
691
71
51
59
5
.05
67
Paul Rozin
449
78
50
84
5
.05
68
Joachim I. Krueger
436
78
50
81
5
.05
69
Sheena S. Iyengar
207
63
50
80
5
.05
70
James J. Gross
1104
72
50
77
5
.05
71
Mark Rubin
306
68
50
75
5
.05
72
Pieter Van Dessel
578
70
50
75
5
.05
73
Shinobu Kitayama
983
76
50
71
5
.05
74
Matthew J. Hornsey
1656
74
50
71
5
.05
75
Janice R. Kelly
366
75
50
70
5
.05
76
Antonio L. Freitas
247
79
50
64
5
.05
77
Paul K. Piff
166
77
50
63
5
.05
78
Mina Cikara
392
71
49
80
5
.05
79
Beate Seibt
379
72
49
62
6
.01
80
Ludwin E. Molina
163
69
49
61
5
.05
81
Bertram Gawronski
1803
72
48
76
6
.01
82
Penelope Lockwood
458
71
48
70
6
.01
83
Edward R. Hirt
1042
81
48
65
6
.01
84
Matthew D. Lieberman
398
72
47
80
6
.01
85
John T. Cacioppo
438
76
47
69
6
.01
86
Agneta H. Fischer
952
75
47
69
6
.01
87
Leaf van Boven
711
72
47
67
6
.01
88
Stephanie A. Fryberg
248
62
47
66
6
.01
89
Daniel M. Wegner
602
76
47
65
6
.01
90
Anne E. Wilson
785
71
47
64
6
.01
91
Rainer Banse
402
78
46
72
6
.01
92
Alice H. Eagly
330
75
46
71
6
.01
93
Jeanne L. Tsai
1241
73
46
67
6
.01
94
Jennifer S. Lerner
181
80
46
61
6
.01
95
Andrea L. Meltzer
549
52
45
72
6
.01
96
R. Chris Fraley
642
70
45
72
7
.01
97
Constantine Sedikides
2566
71
45
70
6
.01
98
Paul Slovic
377
74
45
70
6
.01
99
Dacher Keltner
1233
72
45
64
6
.01
100
Brian A. Nosek
816
68
44
81
7
.01
101
George Loewenstein
752
71
44
72
7
.01
102
Ursula Hess
774
78
44
71
7
.01
103
Jason P. Mitchell
600
73
43
73
7
.01
104
Jessica L. Tracy
632
74
43
71
7
.01
105
Charles M. Judd
1054
76
43
68
7
.01
106
S. Alexander Haslam
1198
72
43
64
7
.01
107
Mark Schaller
565
73
43
61
7
.01
108
Susan T. Fiske
911
78
42
74
7
.01
109
Lisa Feldman Barrett
644
69
42
70
7
.01
110
Jolanda Jetten
1956
73
42
67
7
.01
111
Mario Mikulincer
901
89
42
64
7
.01
112
Bernadette Park
973
77
42
64
7
.01
113
Paul A. M. Van Lange
1092
70
42
63
7
.01
114
Wendi L. Gardner
798
67
42
63
7
.01
115
Will M. Gervais
110
69
42
59
7
.01
116
Jordan B. Peterson
266
60
41
79
7
.01
117
Philip E. Tetlock
549
79
41
73
7
.01
118
Amanda B. Diekman
438
83
41
70
7
.01
119
Daniel H. J. Wigboldus
492
76
41
67
8
.01
120
Michael Inzlicht
686
66
41
63
8
.01
121
Naomi Ellemers
2388
74
41
63
8
.01
122
Phillip Atiba Goff
299
68
41
62
7
.01
123
Stacey Sinclair
327
70
41
57
8
.01
124
Francesca Gino
2521
75
40
69
8
.01
125
Michael I. Norton
1136
71
40
69
8
.01
126
David J. Hauser
156
74
40
68
8
.01
127
Elizabeth Page-Gould
411
57
40
66
8
.01
128
Tiffany A. Ito
349
80
40
64
8
.01
129
Richard E. Petty
2771
69
40
64
8
.01
130
Tim Wildschut
1374
73
40
64
8
.01
131
Norbert Schwarz
1337
72
40
63
8
.01
132
Veronika Job
362
70
40
63
8
.01
133
Wendy Wood
462
75
40
62
8
.01
134
Minah H. Jung
156
83
39
83
8
.01
135
Marcel Zeelenberg
868
76
39
79
8
.01
136
Tobias Greitemeyer
1737
72
39
67
8
.01
137
Jason E. Plaks
582
70
39
67
8
.01
138
Carol S. Dweck
1028
70
39
63
8
.01
139
Christian S. Crandall
362
75
39
59
8
.01
140
Harry T. Reis
998
69
38
74
9
.01
141
Vanessa K. Bohns
420
77
38
74
8
.01
142
Jerry Suls
413
71
38
68
8
.01
143
Eric D. Knowles
384
68
38
64
8
.01
144
C. Nathan DeWall
1336
73
38
63
9
.01
145
Clayton R. Critcher
697
82
38
63
9
.01
146
John F. Dovidio
2019
69
38
62
9
.01
147
Joshua Correll
549
61
38
62
9
.01
148
Abigail A. Scholer
556
58
38
62
9
.01
149
Chris Janiszewski
107
81
38
58
9
.01
150
Herbert Bless
586
73
38
57
9
.01
151
Mahzarin R. Banaji
880
73
37
78
9
.01
152
Rolf Reber
280
64
37
72
9
.01
153
Kevin N. Ochsner
406
79
37
70
9
.01
154
Mark J. Brandt
277
70
37
70
9
.01
155
Geoff MacDonald
406
67
37
67
9
.01
156
Mara Mather
1038
78
37
67
9
.01
157
Antony S. R. Manstead
1656
72
37
62
9
.01
158
Lorne Campbell
433
67
37
61
9
.01
159
Sanford E. DeVoe
236
71
37
61
9
.01
160
Ayelet Fishbach
1416
78
37
59
9
.01
161
Fritz Strack
607
75
37
56
9
.01
162
Jeff T. Larsen
181
74
36
67
10
.01
163
Nyla R. Branscombe
1276
70
36
65
9
.01
164
Yaacov Schul
411
61
36
64
9
.01
165
D. S. Moskowitz
3418
74
36
63
9
.01
166
Pablo Brinol
1356
67
36
62
9
.01
167
Todd B. Kashdan
377
73
36
61
9
.01
168
Barbara L. Fredrickson
287
72
36
61
9
.01
169
Duane T. Wegener
980
77
36
60
9
.01
170
Joanne V. Wood
1093
74
36
60
9
.01
171
Daniel A. Effron
484
66
36
60
9
.01
172
Niall Bolger
376
67
36
58
9
.01
173
Craig A. Anderson
467
76
36
55
9
.01
174
Michael Harris Bond
378
73
35
84
10
.01
175
Glenn Adams
270
71
35
73
10
.01
176
Daniel M. Bernstein
404
73
35
70
10
.01
177
C. Miguel Brendl
121
76
35
68
10
.01
178
Azim F. Sharif
183
74
35
68
10
.01
179
Emily Balcetis
599
69
35
68
10
.01
180
Eva Walther
493
82
35
66
10
.01
181
Michael D. Robinson
1388
78
35
66
10
.01
182
Igor Grossmann
203
64
35
66
10
.01
183
Diana I. Tamir
156
62
35
62
10
.01
184
Samuel L. Gaertner
321
75
35
61
10
.01
185
John T. Jost
794
70
35
61
10
.01
186
Eric L. Uhlmann
457
67
35
61
10
.01
187
Nalini Ambady
1256
62
35
56
10
.01
188
Daphna Oyserman
446
55
35
54
10
.01
189
Victoria M. Esses
295
75
35
53
10
.01
190
Linda J. Levine
495
74
34
78
10
.01
191
Wiebke Bleidorn
99
63
34
74
10
.01
192
Thomas Gilovich
1193
80
34
69
10
.01
193
Alexander J. Rothman
133
69
34
65
10
.01
194
Francis J. Flynn
378
72
34
63
10
.01
195
Paula M. Niedenthal
522
69
34
61
10
.01
196
Ozlem Ayduk
549
62
34
59
10
.01
197
Paul Ekman
88
70
34
55
10
.01
198
Alison Ledgerwood
214
75
34
54
10
.01
199
Christopher R. Agnew
325
75
33
76
10
.01
200
Michelle N. Shiota
242
60
33
63
11
.01
201
Malte Friese
501
61
33
57
11
.01
202
Kerry Kawakami
487
68
33
56
10
.01
203
Danu Anthony Stinson
494
77
33
54
11
.01
204
Jennifer A. Richeson
831
67
33
52
11
.01
205
Margo J. Monteith
773
76
32
77
11
.01
206
Ulrich Schimmack
318
75
32
63
11
.01
207
Mark Snyder
562
72
32
63
11
.01
208
Michele J. Gelfand
365
76
32
63
11
.01
209
Russell H. Fazio
1094
69
32
61
11
.01
210
Eric van Dijk
238
67
32
60
11
.01
211
Tom Meyvis
377
77
32
60
11
.01
212
Eli J. Finkel
1392
62
32
57
11
.01
213
Robert B. Cialdini
379
72
32
56
11
.01
214
Jonathan W. Kunstman
430
66
32
53
11
.01
215
Delroy L. Paulhus
121
77
31
82
12
.01
216
Yuen J. Huo
132
74
31
80
11
.01
217
Gerd Bohner
513
71
31
70
11
.01
218
Christopher K. Hsee
689
75
31
63
11
.01
219
Vivian Zayas
251
71
31
60
12
.01
220
John A. Bargh
651
72
31
55
12
.01
221
Tom Pyszczynski
948
69
31
54
12
.01
222
Roy F. Baumeister
2442
69
31
52
12
.01
223
E. Ashby Plant
831
77
31
51
11
.01
224
Kathleen D. Vohs
944
68
31
51
12
.01
225
Jamie Arndt
1318
69
31
50
12
.01
226
Anthony G. Greenwald
357
72
30
83
12
.01
227
Nicholas O. Rule
1294
68
30
75
13
.01
228
Lauren J. Human
447
59
30
70
12
.01
229
Jennifer Crocker
515
68
30
67
12
.01
230
Dale T. Miller
521
71
30
64
12
.01
231
Thomas W. Schubert
353
70
30
60
12
.01
232
Joseph A. Vandello
494
73
30
60
12
.01
233
W. Keith Campbell
528
70
30
58
12
.01
234
Arthur Aron
307
65
30
56
12
.01
235
Pamela K. Smith
149
66
30
52
12
.01
236
Aaron C. Kay
1320
70
30
51
12
.01
237
Steven W. Gangestad
198
63
30
41
13
.005
238
Eliot R. Smith
445
79
29
73
13
.01
239
Nir Halevy
262
68
29
72
13
.01
240
E. Allan Lind
370
82
29
72
13
.01
241
Richard E. Nisbett
319
73
29
69
13
.01
242
Hazel Rose Markus
674
76
29
68
13
.01
243
Emanuele Castano
445
69
29
65
13
.01
244
Dirk Wentura
830
65
29
64
13
.01
245
Boris Egloff
274
81
29
58
13
.01
246
Monica Biernat
813
77
29
57
13
.01
247
Gordon B. Moskowitz
374
72
29
57
13
.01
248
Russell Spears
2286
73
29
55
13
.01
249
Jeff Greenberg
1358
77
29
54
13
.01
250
Caryl E. Rusbult
218
60
29
54
13
.01
251
Naomi I. Eisenberger
179
74
28
79
14
.01
252
Brent W. Roberts
562
72
28
77
14
.01
253
Yoav Bar-Anan
525
75
28
76
13
.01
254
Eddie Harmon-Jones
738
73
28
70
14
.01
255
Matthew Feinberg
295
77
28
69
14
.01
256
Roland Neumann
258
77
28
67
13
.01
257
Eugene M. Caruso
822
75
28
64
13
.01
258
Ulrich Kuehnen
822
75
28
64
13
.01
259
Elizabeth W. Dunn
395
75
28
64
14
.01
260
Jeffry A. Simpson
697
74
28
55
13
.01
261
Sander L. Koole
767
65
28
52
14
.01
262
Richard J. Davidson
380
64
28
51
14
.01
263
Shelly L. Gable
364
64
28
50
14
.01
264
Adam D. Galinsky
2154
70
28
49
13
.01
265
Grainne M. Fitzsimons
585
68
28
49
14
.01
266
Geoffrey J. Leonardelli
290
68
28
48
14
.005
267
Joshua Aronson
183
85
28
46
14
.005
268
Henk Aarts
1003
67
28
45
14
.005
269
Vanessa K. Bohns
422
76
27
74
15
.01
270
Jan De Houwer
1972
70
27
72
14
.01
271
Dan Ariely
600
70
27
69
14
.01
272
Charles Stangor
185
81
27
68
15
.01
273
Karl Christoph Klauer
801
67
27
65
14
.01
274
Mario Gollwitzer
500
58
27
62
14
.01
275
Jennifer S. Beer
80
56
27
54
14
.01
276
Eldar Shafir
107
78
27
51
14
.01
277
Guido H. E. Gendolla
422
76
27
47
14
.005
278
Klaus R. Scherer
467
83
26
78
15
.01
279
William G. Graziano
532
71
26
66
15
.01
280
Galen V. Bodenhausen
585
74
26
61
15
.01
281
Sonja Lyubomirsky
530
71
26
59
15
.01
282
Kai Sassenberg
872
71
26
56
15
.01
283
Kristin Laurin
648
63
26
51
15
.01
284
Claude M. Steele
434
73
26
42
15
.005
285
David G. Rand
392
70
25
81
15
.01
286
Paul Bloom
502
72
25
79
16
.01
287
Kerri L. Johnson
532
76
25
76
15
.01
288
Batja Mesquita
416
71
25
73
16
.01
289
Rebecca J. Schlegel
261
67
25
71
15
.01
290
Phillip R. Shaver
566
81
25
71
16
.01
291
David Dunning
818
74
25
70
16
.01
292
Laurie A. Rudman
482
72
25
68
16
.01
293
David A. Lishner
105
65
25
63
16
.01
294
Mark J. Landau
950
78
25
45
16
.005
295
Ronald S. Friedman
183
79
25
44
16
.005
296
Joel Cooper
257
72
25
39
16
.005
297
Alison L. Chasteen
223
68
24
69
16
.01
298
Jeff Galak
313
73
24
68
17
.01
299
Steven J. Sherman
888
74
24
62
16
.01
300
Shigehiro Oishi
1109
64
24
61
17
.01
301
Thomas Mussweiler
604
70
24
43
17
.005
302
Mark W. Baldwin
247
72
24
41
17
.005
303
Evan P. Apfelbaum
256
62
24
41
17
.005
304
Nurit Shnabel
564
76
23
78
18
.01
305
Klaus Rothermund
738
71
23
76
18
.01
306
Felicia Pratto
410
73
23
75
18
.01
307
Jonathan Haidt
368
76
23
73
17
.01
308
Roland Imhoff
365
74
23
73
18
.01
309
Jeffrey W Sherman
992
68
23
71
17
.01
310
Jennifer L. Eberhardt
202
71
23
62
18
.005
311
Bernard A. Nijstad
693
71
23
52
18
.005
312
Brandon J. Schmeichel
652
66
23
45
17
.005
313
Sam J. Maglio
325
72
23
42
17
.005
314
David M. Buss
461
82
22
80
19
.01
315
Yoel Inbar
280
67
22
71
19
.01
316
Serena Chen
865
72
22
67
19
.005
317
Spike W. S. Lee
145
68
22
64
19
.005
318
Marilynn B. Brewer
314
75
22
62
18
.005
319
Michael Ross
1164
70
22
62
18
.005
320
Dieter Frey
1538
68
22
58
18
.005
321
G. Daniel Lassiter
189
82
22
55
19
.01
322
Sean M. McCrea
584
73
22
54
19
.005
323
Wendy Berry Mendes
965
68
22
44
19
.005
324
Paul W. Eastwick
583
65
21
69
19
.005
325
Kees van den Bos
1150
84
21
69
20
.005
326
Maya Tamir
1342
80
21
64
19
.005
327
Joseph P. Forgas
888
83
21
59
19
.005
328
Michaela Wanke
362
74
21
59
19
.005
329
Dolores Albarracin
540
66
21
56
20
.005
330
Elizabeth Levy Paluck
31
84
21
55
20
.005
331
Vanessa LoBue
299
68
20
76
21
.01
332
Christopher J. Armitage
160
62
20
73
21
.005
333
Elizabeth A. Phelps
686
78
20
72
21
.005
334
Jay J. van Bavel
437
64
20
71
21
.005
335
David A. Pizarro
227
71
20
69
21
.005
336
Andrew J. Elliot
1018
81
20
67
21
.005
337
William A. Cunningham
238
76
20
64
22
.005
338
Laura D. Scherer
212
69
20
64
21
.01
339
Kentaro Fujita
458
69
20
62
21
.005
340
Geoffrey L. Cohen
1590
68
20
50
21
.005
341
Ana Guinote
378
76
20
47
21
.005
342
Tanya L. Chartrand
424
67
20
33
21
.001
343
Selin Kesebir
328
66
19
73
22
.005
344
Vincent Y. Yzerbyt
1412
73
19
73
22
.01
345
James K. McNulty
1047
56
19
65
23
.005
346
Robert S. Wyer
871
82
19
63
22
.005
347
Travis Proulx
174
63
19
62
22
.005
348
Peter M. Gollwitzer
1303
64
19
58
22
.005
349
Nilanjana Dasgupta
383
76
19
52
22
.005
350
Jamie L. Goldenberg
568
77
19
50
22
.01
351
Richard P. Eibach
753
69
19
47
23
.001
352
Gerald L. Clore
456
74
19
45
22
.001
353
James M. Tyler
130
87
18
74
24
.005
354
Roland Deutsch
365
78
18
71
24
.005
355
Ed Diener
498
64
18
68
24
.005
356
Kennon M. Sheldon
698
74
18
66
23
.005
357
Wilhelm Hofmann
624
67
18
66
23
.005
358
Laura L. Carstensen
723
77
18
64
24
.005
359
Toni Schmader
546
69
18
61
24
.005
360
Frank D. Fincham
734
69
18
59
24
.005
361
David K. Sherman
1128
61
18
57
24
.005
362
Lisa K. Libby
418
65
18
54
24
.005
363
Chen-Bo Zhong
327
68
18
49
25
.005
364
Stefan C. Schmukle
114
62
17
71
26
.005
365
Michel Tuan Pham
246
86
17
68
25
.005
366
Leandre R. Fabrigar
632
70
17
67
26
.005
367
Neal J. Roese
368
64
17
65
25
.005
368
Carey K. Morewedge
633
76
17
65
26
.005
369
Timothy D. Wilson
798
65
17
63
26
.005
370
Brad J. Bushman
897
74
17
62
25
.005
371
Ara Norenzayan
225
72
17
61
25
.005
372
Benoit Monin
635
65
17
56
25
.005
373
Michael W. Kraus
617
72
17
55
26
.005
374
Ad van Knippenberg
683
72
17
55
26
.001
375
E. Tory. Higgins
1868
68
17
54
25
.001
376
Ap Dijksterhuis
750
68
17
54
26
.005
377
Joseph Cesario
146
62
17
45
26
.001
378
Simone Schnall
270
62
17
31
26
.001
379
Joshua M. Ackerman
380
53
16
70
13
.01
380
Melissa J. Ferguson
1163
72
16
69
27
.005
381
Laura A. King
391
76
16
68
29
.005
382
Daniel T. Gilbert
724
65
16
65
27
.005
383
Charles S. Carver
154
82
16
64
28
.005
384
Leif D. Nelson
409
74
16
64
28
.005
385
David DeSteno
201
83
16
57
28
.005
386
Sandra L. Murray
697
60
16
55
28
.001
387
Heejung S. Kim
858
59
16
55
29
.001
388
Mark P. Zanna
659
64
16
48
28
.001
389
Nira Liberman
1304
75
15
65
31
.005
390
Gun R. Semin
159
79
15
64
29
.005
391
Tal Eyal
439
62
15
62
29
.005
392
Nathaniel M Lambert
456
66
15
59
30
.001
393
Angela L. Duckworth
122
61
15
55
30
.005
394
Dana R. Carney
200
60
15
53
30
.001
395
Garriy Shteynberg
168
54
15
31
30
.005
396
Lee Ross
349
77
14
63
31
.001
397
Arie W. Kruglanski
1228
78
14
58
33
.001
398
Ziva Kunda
217
67
14
56
31
.001
399
Shelley E. Taylor
427
69
14
52
31
.001
400
Jon K. Maner
1040
65
14
52
32
.001
401
Gabriele Oettingen
1047
61
14
49
33
.001
402
Nicole L. Mead
240
70
14
46
33
.01
403
Gregory M. Walton
587
69
14
44
33
.001
404
Michael A. Olson
346
65
13
63
35
.001
405
Fiona Lee
221
67
13
58
34
.001
406
Melody M. Chao
237
57
13
58
36
.001
407
Adam L. Alter
314
78
13
54
36
.001
408
Sarah E. Hill
509
78
13
52
34
.001
409
Jaime L. Kurtz
91
55
13
38
37
.001
410
Michael A. Zarate
120
52
13
31
36
.001
411
Jennifer K. Bosson
659
76
12
64
40
.001
412
Daniel M. Oppenheimer
198
80
12
60
37
.001
413
Deborah A. Prentice
89
80
12
57
38
.001
414
Yaacov Trope
1277
73
12
57
38
.001
415
Oscar Ybarra
305
63
12
55
40
.001
416
William von Hippel
398
65
12
48
40
.001
417
Steven J. Spencer
541
67
12
44
38
.001
418
Martie G. Haselton
186
73
11
54
43
.001
419
Shelly Chaiken
360
74
11
52
44
.001
420
Susan M. Andersen
361
74
11
48
43
.001
421
Dov Cohen
641
68
11
44
41
.001
422
Mark Muraven
496
52
11
44
41
.001
423
Ian McGregor
409
66
11
40
41
.001
424
Hans Ijzerman
214
56
9
46
51
.001
425
Linda M. Isbell
115
64
9
41
50
.001
426
Cheryl J. Wakslak
278
73
8
35
59
.001
Cookie Consent
We use cookies to improve your experience on our site. By using our site, you consent to cookies.