Psychological Science is the flagship journal of the Association for Psychological Science (APS). In response to the replication crisis, D. Stephen Lindsay worked hard to increase the credibility of results published in this journal as editor from 2014-2019 (Schimmack, 2020). This work paid off and meta-scientific evidence shows that publication bias decreased and replicability increased (Schimmack, 2020). In the replicability rankings, Psychological Science is one of a few journals that show reliable improvement over the past decade (Schimmack, 2020).
The good news is that these concerns were unfounded. The meta-scientific criteria of credibility did not change notably from 2019 to 2020.
The observed discovery rates were 64% in 2019 and 66% in 2020. The estimated discovery rates were 58% in 2019 and 59%, respectively. Visual inspection of the z-curves and the slightly higher ODR than EDR suggests that there is still some selection for significant result. That is, researchers use so-called questionable research practices to produce statistically significant results. However, the magnitude of these questionable research practices is small and much lower than in 2010 (ODR = 77%, EDR = 38%).
Based on the EDR, it is possible to estimate the maximum false discovery rate (i.e., the percentage of significant results where the null-hypothesis is true). This rate is low with 4% in both years. Even the upper limit of the 95%CI is only 12%. This contradicts the widespread concern that most published (significant) results are false (Ioannidis, 2005).
The expected replication rate is slightly, but not significantly (i.e., it could be just sampling error) lower in 2020 (76% vs. 83%). Given the small risk of a false positive result, this means that on average significant results were obtained with the recommended power of 80% (Cohen, 1988).
Overall, these results suggest that published results in Psychological Science are credible and replicable. However, this positive evaluations comes with a few caveats.
First, null-hypothesis significance testing can only provide information that there is an effect and the direction of the effect. It cannot provide information about the effect size. Moreover, it is not possible to use the point estimates of effect sizes in small samples to draw inferences about the actual population effect size. Often the 95% confidence interval will include small effect sizes that may have no practical significance. Readers should clearly evaluate the lower limit of the 95%CI to examine whether a practically significant effect was demonstrated.
Second, the replicability estimate of 80% is an average. The average power of results that are just significant is lower. The local power estimates below the x-axis suggest that results with z-scores between 2 and 3 (p < .05 & p > .005) have only 50% power. It is recommended to increase sample sizes for follow-up studies.
Third, the local power estimates also show that most non-significant results are false negatives (type-II errors). Z-scores between 1 and 2 are estimated to have 40% average power. It is unclear how often articles falsely infer that an effect does not exist or can be ignored because the test was not significant. Often sampling error alone is sufficient to explain differences between test statistics in the range from 1 to 2 and from 2 to 3.
Finally, 80% power is sufficient for a single focal test. However, with 80% power, multiple focal tests are likely to produce at least one non-significant result. If all focal tests are significant, there is a concern that questionable research practices were used (Schimmack, 2012).
Readers should also carefully examine the results of individual articles. The present results are based on automatic extraction of all statistical tests. If focal tests have only p-values in the range between .05 and .005, the results are less credible than if at least some p-values are below .005 (Schimmack, 2020).
In conclusion, Psychological Science has responded to concerns about a high rate of false positive results by increasing statistical power and reducing publication bias. This positive trend continued in 2020 under the leadership of the new editor Patricia Bauer.
Update: 2/27/2021 This post has been replaced by a new post. The rankings here are only shown for the sake of transparency, but scores have been replaced and the new scores should be used (https://replicationindex.com/2021/01/19/personalized-p-values/). The correlation between these scores and the new scores is r ~ .5. This is fairly low and I have been trying to figure out the reason for the discrepancy. However, I am not able to reproduce the results posted here. The problem is that I did not document the criteria for journal selection and I did not store the files with the list of articles for each author. Thus, these results are not reproducible. In contrast, the new results are reproducible and the data are openly shared to allow others to reproduce the results.
Original Post from November 8, 2018
Social psychology has a replication problem. The reason is that social psychologists used questionable research practices to increase their chances of reporting significant results. The consequence is that the real risk of a false positive result is higher than the stated 5% level in publications. In other words, p < .05 no longer means that at most 5% of published results are false positives (Sterling, 1959). Another problem is that selection for significance with low power produces inflated effect sizes estimates. Estimates suggests that on average published effect sizes are inflated by 100% (OSC, 2015). These problems have persisted for decades (Sterling, 1959), but only now psychologists are recognizing that published results provide weak evidence and might not be replicable even if the same study were replicated exactly.
How should consumers of empirical social psychology (textbook writers, undergraduate students, policy planners) respond to the fact that published results cannot be trusted at face value? Jerry Brunner and I have been working on ways to correct published results for the inflation introduced by selection for significance and questionable practices. Z-curve estimates the mean power of studies selected for significance. Here I applied the method to automatically extracted test statistics from social psychology journals. I computed z-curves for 70+ eminent social psychologists (H-index > 35).
The results can be used to evaluate the published results reported by individual researchers. The main information provided in the table are (a) the replicability of all published p-values, (b) the replicability of just significant p-values (defined as p-values greater than pnorm(2.5) = .0124, and (c) the replicability of p-values with moderate evidence against the null-hypothesis (.0124 > p > .0027). More detailed information is provided in the z-curve plots (powergraphs) that are linked to researchers’ names. An index less than 50% would suggest that these p-values are no longer significant after adjusting for selection for significance. As can be seen in the table, most just significant results are no longer significant after correction for bias.
Caveat: Interpret with Care
The results should not be overinterpreted. They are estimates based on an objective statistical procedure, but no statistical method can compensate perfectly for the various practices that led to the observed distribution of p-values (transformed into z-scores). However, in the absence of any information which results can be trusted, these graphs provide some information. How this information is used by consumers depends ultimately on consumers’ subjective beliefs. Information about the average replicability of researchers’ published results may influence these beliefs.
It is also important to point out that a low replicability index does not mean researchers were committing scientific misconduct. There are no clear guidelines about acceptable and unacceptable statistical practices in psychology. Zcurve is not designed to detect scientific fraud. In fact, it assumes that researcher collect data, but conduct analyses in a way that increases the chances of producing a significant result. The bias introduced by selection for significance is well known and considered acceptable in psychological science.
There are also many factors that can bias results in favor of researchers’ hypotheses without researchers’ awareness. Thus, the bias evident in many graphs does not imply that researchers intentionally manipulated data to support their claims. Thus, I attribute the bias to unidentified researcher influences. It is not important to know how bias occurred. It is only important to detect biases and to correct for them.
It is necessary to do so for individual researchers because bias varies across researchers. For example, the R-Index for all results ranges from 22% to 81%. It would be unfair to treat all social psychologists alike when their research practices are a reliable moderator of replicability. Providing personalized information about replicability allows consumers of social psychological research to avoid stereotyping social psychologists and to take individual differences in research practices into account.
Finally, it should be said that producing replicabilty estimates is subject to biases and errors. Researchers may differ in their selection of hypotheses that they are reporting. A more informative analysis would require hand-coding of researchers’ focal hypothesis tests. At the moment, R-Index does not have the resources to code all published results in social psychology, let alone other areas of psychology. This is an important task for the future. At the moment, automatically extracted results have some heuristic value.
One unintended and unfortunate consequence of making this information available is that some researchers’ reputation might be negatively effected by a low replicability score. This cost has be be weighted against the benefit to the public and the scientific community of obtaining information about the robustness of published results. In this regard, the replicability rankings are no different from actual replication studies that fail to replicate an original finding. The only difference is that replicability rankings use all published results, whereas actual replication studies are often limited to a single or a few studies. While replication failures in a single study are ambiguous, replicability esitmates based on hundreds of published results are more diagnostic of researchers’ practices.
Nevertheless, statistical estimates provide no definitive answer about the reproducibility of a published result. Ideally, eminent researchers would conduct their own replication studies to demonstrate that their most important findings can be replicated under optimal conditions.
It is also important to point out that researchers have responded differently to the replication crisis that became apparent in 2011. It may be unfair to generalize from past practices to new findings for researchers who changed their practices. If researchers preregistered their studies and followed a well-designed registered research protocol, new results may be more robust than a researchers’ past record suggests.
Finally, the results show evidence of good replicability for some social psychologists. Thus, the rankings avoid the problem of selectively targeting researchers with low replicability, which can lead to a negative bias in evaluations of social psychology. The focus on researchers with a high H-index means that the results are representative of the field.
If you believe that you should not be listed as an eminent social psychologists, please contact me so that I can remove you from the list.
If you think you are an eminent social psychologists and you want to be included in the ranking, please contact me so that I can add you to the list.
If you have any suggestions or comments how I can make these rankings more informative, please let me know in the comments section.
*** *** *** *** ***
REPLICABILITY RANKING OF EMINENT SOCIAL PSYCHOLOGISTS
[sorted by R-Index for all tests from highest to lowest rank]
Over the past five years, psychological science has been in a crisis of confidence. For decades, psychologists have assumed that published significant results provide strong evidence for theoretically derived predictions, especially when authors presented multiple studies with internal replications within a single article (Schimmack, 2012). However, even multiple significant results provide little empirical evidence, when journals only publish significant results (Sterling, 1959; Sterling et al., 1995). When published results are selected for significance, statistical significance loses its ability to distinguish replicable effects from results that are difficult to replicate or results that are type-I errors (i.e., the theoretical prediction was false).
The crisis of confidence led to several initiatives to conduct independent replications. The most informative replication initiative was conducted by the Open Science Collaborative (Science, 2015). It replicated close to 100 significant results published in three high-ranked psychology journals. Only 36% of the replication studies replicated a statistically significant result. The replication success rate varied by journal. The journal “Psychological Science” achieved a success rate of 42%.
The low success rate raises concerns about the empirical foundations of psychology as a science. Without further information, a success rate of 42% implies that it is unclear which published results provide credible evidence for a theory and which findings may not replicate. It is impossible to conduct actual replication studies for all published studies. Thus, it is highly desirable to identify replicable findings in the existing literature.
One solution is to estimate replicability for sets of studies based on the published test statistics (e.g., F-statistic, t-values, etc.). Schimmack and Brunner (2016) developed a statistical method, Powergraphs, that estimates the average replicability of a set of significant results. This method has been used to estimate replicability of psychology journals using automatic extraction of test statistics (2016 Replicability Rankings, Schimmack, 2017). The results for Psychological Science produced estimates in the range from 55% to 63% for the years 2010-2016 with an average of 59%. This is notably higher than the success rate for the actual replication studies, which only produced 42% successful replications.
There are two explanations for this discrepancy. First, actual replication studies are not exact replication studies and differences between the original and the replication studies may explain some replication failures. Second, the automatic extraction method may overestimate replicability because it may include non-focal statistical tests. For example, significance tests of manipulation checks can be highly replicable, but do not speak to the replicability of theoretically important predictions.
To address the concern about automatic extraction of test statistics, I estimated replicability of focal hypothesis tests in Psychological Science with hand-coded, focal hypothesis tests. I used three independent data sets.
Study 1
For Study 1, I hand-coded focal hypothesis tests of all studies in the 2008 Psychological Science articles that were used for the OSC reproducibility project (Science, 2015).
The powergraphs show the well-known effect of publication bias in that most published focal hypothesis tests report a significant result (p < .05, two-tailed, z > 1.96) or at least a marginally significant result (p < .10, two-tailed or p < .05, one-tailed, z > 1.65). Powergraphs estimate the average power of studies with significant results on the basis of the density distribution of significant z-scores. Average power is an estimate of replicabilty for a set of exact replication studies. The left graph uses all significant results. The right graph uses only z-scores greater than 2.4 because questionable research practices may produce many just-significant results and lead to biased estimates of replicability. However, both estimation methods produce similar estimates of replicability (57% & 61%). Given the small number of statistics the 95%CI is relatively wide (left graph: 44% to 73%). These results are compatible with the low actual success rate for actual replication studies (42%) and the estimate based on automated extraction (59%).
Study 2
The second dataset was provided by Motyl et al. (JPSP, in press), who coded a large number of articles from social psychology journals and psychological science. Importantly, they coded a representative sample of Psychological Science studies from the years 2003, 2004, 2013, and 2014. That is, they did not only code social psychology articles published in Psychological Science. The dataset included 281 test statistics from Psychological Science.
The powergraph looks similar to the powergraph in Study 1. More important, the replicability estimates are also similar (57% & 52%). The 95%CI for Study 1 (44% to 73%) and Study 2 (left graph: 49% to 65%) overlap considerably. Thus, two independent coding schemes and different sets of studies (2008 vs. 2003-2004/2013/2014) produce very similar results.
Study 3
Study 3 was carried out in collaboration with Sivaani Sivaselvachandran, who hand-coded articles from Psychological Science published in 2016. The replicability rankings showed a slight positive trend based on automatically extracted test statistics. The goal of this study was to examine whether hand-coding would also show an increase in replicability. An increase was expected based on an editorial by D. Stephen Linday, incoming editor in 2015, who aimed to increase replicability of results published in Psychological Science by introducing badges for open data and preregistered hypotheses. However, the results failed to show a notable increase in average replicability.
The replicability estimate was similar to those in the first two studies (59% & 59%). The 95%CI ranged from 49% to 70%. These wide confidence intervals make it difficult to notice small improvements, but the histogram shows that just significant results (z = 2 to 2.2) are still the most prevalent results reported in Psychological Science and that non-significant results that are to be expected are not reported.
Combined Analysis
Given the similar results in all three studies, it made sense to pool the data to obtain the most precise estimate of replicability of results published in Psychological Science. With 479 significant test statistics, replicability was estimated at 58% with a 95%CI ranging from 51% to 64%. This result is in line with the estimated based on automated extraction of test statistics (59%). The reason for the close match between hand-coded and automated results could be that Psych Science publishes short articles and authors may report mostly focal results because space does not allow for extensive reporting of other statistics. The hand-coded data confirm that replicabilty in Psychological Science is likely to be above 50%.
It is important to realize that the 58% estimate is an average. Powergraphs also show average replicability for segments of z-scores. Here we see that replicabilty for just-significant results (z < 2.5 ~ p > .01) is only 35%. Even for z-score between 2.5 and 3.0 (~ p > .001) is only 47%. Once z-scores are greater than 3, average replicabilty is above 50% and with z-scores greater than 4, replicability is greater than 80%. For any single study, p-values can vary greatly due to sampling error, but in general a published result with a p-value < .001 is much more likely to replicate than a p-value > .01 (see also OSC, Science, 2015).
Conclusion
This blog-post used hand-coding of test-statistics published in Psychological Science, the flagship journal of the Association for Psychological Science, to estimate replicabilty of published results. Three dataset produced convergent evidence that the average replicabilty of exact replication studies is 58% +/- 7%. This result is consistent with estimates based on automatic extraction of test statistics. It is considerably higher than the success rate of actual replication studies in the OSC reproducibility project (42%). One possible reason for this discrepancy is that actual replication studies are never exact replication studies, which makes it more difficult to obtain statistical significance if the original studies are selected for significance. For example, the original study may have had an outlier in the experimental group that helped to produce a significant result. Not removing this outlier is not considered a questionable research practice, but an exact replication study will not reproduce the same outlier and may fail to reproduce a just-significant result. More broadly, any deviation from the assumptions underlying the computation of test statistics will increase the bias that is introduced by selecting significant results. Thus, the 58% estimate is an optimistic estimate of the maximum replicability under ideal conditions.
At the same time, it is important to point out that 58% replicability for Psychological Science does not mean psychological science is rotten to the core (Motyl et al., in press) or that most reported results are false (Ioannidis, 2005). Even results that did not replicate in actual replication studies are not necessarily false positive results. It is possible that more powerful studies would produce a significant result, but with a smaller effect size estimate.
Hopefully, these analyses will spur further efforts to increase replicability of published results in Psychological Science and in other journals. We are already near the middle of 2017 and can look forward to the 2017 results.
Update: October 24, 2017.
The preliminary 2017 rankings are now available. They provide information for the years 2010-2017, updated analyses, and a correction in the estimates due to a computational error that lowered estimates by about 10 percentage points, on average. Please check the newer rankings for the most reliable information.
—————————————————————————————————————————————–
I post the rankings on top. Detailed information and statistical analysis are provided below the table. You can click on the journal title to see Powergraphs for each year.
Notes.
1. Change scores are the unstandardized regression weights with replicabilty estimates as outcome variable and year as predictor variable. Year was coded from 0 for 2010 to 1 for 2016 so that the regression coefficient reflects change over the full 7 year period. This method is preferable to a simple difference score because estimates in individual years are variable and are likely to overestimate change.
2. Rich E. Lucas, Editor of JRP, noted that many articles in JRP do not report t of F values in the text and that the replicability estimates based on these statistics may not be representative of the bulk of results reported in this journal. Hand-coding of articles is required to address this problem and the ranking of JRP, and other journals, should be interpreted with caution (see further discussion of these issues below).
Introduction
I define replicability as the probability of obtaining a significant result in an exact replication of a study that produced a significant result. In the past five years, it has become increasingly clear that psychology suffers from a replication crisis. Even results that are replicated internally by the same author multiple times fail to replicate in independent replication attempts (Bem, 2011). The key reason for the replication crisis is selective publishing of significant results (publication bias). While journals report over 95% significant results (Sterling, 1959; Sterling et al., 1995), a 2015 article estimated that less than 50% of these results can be replicated (OSC, 2015).
The OSC reproducibility made an important contribution by demonstrating that published results in psychology have low replicability. However, the reliance on actual replication studies has a a number of limitations. First, actual replication studies are expensive or impossible (e.g., a longitudinal study spanning 20 years). Second, studies selected for replication may not be representative because the replication team lacks expertise to replicate some studies. Finally, replication studies take time and replicability of recent studies may not be known for several years. This makes it difficult to rely on actual replication studies to rank journals and to track replicability over time.
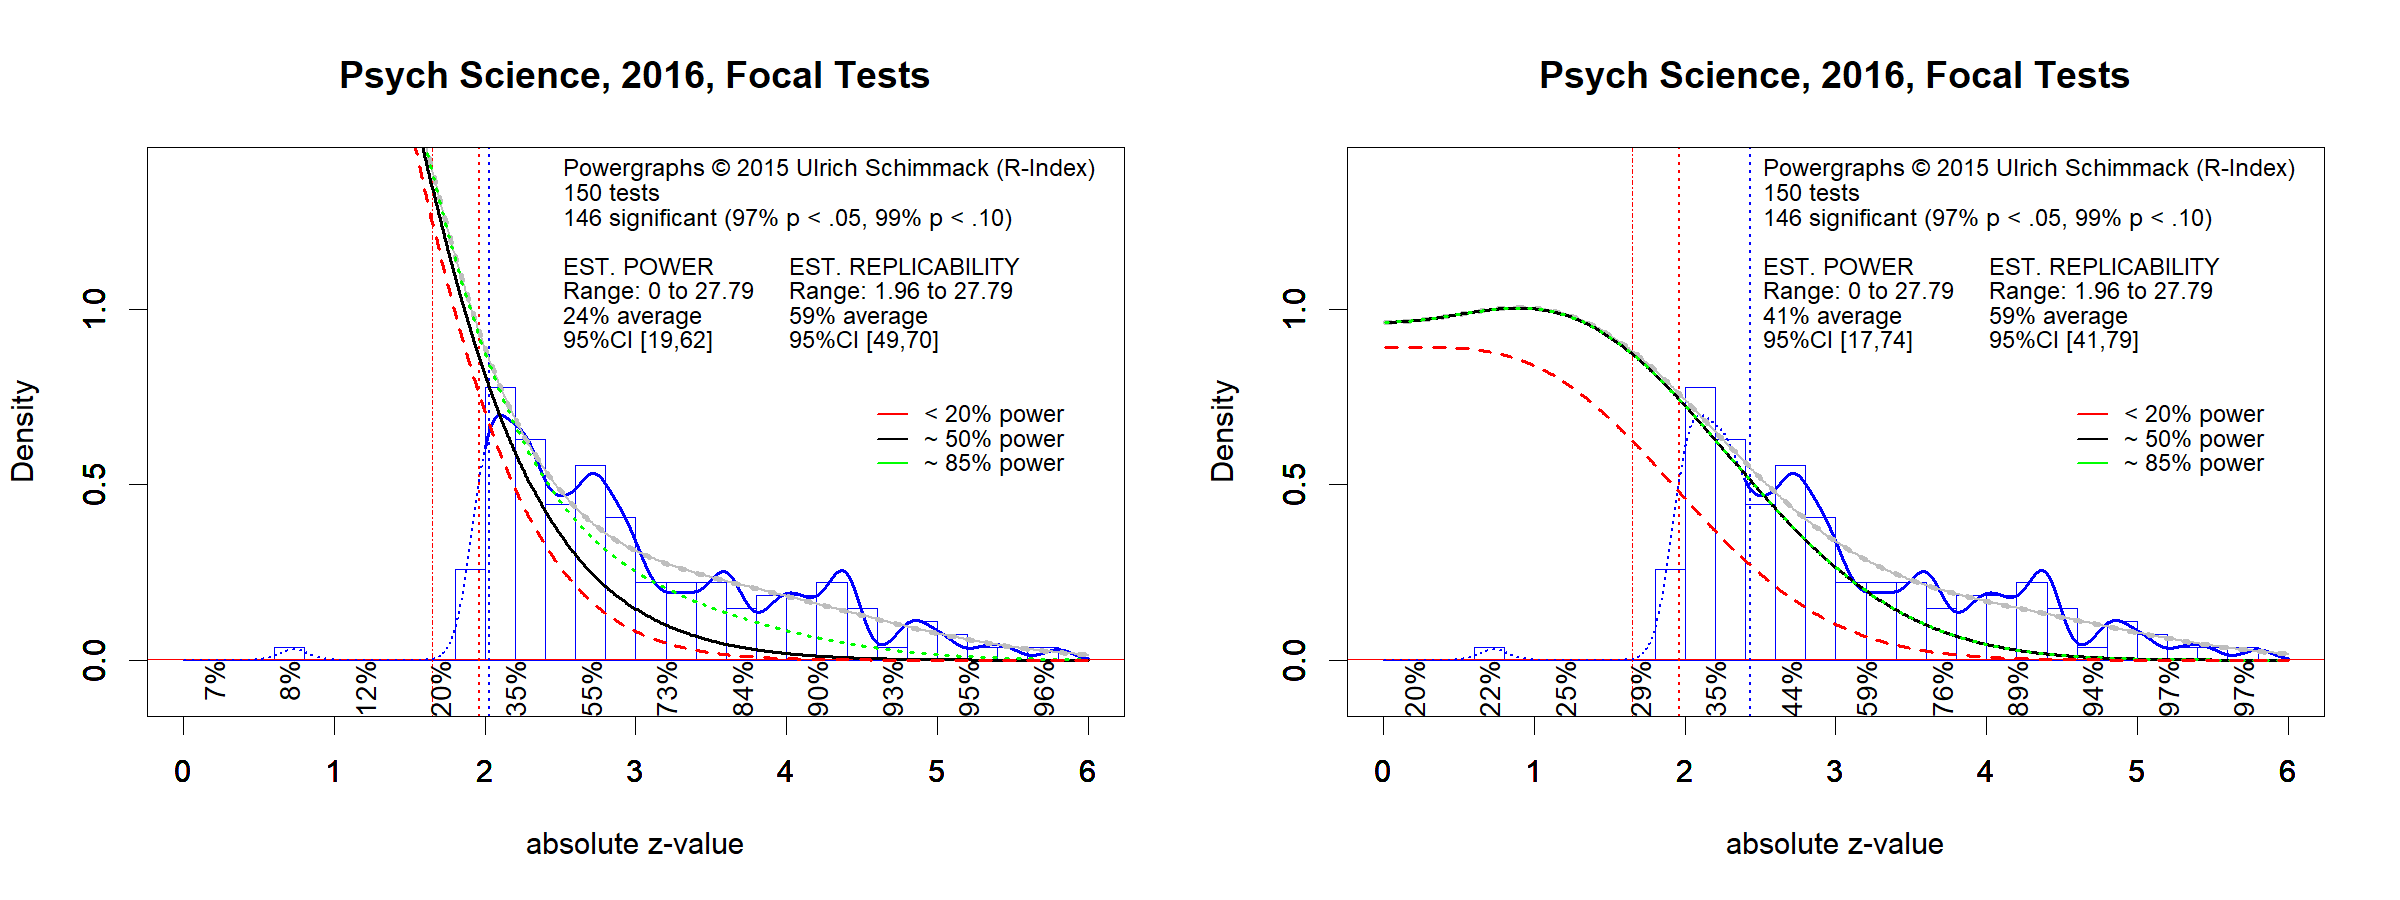
Schimmack and Brunner (2016) developed a statistical method (z-curve) that makes it possible to estimate average replicability for a set of published results based on the original results in published articles. This statistical approach to the estimation of replicability has several advantages over the use of actual replication studies. Replicability can be assessed in real time, it can be estimated for all published results, and it can be used for expensive studies that are impossible to reproduce. Finally, it has the advantage that actual replication studies can be criticized (Gilbert, King, Pettigrew, & Wilson, 2016). Estimates of replicabilty based on original studies do not have this problem because they are based on published results in original articles.
Z-curve has been validated with simulation studies and can be used when replicability varies across studies and when there is selection for significance, and is superior to similar statistical methods that correct for publication bias (Brunner & Schimmack, 2016). I use this method to estimate the average replicability of significant results published in 103 psychology journals. Separate estimates were obtained for the years from 2010, one year before the start of the replication crisis, to 2016 to examine whether replicability increased in response to discussions about replicability. The OSC estimate of replicability was based on articles published in 2008 and it was limited to three journals. I posted replicability estimates based on z-curve for the year 2015 (2015 replicability rankings). There was no evidence that replicability had increased during this time period.
The main empirical question was whether the 2016 rankings show some improvement in replicability and whether some journals or disciplines have responded more strongly to the replication crisis than others.
A second empirical question was whether replicabilty varies across disciplines. The OSC project provided first evidence that traditional cognitive psychology is more replicable than social psychology. Replicability estimates with z-curve confirmed this finding. In the 2015 rankings, The Journal of Experimental Psychology: Learning, Memory and Cognition ranked 25 with a replicability estimate of 74, whereas the two social psychology sections of the Journal of Personality and Social Psychology ranked 73 and 99 (68% and 60% replicability estimates). For this post, I conducted more extensive analyses of disciplines.
Journals
The 103 journals that are included in these rankings were mainly chosen based on impact factors. The list also includes diverse areas of psychology, including cognitive, developmental, social, personality, clinical, biological, and applied psychology. The 2015 list included some new journals that started after 2010. These journals were excluded from the 2016 rankings to avoid missing values in statistical analyses of time trends. A few journals were added to the list and the results may change when more journals are added to the list.
The journals were classified into 9 categories: social (24), cognitive (12), development (15), clinical/medical (19), biological (8), personality (5), and applied(IO,education) (8). Two journals were classified as general (Psychological Science, Frontiers in Psychology). The last category included topical, interdisciplinary journals (emotion, positive psychology).
Data
All PDF versions of published articles were downloaded and converted into text files. The 2015 rankings were based on conversions with the free program pdf2text pilot. The 2016 program used a superior conversion program pdfzilla. Text files were searched for reports of statistical results using my own R-code (z-extraction). Only F-tests, t-tests, and z-tests were used for the rankings. t-values that were reported without df were treated as z-values which leads to a slight inflation in replicability estimates. However, the bulk of test-statistics were F-values and t-values with degrees of freedom. A comparison of the 2015 rankings using the old method and the new method shows that extraction methods have an influence on replicability estimates some differences (r = .56). One reason for the low correlation is that replicability estimates have a relatively small range (50-80%) and low retest correlations. Thus, even small changes can have notable effects on rankings. For this reason, time trends in replicability have to be examined at the aggregate level of journals or over longer time intervals. The change score of a single journal from 2015 to 2016 is not a reliable measure of improvement.
Data Analysis
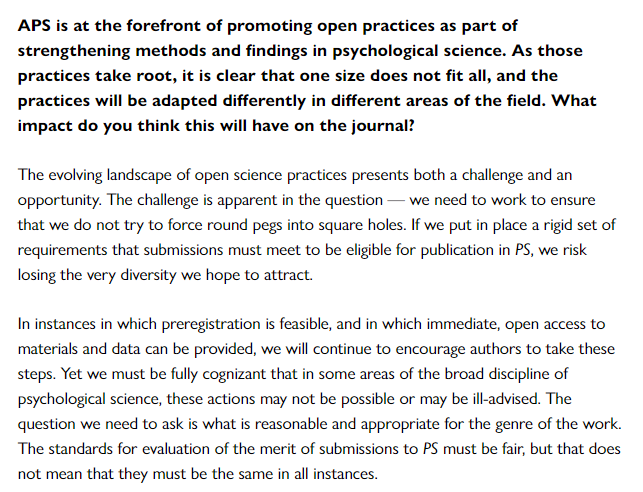
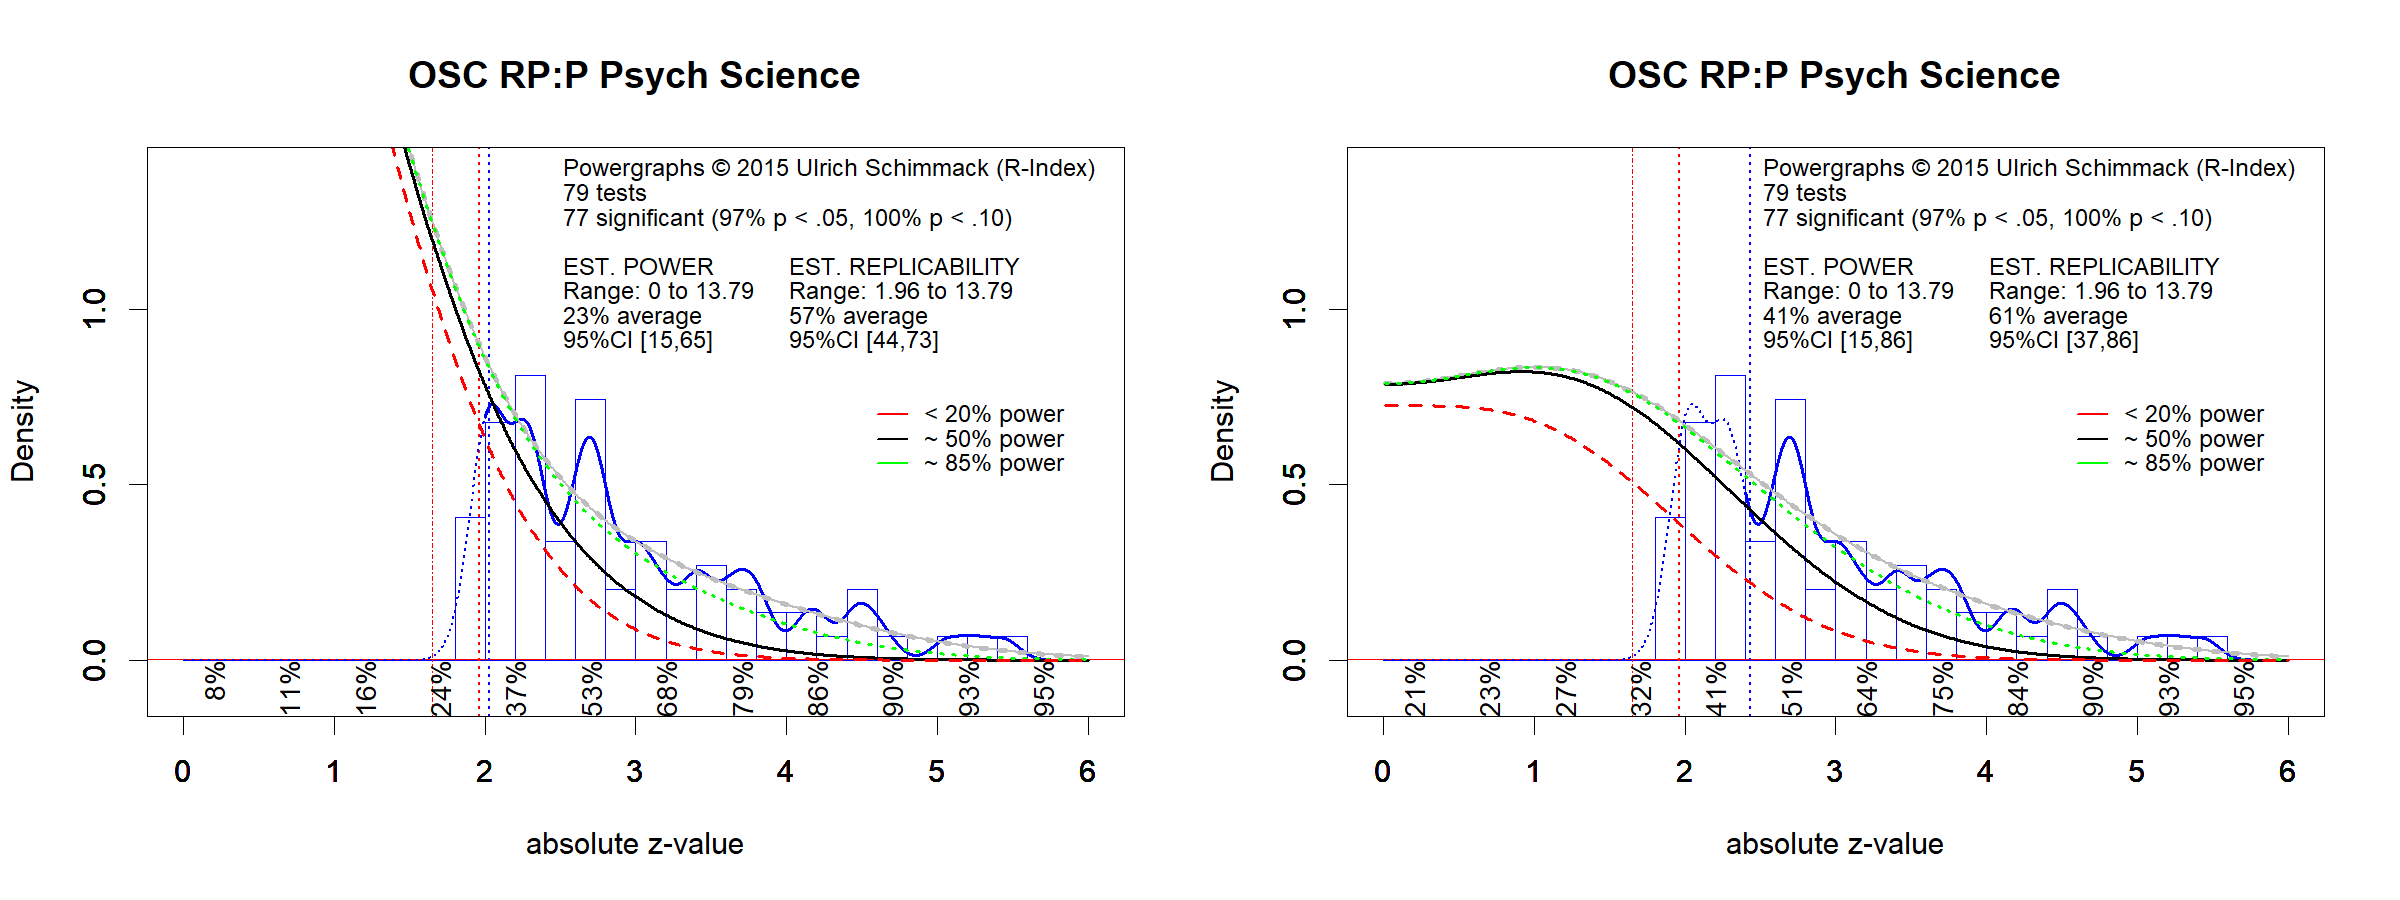
The data for each year were analyzed using z-curve Schimmack and Brunner (2016). The results of individual analysis are presented in Powergraphs. Powergraphs for each journal and year are provided as links to the journal names in the table with the rankings. Powergraphs convert test statistics into absolute z-scores as a common metric for the strength of evidence against the null-hypothesis. Absolute z-scores greater than 1.96 (p < .05, two-tailed) are considered statistically significant. The distribution of z-scores greater than 1.96 is used to estimate the average true power (not observed power) of the set of significant studies. This estimate is an estimate of replicability for a set of exact replication studies because average power determines the percentage of statistically significant results. Powergraphs provide additional information about replicability for different ranges of z-scores (z-values between 2 and 2.5 are less replicable than those between 4 and 4.5). However, for the replicability rankings only the replicability estimate is used.
Results
Table 1 shows the replicability estimates sorted by replicability in 2016.
The data were analyzed with a growth model to examine time trends and variability across journals and disciplines using MPLUS7.4. I compared three models. Model 1 assumed no mean level changes and variability across journals. Model 2 assumed a linear increase. Model 3 tested assumed no change from 2010 to 2015 and allowed for an increase in 2016.
Model 1 had acceptable fit (RMSEA = .043, BIC = 5004). Model 2 increased fit (RMSEA = 0.029, BIC = 5005), but BIC slightly favored the more parsimonious Model 1. Model 3 had the best fit (RMSEA = .000, BIC = 5001). These results reproduce the results of the 2015 analysis that there was no improvement from 2010 to 2015, but there is some evidence that replicability increased in 2016. Adding a variance component to slope in Model 3 produced an unidentified model. Subsequent analyses show that this is due to insufficient power to detect variation across journals in changes over time.
The standardized loadings of individual years on the latent intercept factor ranged from .49 to .58. This shows high variabibility in replicability estimates from year to year. Most of the rank changes can be attributed to random factors. A better way to compare journals is to average across years. A moving average of five years will provide reliable information and allow for improvement over time. The reliability of the 5-year average for the years 2012 to 2016 is 68%.
Figure 1 shows the annual averages with 95%CI as well relative to the average over the full 7-year period.
A paired t-test confirmed that average replicability in 2016 was significantly higher (M = 65, SD = 8) than in the previous years (M = 63, SD = 8), t(101) = 2.95, p = .004. This is the first evidence that psychological scientists are responding to the replicability crisis by publishing slightly more replicable results. Of course, this positive result has to be tempered by the small effect size. But if this trend continuous or even increases, replicability could reach 80% in 10 years.
The next analysis examined changes in replicabilty at the level of individual journals. Replicability estimates were regressed on a dummy variable that contrasted 2016 with the previous years. This analysis produced only 7 significant increases with p < .05 (one-tailed), which is only 2 more significant results than would be expected by chance alone. Thus, the analysis failed to identify particular journals that contribute to the improvement in the average. Figure 2 compares the observed distribution of t-values to the predicted distribution based on the null-hypothesis (no change).
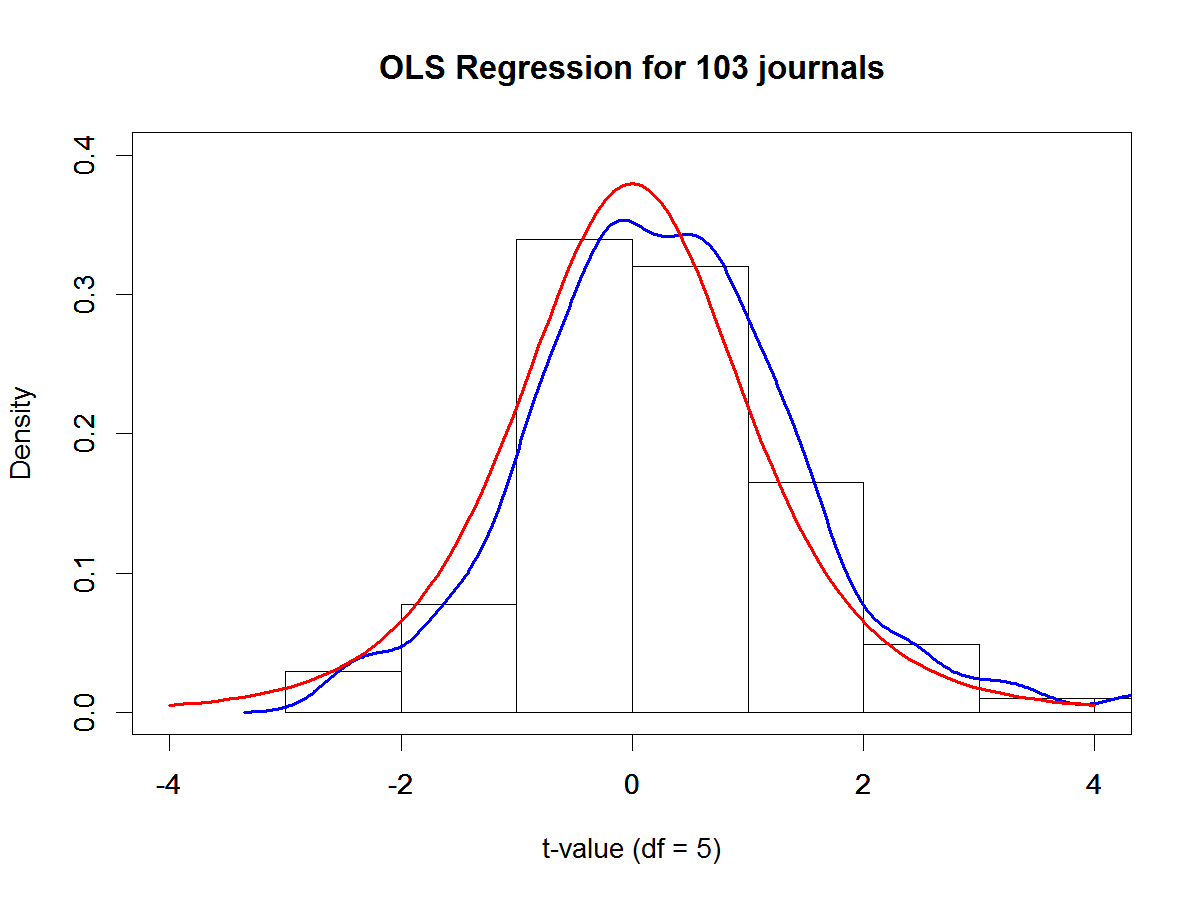
The blue line shows the observed density distribution, which is slightly moved to the right, but there is no set of journals with notably larger t-values. A more sustained and larger increase in replicability is needed to detect variability in change scores.
The next analyses examine stable differences between disciplines. The first analysis compared cognitive journals to social journals. No statistical tests are needed to see that cognitive journals publish more replicable results than social journals. This finding confirms the results with actual replications of studies published in 2008 (OSC, 2015). The Figure suggests that the improvement in 2016 is driven more by social journals, but only 2017 data can tell whether there is a real improvement in social psychology.
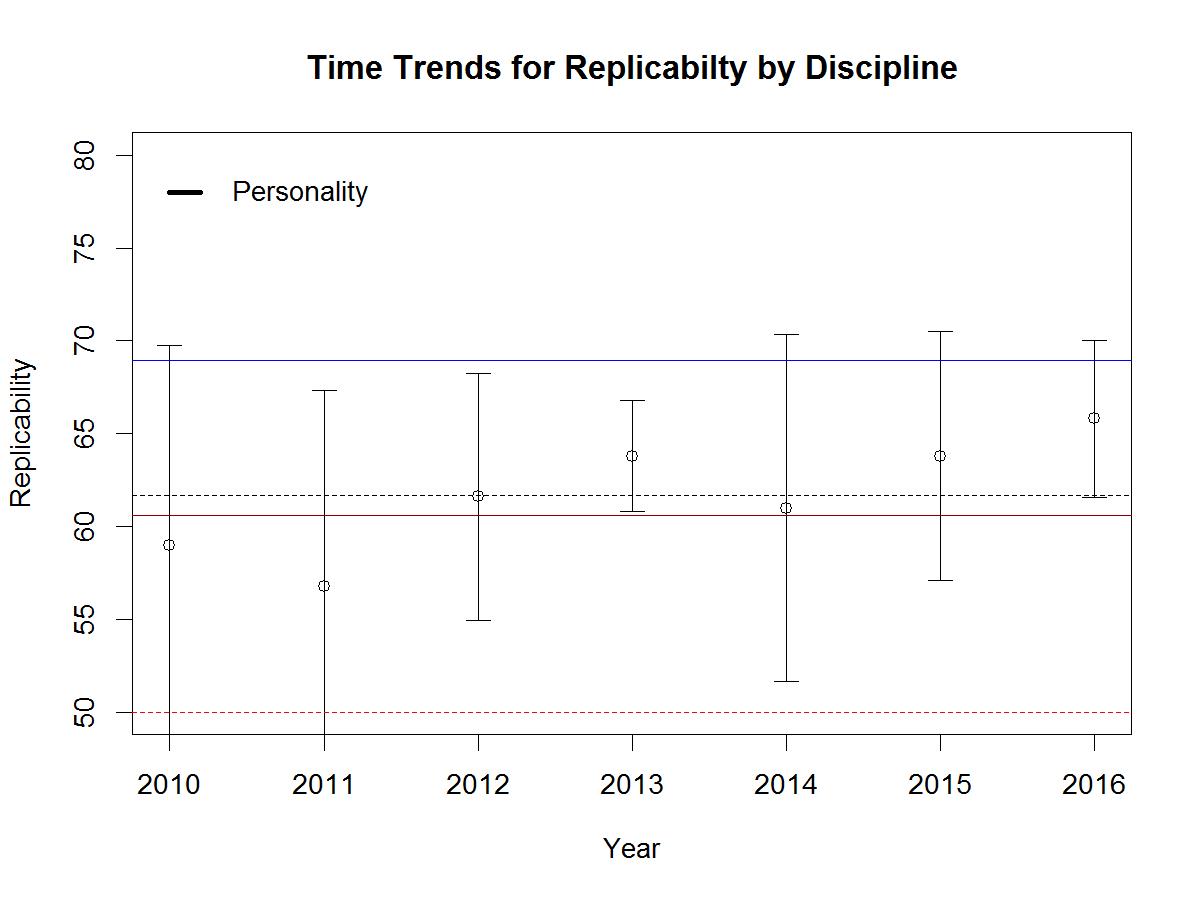
The next Figure shows the results for 5 personality journals. The large confidence intervals show that there is considerable variability among personality journals. The Figure shows the averages for cognitive and social psychology as horizontal lines. The average for personality is only slightly above the average for social and like social, personality shows an upward trend. In conclusion, personality and social psychology look very similar. This may be due to considerable overlap between the two disciplines, which is also reflected in shared journals. Larger differences may be visible for specialized social journals that focus on experimental social psychology.
The results for developmental journals show no clear time trend and the average is just about in the middle between cognitive and social psychology. The wide confidence intervals suggest that there is considerable variability among developmental journals. Table 1 shows Developmental Psychology ranks 14 / 103 and Infancy ranks 101/103. The low rank for Infancy may be due to the great difficulty of measuring infant behavior.
The clinical/medical journals cover a wide range of topics from health psychology to special areas of psychiatry. There has been some concern about replicability in medical research (Ioannidis, 2005). The results for clinical are similar to those for developmental journals. Replicability is lower than for cognitive psychology and higher than for social psychology. This may seem surprising because patient populations and samples tend to be smaller. However, a randomized controlled intervention study uses pre-post designs to boost power, whereas social and personality psychologists use comparisons across individuals, which requires large samples to reduce sampling error.
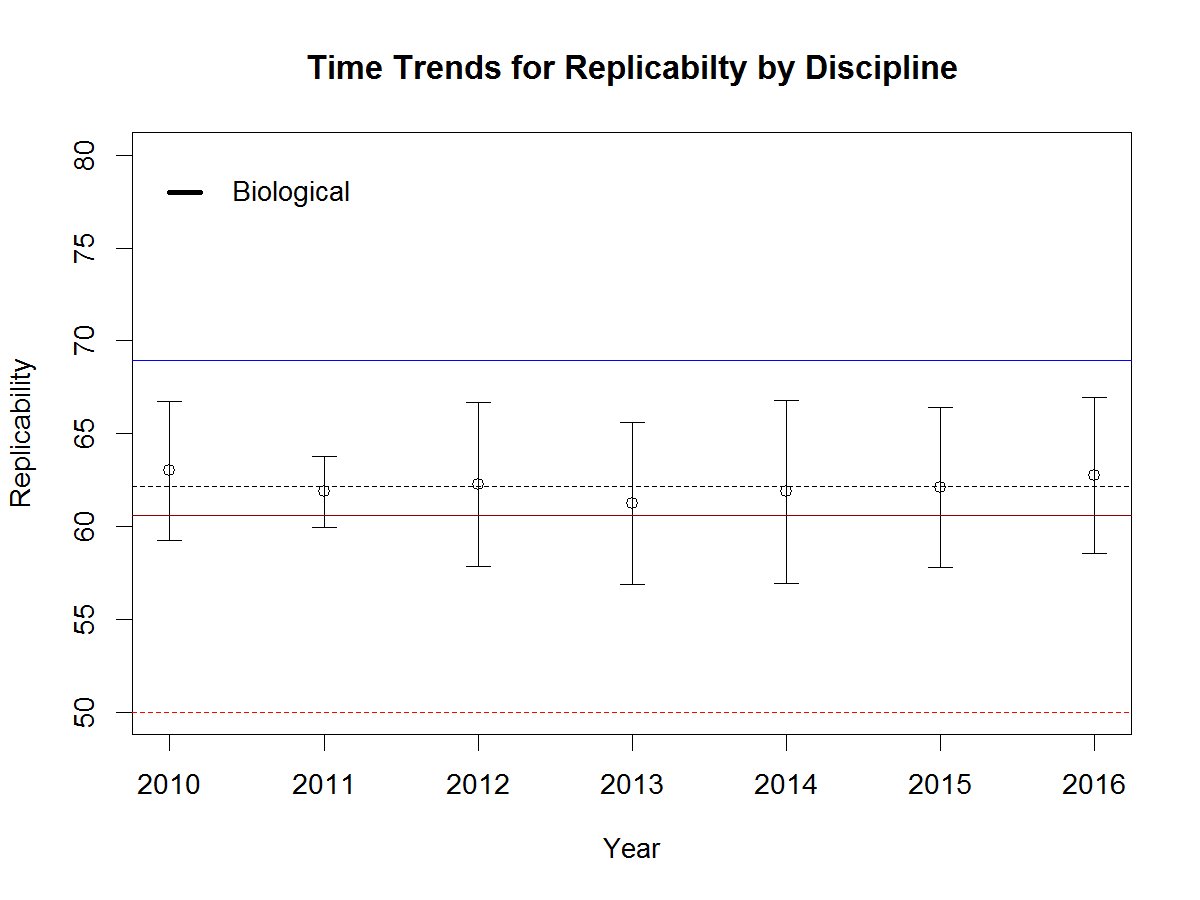
The set of biological journals is very heterogeneous and small. It includes neuroscience and classic peripheral physiology. Despite wide confidence intervals replicability for biological journals is significantly lower than replicabilty for cognitive psychology. There is no notable time trend. The average is slightly above the average for social journals.
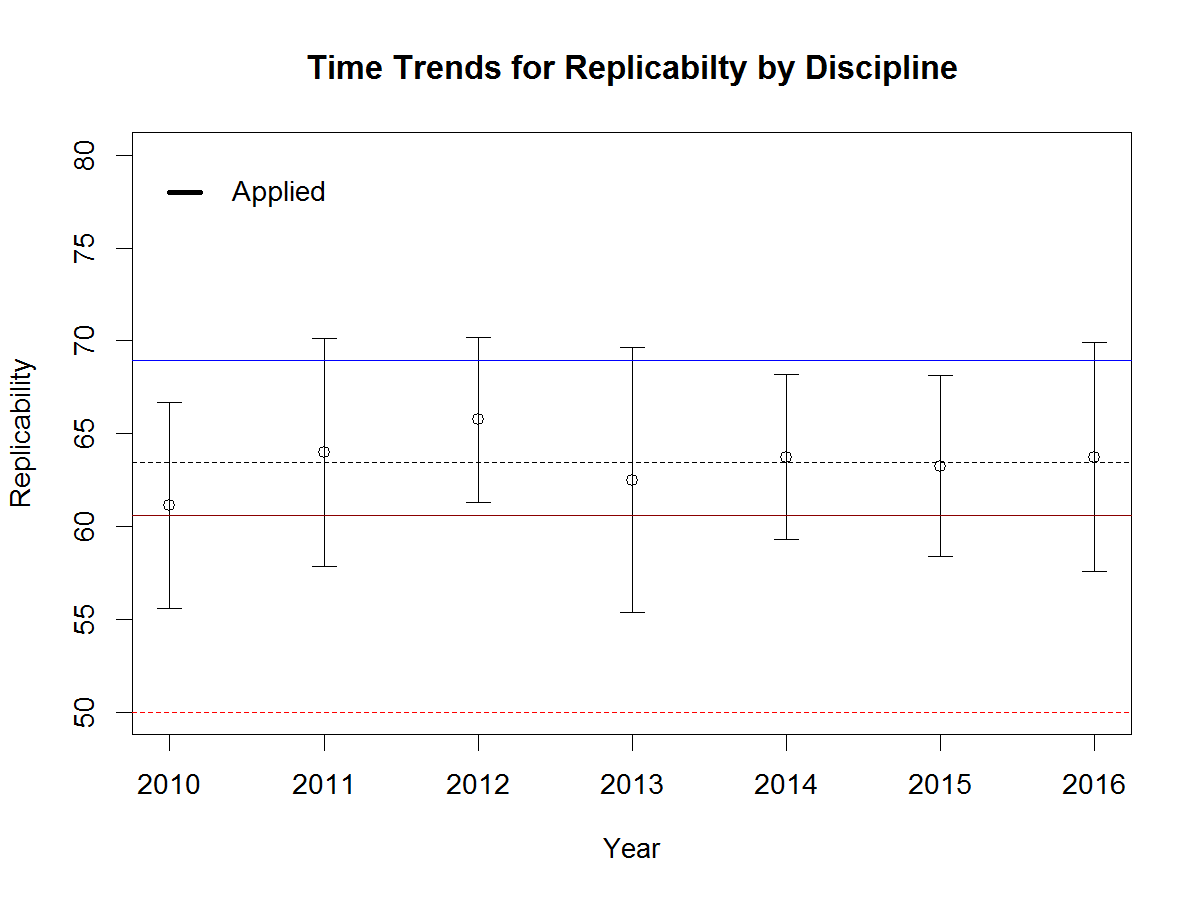
The last category are applied journals. One journal focuses on education. The other journals focus on industrial and organizational psychology. Confidence intervals are wide, but replicabilty is generally lower than for cognitive psychology. There is no notable time trend for this set of journals.
Given the stability of replicability, I averaged replicability estimates across years. The last figure shows a comparison of disciplines based on these averages. The figure shows that social psychology is significantly below average and cognitive psychology is significantly above average with the other disciplines falling in the middle. All averages are significantly above 50% and below 80%.
Discussion
The most exciting finding is that repicability appears to have increased in 2016. This increase is remarkable because averages in the years before consistently tracked the average of 63. The increase by 2 percentage points in 2016 is not large, but it may represent a first response to the replication crisis.
The increase is particularly remarkable because statisticians have been sounding the alarm bells about low power and publication bias for over 50 years (Cohen, 1962; Sterling, 1959), but these warnings have had no effect on research practices. In 1989, Sedlmeier and Gigerenzer (1989) noted that studies of statistical power had no effect on the statistical power of studies. The present results provide the first empirical evidence that psychologists are finally starting to change their research practices.
However, the results also suggest that most journals continue to publish articles with low power. The replication crisis has affected social psychology more than other disciplines with fierce debates in journals and on social media (Schimmack, 2016). On the one hand, the comparisons of disciplines supports the impression that social psychology has a bigger replicability problem than other disciplines. However, the differences between disciplines are small. With the exception of cognitive psychology, other disciplines are not a lot more replicable than social psychology. The main reason for the focus on social psychology is probably that these studies are easier to replicate and that there have been more replication studies in social psychology in recent years. The replicability rankings predict that other disciplines would also see a large number of replication failures, if they would subject important findings to actual replication attempts. Only empirical data will tell.
Limitations
The main limitation of replicability rankings is that the use of an automatic extraction method does not distinguish theoretically important hypothesis tests and other statistical tests. Although this is a problem for the interpretation of the absolute estimates, it is less important for the comparison over time. Any changes in research practices that reduce sampling error (e.g., larger samples, more reliable measures) will not only strengthen the evidence for focal hypothesis tests, but also increase the strength of evidence for non-focal hypothesis tests.
Schimmack and Brunner (2016) compared replicability estimates with actual success rates in the OSC (2015) replication studies. They found that the statistical method overestimates replicability by about 20%. Thus, the absolute estimates can be interpreted as very optimistic estimates. There are several reasons for this overestimation. One reason is that the estimation method assumes that all results with a p-value greater than .05 are equally likely to be published. If there are further selection mechanisms that favor smaller p-values, the method overestimates replicability. For example, sometimes researchers correct for multiple comparisons and need to meet a more stringent significance criterion. Only careful hand-coding of research articles can provide more accurate estimates of replicability. Schimmack and Brunner (2016) hand-coded the articles that were included in the OSC (2015) article and still found that the method overestimated replicability. Thus, the absolute values need to be interpreted with great caution and success rates of actual replication studies are expected to be at least 10% lower than these estimates.
Implications
Power and replicability have been ignored for over 50 years. A likely reason is that replicability is difficult to measure. A statistical method for the estimation of replicability changes this. Replicability estimates of journals make it possible for editors to compete with other journals in the replicability rankings. Flashy journals with high impact factors may publish eye-catching results, but if this journal has a reputation of publishing results that do not replicate, they are not very likely to have a big impact. Science is build on trust and trust has to be earned and can be easily lost. Eventually, journals that publish replicable results may also increase their impact because more researchers are going to build on replicable results published in these journals. In this way, replicability rankings can provide a much needed correction to the current incentive structure in science that rewards publishing as many articles as possible without any concerns about the replicability of these results. This reward structure is undermining science. It is time to change it. It is no longer sufficient to publish a significant result, if this result cannot be replicate in other labs.
Many scientists feel threatened by changes in the incentive structure and the negative consequences of replication failures for their reputation. However, researchers have control over their reputation. First, researchers often carry out many conceptually related studies. In the past, it was acceptable to publish only the studies that worked (p < .05). This selection for significance by researchers is the key factor in the replication crisis. The researchers who are conducting the studies are fully aware that it was difficult to get a significant result, but the selective reporting of these successes produces inflated effect size estimates and an illusion of high replicability that inevitably lead to replication failures. To avoid these embarrassing replication failures researchers need to report results of all studies or conduct fewer studies with high power. The 2016 rankings suggest that some researchers have started to change, but we will have to wait until 2017 to see whether 2017 can replicate the positive trend in the 2016 rankings.
Replicability rankings of psychology journals differs from traditional rankings based on impact factors (citation rates) and other measures of popularity and prestige. Replicability rankings use the test statistics in the results sections of empirical articles to estimate the average power of statistical tests in a journal. Higher average power means that the results published in a journal have a higher probability to produce a significant result in an exact replication study and a lower probability of being false-positive results.
The rankings are based on statistically significant results only (p < .05, two-tailed) because only statistically significant results can be used to interpret a result as evidence for an effect and against the null-hypothesis. Published non-significant results are useful for meta-analysis and follow-up studies, but they provide insufficient information to draw statistical inferences.
The average power across the 105 psychology journals used for this ranking is 70%. This means that a representative sample of significant results in exact replication studies is expected to produce 70% significant results. The rankings for 2015 show variability across journals with average power estimates ranging from 84% to 54%. A factor analysis of annual estimates for 2010-2015 showed that random year-to-year variability accounts for 2/3 of the variance and that 1/3 is explained by stable differences across journals.
The Journal Names are linked to figures that show the powergraphs of a journal for the years 2010-2014 and 2015. The figures provide additional information about the number of tests used, confidence intervals around the average estimate, and power estimates that estimate power including non-significant results even if these are not reported (the file-drawer).
Neyman & Pearson (1933) developed the theory of type-I and type-II errors in statistical hypothesis testing.
A type-I error is defined as the probability of rejecting the null-hypothesis (i.e., the effect size is zero) when the null-hypothesis is true.
A type-II error is defined as the probability of failing to reject the null-hypothesis when the null-hypothesis is false (i.e., there is an effect).
A common application of statistics is to provide empirical evidence for a theoretically predicted relationship between two variables (cause-effect or covariation). The results of an empirical study can produce two outcomes. Either the result is statistically significant or it is not statistically significant. Statistically significant results are interpreted as support for a theoretically predicted effect.
Statistically non-significant results are difficult to interpret because the prediction may be false (the null-hypothesis is true) or a type-II error occurred (the theoretical prediction is correct, but the results fail to provide sufficient evidence for it).
To avoid type-II errors, researchers can design studies that reduce the type-II error probability. The probability of avoiding a type-II error when a predicted effect exists is called power. It could also be called the probability of success because a significant result can be used to provide empirical support for a hypothesis.
Ideally researchers would want to maximize power to avoid type-II errors. However, powerful studies require more resources. Thus, researchers face a trade-off between the allocation of resources and their probability to obtain a statistically significant result.
Jacob Cohen dedicated a large portion of his career to help researchers with the task of planning studies that can produce a successful result, if the theoretical prediction is true. He suggested that researchers should plan studies to have 80% power. With 80% power, the type-II error rate is still 20%, which means that 1 out of 5 studies in which a theoretical prediction is true would fail to produce a statistically significant result.
Cohen (1962) examined the typical effect sizes in psychology and found that the typical effect size for the mean difference between two groups (e.g., men and women or experimental vs. control group) is about half-of a standard deviation. The standardized effect size measure is called Cohen’s d in his honor. Based on his review of the literature, Cohen suggested that an effect size of d = .2 is small, d = .5 moderate, and d = .8. Importantly, a statistically small effect size can have huge practical importance. Thus, these labels should not be used to make claims about the practical importance of effects. The main purpose of these labels is that researchers can better plan their studies. If researchers expect a large effect (d = .8), they need a relatively small sample to have high power. If researchers expect a small effect (d = .2), they need a large sample to have high power. Cohen (1992) provided information about effect sizes and sample sizes for different statistical tests (chi-square, correlation, ANOVA, etc.).
Cohen (1962) conducted a meta-analysis of studies published in a prominent psychology journal. Based on the typical effect size and sample size in these studies, Cohen estimated that the average power in studies is about 60%. Importantly, this also means that the typical power to detect small effects is less than 60%. Thus, many studies in psychology have low power and a high type-II error probability. As a result, one would expect that journals often report that studies failed to support theoretical predictions. However, the success rate in psychological journals is over 90% (Sterling, 1959; Sterling, Rosenbaum, & Weinkam, 1995). There are two explanations for discrepancies between the reported success rate and the success probability (power) in psychology. One explanation is that researchers conduct multiple studies and only report successful studies. The other studies remain unreported in a proverbial file-drawer (Rosenthal, 1979). The other explanation is that researchers use questionable research practices to produce significant results in a study (John, Loewenstein, & Prelec, 2012). Both practices have undesirable consequences for the credibility and replicability of published results in psychological journals.
A simple solution to the problem would be to increase the statistical power of studies. If the power of psychological studies in psychology were over 90%, a success rate of 90% would be justified by the actual probability of obtaining significant results. However, meta-analysis and method articles have repeatedly pointed out that psychologists do not consider statistical power in the planning of their studies and that studies continue to be underpowered (Maxwell, 2004; Schimmack, 2012; Sedlmeier & Giegerenzer, 1989).
One reason for the persistent neglect of power could be that researchers have no awareness of the typical power of their studies. This could happen because observed power in a single study is an imperfect indicator of true power (Yuan & Maxwell, 2005). If a study produced a significant result, the observed power is at least 50%, even if the true power is only 30%. Even if the null-hypothesis is true, and researchers publish only type-I errors, observed power is dramatically inflated to 62%, when the true power is only 5% (the type-I error rate). Thus, Cohen’s estimate of 60% power is not very reassuring.
Over the past years, Schimmack and Brunner have developed a method to estimate power for sets of studies with heterogeneous designs, sample sizes, and effect sizes. A technical report is in preparation. The basic logic of this approach is to convert results of all statistical tests into z-scores using the one-tailed p-value of a statistical test. The z-scores provide a common metric for observed statistical results. The standard normal distribution predicts the distribution of observed z-scores for a fixed value of true power. However, for heterogeneous sets of studies the distribution of z-scores is a mixture of standard normal distributions with different weights attached to various power values. To illustrate this method, the histograms of z-scores below show simulated data with 10,000 observations with varying levels of true power: 20% null-hypotheses being true (5% power), 20% of studies with 33% power, 20% of studies with 50% power, 20% of studies with 66% power, and 20% of studies with 80% power.
The plot shows the distribution of absolute z-scores (there are no negative effect sizes). The plot is limited to z-scores below 6 (N = 99,985 out of 10,000). Z-scores above 6 standard deviations from zero are extremely unlikely to occur by chance. Even with a conservative estimate of effect size (lower bound of 95% confidence interval), observed power is well above 99%. Moreover, quantum physics uses Z = 5 as a criterion to claim success (e.g., discovery of Higgs-Boson Particle). Thus, Z-scores above 6 can be expected to be highly replicable effects.
Z-scores below 1.96 (the vertical dotted red line) are not significant for the standard criterion of (p < .05, two-tailed). These values are excluded from the calculation of power because these results are either not reported or not interpreted as evidence for an effect. It is still important to realize that true power of all experiments would be lower if these studies were included because many of the non-significant results are produced by studies with 33% power. These non-significant results create two problems. Researchers wasted resources on studies with inconclusive results and readers may be tempted to misinterpret these results as evidence that an effect does not exist (e.g., a drug does not have side effects) when an effect is actually present. In practice, it is difficult to estimate power for non-significant results because the size of the file-drawer is difficult to estimate.
It is possible to estimate power for any range of z-scores, but I prefer the range of z-scores from 2 (just significant) to 4. A z-score of 4 has a 95% confidence interval that ranges from 2 to 6. Thus, even if the observed effect size is inflated, there is still a high chance that a replication study would produce a significant result (Z > 2). Thus, all z-scores greater than 4 can be treated as cases with 100% power. The plot also shows that conclusions are unlikely to change by using a wider range of z-scores because most of the significant results correspond to z-scores between 2 and 4 (89%).
The typical power of studies is estimated based on the distribution of z-scores between 2 and 4. A steep decrease from left to right suggests low power. A steep increase suggests high power. If the peak (mode) of the distribution were centered over Z = 2.8, the data would conform to Cohen’s recommendation to have 80% power.
Using the known distribution of power to estimate power in the critical range gives a power estimate of 61%. A simpler model that assumes a fixed power value for all studies produces a slightly inflated estimate of 63%. Although the heterogeneous model is correct, the plot shows that the homogeneous model provides a reasonable approximation when estimates are limited to a narrow range of Z-scores. Thus, I used the homogeneous model to estimate the typical power of significant results reported in psychological journals.
DATA
The results presented below are based on an ongoing project that examines power in psychological journals (see results section for the list of journals included so far). The set of journals does not include journals that primarily publish reviews and meta-analysis or clinical and applied journals. The data analysis is limited to the years from 2009 to 2015 to provide information about the typical power in contemporary research. Results regarding historic trends will be reported in a forthcoming article.
I downloaded pdf files of all articles published in the selected journals and converted the pdf files to text files. I then extracted all t-tests and F-tests that were reported in the text of the results section searching for t(df) or F(df1,df2). All t and F statistics were converted into one-tailed p-values and then converted into z-scores.
The plot above shows the results based on 218,698 t and F tests reported between 2009 and 2015 in the selected psychology journals. Unlike the simulated data, the plot shows a steep drop for z-scores just below the threshold of significance (z = 1.96). This drop is due to the tendency not to publish or report non-significant results. The heterogeneous model uses the distribution of non-significant results to estimate the size of the file-drawer (unpublished non-significant results). However, for the present purpose the size of the file-drawer is irrelevant because power is estimated only for significant results for Z-scores between 2 and 4.
The green line shows the best fitting estimate for the homogeneous model. The red curve shows fit of the heterogeneous model. The heterogeneous model is doing a much better job at fitting the long tail of highly significant results, but for the critical interval of z-scores between 2 and 4, the two models provide similar estimates of power (55% homogeneous & 53% heterogeneous model). If the range is extended to z-scores between 2 and 6, power estimates diverge (82% homogenous, 61% heterogeneous). The plot indicates that the heterogeneous model fits the data better and that the 61% estimate is a better estimate of true power for significant results in this range. Thus, the results are in line with Cohen (1962) estimate that psychological studies average 60% power.
REPLICABILITY RANKING
The distribution of z-scores between 2 and 4 was used to estimate the average power separately for each journal. As power is the probability to obtain a significant result, this measure estimates the replicability of results published in a particular journal if researchers would reproduce the studies under identical conditions with the same sample size (exact replication). Thus, even though the selection criterion ensured that all tests produced a significant result (100% success rate), the replication rate is expected to be only about 50%, even if the replication studies successfully reproduce the conditions of the published studies. The table below shows the replicability ranking of the journals, the replicability score, and a grade. Journals are graded based on a scheme that is similar to grading schemes for undergraduate students (below 50 = F, 50-59 = E, 60-69 = D, 70-79 = C, 80-89 = B, 90+ = A).
The average value in 2000-2014 is 57 (D+). The average value in 2015 is 58 (D+). The correlation for the values in 2010-2014 and those in 2015 is r = .66. These findings show that the replicability scores are reliable and that journals differ systematically in the power of published studies.
LIMITATIONS
The main limitation of the method is that focuses on t and F-tests. The results might change when other statistics are included in the analysis. The next goal is to incorporate correlations and regression coefficients.
The second limitation is that the analysis does not discriminate between primary hypothesis tests and secondary analyses. For example, an article may find a significant main effect for gender, but the critical test is whether gender interacts with an experimental manipulation. It is possible that some journals have lower scores because they report more secondary analyses with lower power. To address this issue, it will be necessary to code articles in terms of the importance of statistical test.
The ranking for 2015 is based on the currently available data and may change when more data become available. Readers should also avoid interpreting small differences in replicability scores as these scores are likely to fluctuate. However, the strong correlation over time suggests that there are meaningful differences in the replicability and credibility of published results across journals.
CONCLUSION
This article provides objective information about the replicability of published findings in psychology journals. None of the journals reaches Cohen’s recommended level of 80% replicability. Average replicability is just about 50%. This finding is largely consistent with Cohen’s analysis of power over 50 years ago. The publication of the first replicability analysis by journal should provide an incentive to editors to increase the reputation of their journal by paying more attention to the quality of the published data. In this regard, it is noteworthy that replicability scores diverge from traditional indicators of journal prestige such as impact factors. Ideally, the impact of an empirical article should be aligned with the replicability of the empirical results. Thus, the replicability index may also help researchers to base their own research on credible results that are published in journals with a high replicability score and to avoid incredible results that are published in journals with a low replicability score. Ultimately, I can only hope that journals will start competing with each other for a top spot in the replicability rankings and as a by-product increase the replicability of published findings and the credibility of psychological science.