Concerns about research credibility have stimulated the growth of meta-science, a field that examines the reproducibility, robustness, and replicability of scientific findings (Ioannidis, 2005; Munafò et al., 2017). This literature has documented publication bias, low statistical power, inflated effect size estimates, and disappointing replication rates in some areas of research (Button et al., 2013; Ioannidis, 2005; Open Science Collaboration, 2015; Tyner et al., 2026). While initial studies focused on psychology and neuroscience, but a recent article suggested that the problems are more general. Tyner et al. (2026) reported that only about 50% of originally significant claims were successfully replicated.
A replication rate of 50% invites different interpretations. An optimistic interpretation is that most original studies detected effects in the correct direction, but that the average probability of obtaining another significant result in a new sample was only about 50%. In this scenario, selective publication of significant results inflates observed effect sizes, so replication studies often fail even when the original studies were not false positives. Many of the failures are therefore false negatives. A pessimistic interpretation is that many original results were false positives, whereas the remaining studies examined true effects with high power. In that case, the same 50% replication rate could arise from a mixture of null effects and highly powered true effects. Thus, the average replication rate alone is consistent with very different underlying realities.
To move beyond average replication rates, it is necessary to avoid reducing results to a dichotomy of significant versus non-significant. A cutoff at z = 1.96 is useful for decision making, but it discards quantitative information about the strength of evidence. A result with z = 6 provides much stronger evidence for a positive effect than a result with z = 2, just as z = -6 provides much stronger evidence for a negative effect than z = -2. This point is straightforward, but broad evaluations of replication outcomes have largely ignored differences in original evidential strength.
I used z-curve to examine heterogeneity in the strength of evidence across the original significant findings included in the two large replication projects (Brunner & Schimmack, 2020; Bartoš & Schimmack, 2022). Z-curve uses the distribution of significant z-values and corrects for the inflation in observed test statistics introduced by selection for significance. It provides two key estimates. The first is the Expected Replication Rate (ERR), which is the average probability that a significant result would be significant again in an exact replication with a new sample of the same size. The second is the Expected Discovery Rate (EDR), which is the estimated proportion of all studies, including unpublished non-significant ones, that would be expected to yield a significant result.
The EDR can be used to evaluate publication bias and to derive an upper bound on the false discovery rate using Sorić’s (1989) formula. Performance of z-curve has been examined in extensive simulation studies, which show that its 95% confidence intervals perform well when at least 100 significant results are available (Bartoš & Schimmack, 2022). Because z-curve is designed to accommodate heterogeneity in evidential strength, it is especially suitable for a diverse set of studies such as those included in the replication projects. Previous applications have shown substantial variation in ERR and EDR across research areas (Schimmack, 2020; Schimmack & Bartoš, 2023; Soto & Schimmack, 2024; Credé & Sotola, 2024; Sotola, 2022, 2024).”One limitation of previous applications is that they sometimes relied on automatically extracted p-values or focused on specific literatures. The replication projects provide gold-standard test statistics from a representative sample of social science research, avoiding both concerns. This makes it possible to examine heterogeneity in replicability across a broad range of research areas.
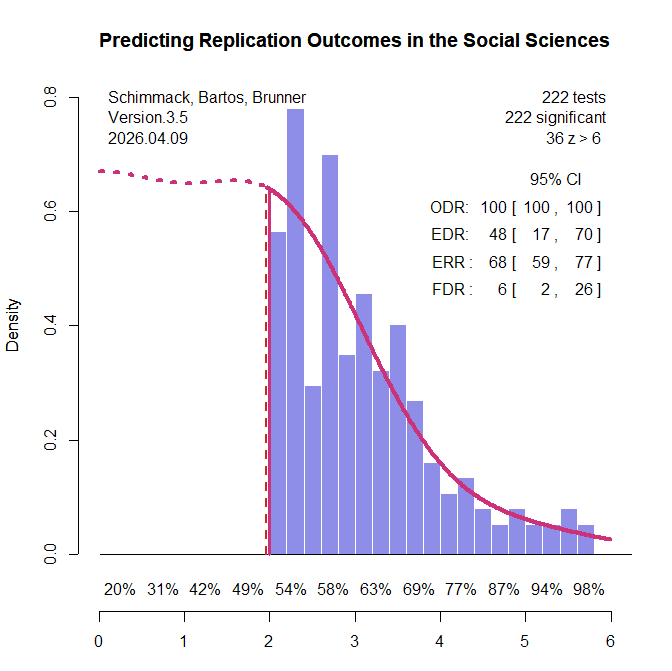
All original studies in the two replication projects were eligible for inclusion. For articles with multiple claims, the focal claim was identified from the abstract using a large language model (see OSF for details and cross-validation). When exact p-values were not reported in the project materials, the original articles were consulted to recover the necessary information. Articles without exact p-values were excluded. Original studies that claimed an effect without meeting the conventional significance threshold of p < .05 were also excluded. A small number of studies were further excluded because the replication reports did not provide sufficient information to evaluate the replication outcome. This screening process yielded k = 222 significant results (k1 = 88, k2 = 134), including k = 130 from psychology and k = 92 from other social sciences. The replication rate in this subset was similar to that in the full set of studies: 43% overall (project 1: 33%, project 2: 49%; psychology: 37%; other social sciences: 51%; see OSF for details). Figure 1 shows the z-curve analysis of these 222 original significant results.
The most striking result is that the expected replication rate (ERR) is substantially higher than the observed replication rate in the replication studies (68% versus 42%). Even the lower bound of the 95% confidence interval for the ERR, 59%, exceeds the observed replication rate. This discrepancy is especially noteworthy because the replication studies often used larger sample sizes than the original studies, which should have increased, not decreased, the probability of obtaining a significant result. Thus, the lower effect sizes observed in the replication studies cannot be attributed to regression to the mean alone. An additional factor appears to be that population effect sizes in the replication studies were systematically smaller than in the original studies.
Z-curve also limits the range of scenarios that are compatible with the data. The estimated EDR of 48% implies that no more than 6% of the significant results can be false positive results (Soric, 1989). Even the lower limit of the EDR confidence interval, 17%, limits the false positive rate to no more than 26%. With 50% replication failures, this suggests that no more than half of the replication failures are false positives. This finding shows the importance of distinguishing clearly between replication rates and false positive rates (Maxwell et al., 2015).
The false positive risk also varies as a function of the significance criterion. Marginally significant results are more likely to be false positives than results with high z-values (Benjamin et al., 2018). Z-curve makes it possible to address Benjamini and Hechtlinger’s (2014) call to control, rather than merely estimate, the science-wise false discovery rate. A stricter alpha criterion reduces the discovery rate, but it reduces the false discovery rate more. Benjamin et al. (2018) suggested reducing the false positive risk by lowering the significance criterion to alpha = .005. A z-curve analysis with this criterion estimated the FDR at 2% and the upper limit of the 95% CI was 6%. This finding provides empirical support for Benjamin et al.’s (2018) suggestion. It also addresses Lakens et al.’s (2018) concern that alpha levels should be justified. Here the strength of evidence provides the justification. In other literatures, alpha = .01 is sufficient to keep the FDR below 5% (Schimmack & Bartoš, 2023; Soto & Schimmack, 2024), but sometimes even alpha = .001 is insufficient to control false positives (Chen et al., 2025; Schimmack, 2025).
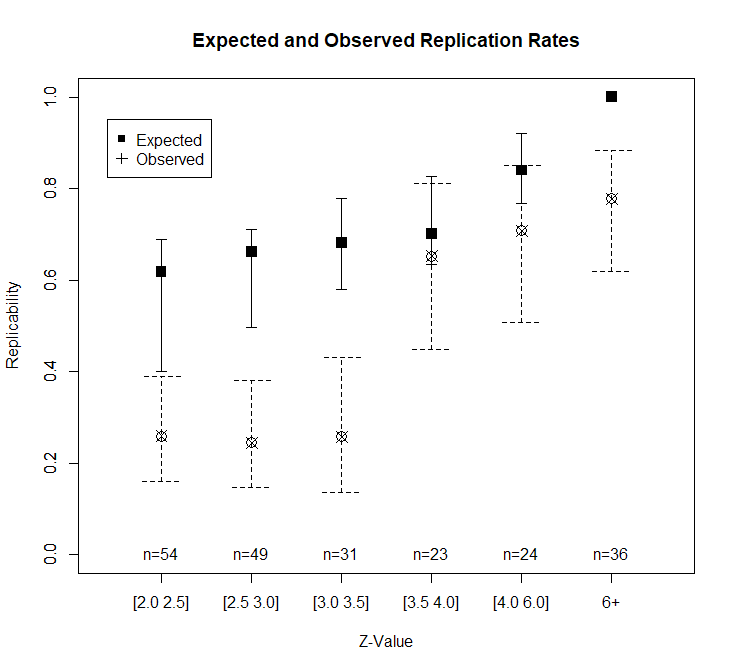
Heterogeneity in strength of evidence also makes it possible to predict replication outcomes as a function of z-values. Figure 1 shows power for z-value intervals below the x-axis. Expected replication rates increase from 54% for just significant results to over 90% for z-values greater than 5. Another 36 z-values have z-values greater than 6 that are practically guaranteed to replicate in exact replication studies. Figure 2 shows the expected replication rates and the observed replication rates for z-value ranges.
Studies with modest evidence (z = 2 to 3.5) replicate at significantly lower rates than expected based on z-curve. As expected, replication rates increase with stronger evidence. Given the small number of observations per bin, it is not possible to test whether z-curve predictions remain too optimistic at moderate z-values. The most surprising finding is that observed replication rates for studies with strong evidence (z > 6) fall below the expected rate.
In exploratory analyses, I examined possible reasons for these surprising replication failures. I used two large language models (ChatGPT and Claude) to score the replication reports of studies with strong original evidence (z > 6). Studies were coded on five dimensions (match of populations, materials, design, time period, and implementation) with scores from 0 to 2 each to produce total scores ranging from 0 to 10. Inter-rater agreement for the total scores was high, ICC(A,1) = .85, 95%CI = .73, .92. I averaged the two scores and used a total of 7 or higher as the criterion for a close match. Of the 24 close replications, 21 were successful (88%). Of the 12 studies that were not close replications, only 6 were successful (50%).
I further examined the three close replications that failed. While Farris et al. (2008) closely matched the original in many aspects, the original participants were from the US and the replication was conducted in the UK. Subsequent studies have replicated the finding with US samples (Farris et al., 2009/2010; Treat et al., 2017), ruling out a simple false positive explanation. The replication failure of Hurst and Kavanagh (2017) likely reflects a sampling problem in the original study. Participants from the general population and users of community mental health services were analyzed in a single analysis, which can inflate effect sizes (Preacher et al., 2005). McDevitt examined the influence of plumbing business names starting with numbers or A to be first in the yellow pages. A replication in 2020 cannot reproduce this effect because google searches replaced yellow pages.
While these exploratory results are based on a small sample, they support the broader claim that original results with strong evidence (z > 6) are likely to replicate in close replications and that failures may stem from meaningful differences in study design.
Conclusion
Z-curve analysis of two major replication projects reveals that replicability in the social sciences is not a single number. The expected replication rate based on the strength of original evidence (68%) substantially exceeds the observed replication rate (42%), indicating that effect size shrinkage beyond statistical regression to the mean contributes to replication failures. The false discovery rate is low (6%), confirming that most replication failures reflect reduced effect sizes rather than false positives. Adjusting the significance criterion to alpha = .005 reduces the estimated false discovery rate to 2%.
The most practically useful finding is that original results with strong evidence (z > 6) are highly replicable when the replication closely matches the original study design (88% success rate). Replication failures among these strong results were attributable to identifiable differences between the original and replication studies — different populations, changed market conditions, or heterogeneous samples. This suggests that the strength of statistical evidence, combined with methodological similarity, is a reliable predictor of replication success.
These findings argue against treating all significant results as equally credible and against interpreting average replication rates as informative about any particular study. Replicability is predictable from information already available in the original publication.
Harmon-Jones, E., Harmon-Jones, C., Amodio, D. M., Gable, P. A., & Schmeichel, B. J. (2025). Valid replications require valid methods: Recommendations for best methodological practices with lab experiments. Motivation Science, 11(3), 235–245
“Far from over.” (Frank Wang, tennis buddy when he is down 2:5)
The replication crisis shook social psychology in the 2010s. Heated debates—often on social media—divided critics, reformers, and defenders of the published record. The heat has cooled, but the crisis is far from over. The central empirical problems remain: unusually high rates of statistically significant results in journals, implausible success rates given typical power, and repeated failures to reproduce headline findings under rigorous conditions.
A striking pattern in parts of the methodological commentary that followed is explanatory asymmetry. Replication failures are readily attributed to contextual factors, subtle procedural differences, or “messy methods,” while the same standards are not applied with equal force to original studies. If minor contextual differences can wipe out an effect, then original results should also be unstable—yet the published record historically looks unnaturally successful. Any account that explains failure must also explain success.
There is also an ironic subtext: some of the strongest defenses of fragile effects come from researchers who study motivation and bias, yet methodological narratives can display their own motivated reasoning—favoring interpretations that protect prior conclusions. None of this requires imputing bad faith. It is enough to recognize that professional stakes and identity can shape what kinds of explanations feel plausible.
To avoid my own biases, I asked ChatGPT to evaluate bias in this article. More importantly, ChatGPT also provided an explanation for the rating.
Bias Evaluation
Harmon-Jones et al. (2025) argue that many replication failures in motivation and emotion research arise not from invalid theories or false positives, but from “messy methods.” They provide extensive practical recommendations regarding laboratory setup, experimenter behavior, manipulation strength, measurement sensitivity, replication design, data management, and statistical interpretation. The article is methodologically rich and offers useful guidance for improving internal validity in lab experiments.
However, when situated within the broader replication debate, the paper exhibits a consistent asymmetry in explanatory framing. On a scale from –10 (strongly defensive of existing literature) to +10 (strongly skeptical that most results are true), this article falls around –4 to –5: moderately biased in defense of established findings.
The basis for this rating is outlined below.
Core Contribution: Internal Validity Matters
The article’s strongest contribution is its detailed emphasis on internal validity. The authors correctly note that laboratory experiments are sensitive systems in which:
Subtle environmental cues may influence participant motivation.
Experimenter demeanor and appearance can affect outcomes.
Manipulations must be strong and construct-valid.
Dependent variables must be sensitive and properly timed.
Multilab projects introduce coordination risk.
Data handling errors can contaminate results.
These are real methodological concerns. The paper provides concrete, experience-based guidance that would likely improve experimental rigor if widely adopted. It is especially valuable as a practical resource for researchers conducting lab-based motivation studies.
Asymmetry in Causal Attribution
The principal concern is not methodological advice but explanatory direction.
Replication failures are repeatedly attributed to:
Context sensitivity
Weak or improperly implemented manipulations
Insensitive measures
Experimenter variability
Procedural deviations in multilab collaborations
Data management errors
These are legitimate explanations in some cases. However, the article does not apply equivalent scrutiny to original studies.
There is little engagement with:
Publication bias
Inflated effect sizes
Researcher degrees of freedom
Selective reporting
Power deficiencies in original work
Theory elasticity
The explanatory burden for null replications is placed largely on replication implementation rather than on possible inflation or fragility in the original literature.
This directional asymmetry is what produces the defensive tilt.
Context Sensitivity as a Buffer
The authors cite contextual sensitivity as a key explanation for replication variability. Conceptually, psychological effects can depend on time, culture, and population. However, the article treats contextual sensitivity as supporting evidence for interpreting replication failures, without addressing debate over the empirical robustness of this claim.
More importantly, the paper does not quantify how strong contextual sensitivity would need to be to account for large-scale null findings in well-powered, preregistered, multilab studies. If minor environmental differences are sufficient to eliminate effects, then those effects are fragile by definition. That implication is not confronted directly.
Treatment of Ego Depletion
The article references the large preregistered multisite ego-depletion test (Vohs et al., 2021), which included proponents of the theory. Rather than interpreting the null results as evidence about true effect size, the authors emphasize coordination errors and deviations across labs.
While procedural complications can occur, the study was high-powered and preregistered. A pattern of near-zero effects across many sites cannot be explained solely by minor procedural noise without implying extreme fragility.
The possibility that the true effect is very small or nonexistent is not seriously engaged. This reinforces the asymmetry in explanatory weighting.
The “Psychological Sledgehammer” Standard
The recommendation that manipulations should function like a “psychological sledgehammer” raises an additional issue. If only very strong manipulations count as valid tests, then many real-world operationalizations will be deemed insufficient. This narrows the acceptable domain of theory testing and increases the probability that null findings are attributed to weakness of implementation rather than limitations of theory.
That standard shifts the evidentiary burden in a way that implicitly protects established effects.
The Excess Success Gap
A major omission concerns the historically high rate of statistically significant findings in psychology journals—often described as exceeding 90%.
If effects are highly context-sensitive and fragile, then original studies should also frequently fail. Minor variations in lab setup, experimenter behavior, and measurement sensitivity would generate many null outcomes. Yet the published literature overwhelmingly reports positive results.
These two claims cannot comfortably coexist without additional explanation.
There are only a few ways to reconcile fragile effects with excess success:
Many effects are actually robust and high-powered.
Publication bias and selective reporting filter out null results.
Researchers iteratively tune operationalizations and analyses until significance is obtained.
The article does not engage this macro-level constraint. It does not integrate publication bias or excess-success analysis into its explanatory framework. As a result, replication failures are treated as methodologically suspect, while the structural inflation of original literatures remains largely unaddressed.
This omission materially strengthens the case for a defensive bias rating.
What Prevents a More Extreme Rating
Despite these concerns, the article does not:
Deny p-hacking or questionable practices.
Reject replication as essential.
Claim that all replication failures are invalid.
Dismiss preregistration.
Attack statistical reform movements.
It offers constructive methodological advice and acknowledges complexity in statistical inference. The tilt is moderate, not extreme.
Overall Assessment
Harmon-Jones et al. provide valuable, concrete guidance on improving internal validity in laboratory research. Their emphasis on methodological nuance is important and often neglected in replication debates.
However, the paper consistently places greater explanatory weight on replication imperfections than on possible inflation or fragility in original findings. It does not reconcile its fragility narrative with the excess success of published psychology, nor does it engage deeply with quantitative evidence regarding effect size shrinkage and false discovery rates.
For these reasons, the article can be fairly characterized as moderately biased in defense of existing literature — approximately –4 to –5 on a –10 to +10 scale.
P.S. Why my bias rating would be more extreme
The most important cue for bias is that success rates over 90% in psychology journals have been documented repeatedly since Sterling (1959). Any article that avoids talking about this implausible result that undermines the meaning of statistical significance is often biased and downplays the amount of selection bias in psychology. Insiders know that only significant results can be published. This unscientific incentive structure is the root cause of the replication crisis, not contextual sensitivity. Failure to mention Sterling is a red flag.
The second red flag is the citation of van Bavel as a reference to contextual sensitivity. Van Bavel claimed to have shown that contextual sensitivity explains the lower replication rate in social psychology. However, Inbar showed that they did not present the critical tests of an interaction and that this test was not significant. There is no evidence that contextual sensitivity contributes to low success rates in social psychology. Rather, social psychologists never ran direct replications and used contextual sensitivity as a way to protect their theories from disconfirming evidence. Change something trivial and you get significance again: great, the effect is robust. If not, clearly the effect was real before but not in this context. Now publish only the significant results and claim that the theory is universally true across time, place, and populations. This is how it was done, and it was wrong. Sadly, some social psychologists cannot just say, sorry, we messed up, now let’s move on.
2.17.2020 [the blog post has been revised after I received reviews of the ms. The reference list has been expanded to include all major viewpoints and influential articles. If you find something important missing, please let me know.]
7.2.2020 [the blog post has been edited to match the print version behind the paywall]
You can email me to request a copy of the printed article (replicabilityindex@gmail.com)
Citation: Schimmack, U. (2020). A meta-psychological perspective on the decade of replication failures in social psychology. Canadian Psychology/Psychologie canadienne. Advance online publication. https://doi.org/10.1037/cap0000246
Abstract
Bem’s (2011) article triggered a string of replication failures in social psychology. A major replication project found that only 25% of results in social psychology could be replicated. I examine various explanations for this low replication rate and found most of them lacking in empirical support. I then provide evidence that the use of questionable research practices accounts for this result. Using z-curve and a representative sample of focal hypothesis tests, I find that the expected replication rate for social psychology is between 20% and 45%. I argue that quantifying replicability can provide an incentive to use good research practices and to invest more resources in studies that produce replicable results. The replication crisis in social psychology provides important lessons for other disciplines in psychology that have avoided to take a closer look at their research practices.
Keywords: Replication, Replicability, Replicability Crisis, Expected Replication Rate, Expected Discovery Rate, Questionable Research Practices, Power, Social Psychology
Article
The 2010s started with a bang. Journal clubs were discussing the preprint of Bem’s (2011) article “Feeling the Future: Experimental Evidence for Anomalous Retroactive Influences on Cognition and Affect.” Psychologists were confronted with a choice. Either they had to believe in anomalous effects or they had to believe that psychology was an anomalous science. Ten years later, it is pos- sible to look back at Bem’s article with the hindsight of 2020. It is now clear that Bem used questionable practices to produce false evidence for his outlandish claims (Francis, 2012; Schim- mack, 2012, 2018b, 2020). Moreover, it has become apparent that these practices were the norm and that many other findings in social psychology cannot be replicated. This realisation has led to initiatives to change research practices that produce more credible and replicable results. The speed and the extent of these changes has been revolutionary. Akin to the cognitive revolution in the 1960s and the affective revolution in the 1980s, the 2010s have witnessed a method revolution. Two new journals were created that focus on methodological problems and improvements of research practices: Meta-Psychology and Advances in Methods and Practices in Psychological Science.
In my review of the method revolution, I focus on replication failures in experimental social psychology and the different explanations for these failures. I argue that the use of questionable research practices accounts for many replication failures, and I examine how social psychologists have responded to evidence that questionable research practices (QRPs) undermine the trustworthiness of social psychological results. Other disciplines may learn from these lessons and may need to reform their research practices in the coming decade.
Replication Crisis
Arguably, the most important development in psychology has been the publication of replication failures. When Bem (2011) published his abnormal results supporting paranormal phenomena, researchers quickly failed to replicate these sensational results. However, they had a hard time publishing these results. The editor of the journal that published Bem’s findings, the Journal of Personality and Social Psychology (JPSP), did not even send the article out for review. This attempt to suppress negative evidence failed for two reasons. First, online-only journals with unlimited journal space like PLoSOne or Frontiers were willing to publish null results (Ritchie, Wiseman, & French, 2012). Second, the decision to reject the replication studies was made public and created a lot of attention because Bem’s article had attracted so much attention (Aldhous, 2011). In response to social pressure, JPSP did publish a massive replication failure of Bem’s results (Galak, LeBoeuf, Nelson, & Simmons, 2012).
Over the past decade, new article formats have evolved that make it easier to publish results that fail to confirm theoretical predictions such as registered reports (Chambers, 2013) and registered replication reports (Association for Psychological Science, 2015). Registered reports are articles that are accepted for publication before the results are known, thus avoiding the problem of publishing only confirmatory findings. Scheel, Schijen, and Lakens (2020) found that this format reduced the rate of significant results from over 90% to about 50%. This difference suggests that the normal literature has a strong bias to publish significant results (Bakker, van Dijk, & Wicherts, 2012; Sterling, 1959; Sterling, Rosenbaum, & Weinkam, 1995).
Registered replication reports are registered reports that aim to replicate an original study in a high-powered study with many laboratories. Most registered replication reports have produced replication failures (Kvarven, Strømland, & Johannesson, 2020). These failures are especially stunning because registered replication reports have a much higher chance to produce a significant result than the original studies with much smaller samples. Thus, the failure to replicate ego depletion (Hagger et al., 2016) or facial feedback (Acosta et al., 2016) effects was shocking.
Replication failures of specific studies are important for specific theories, but they do not examine the crucial question of whether these failures are anomalies or symptomatic of a wider problem in psychological science. Answering this broader question requires a representative sample of studies from the population of results published in psychology journals. Given the diversity of psychology, this is a monumental task.
A first step toward this goal was the Reproducibility Project that focused on results published in three psychology journals in the year 2008. The journals represented social/personality psychology (JPSP), cognitive psychology (Journal of Experimental Psychology: Learning, Memory, and Cognition), and all areas of psychology (Psychological Science). Although all articles published in 2008 were eligible, not all studies were replicated, in part because some studies were very expensive or difficult to replicate. In the end, 97 studies with significant results were replicated. The headline finding was that only 37% of the replication studies replicated a statistically significant result.
This finding has been widely cited as evidence that psychology has a replication problem. However, headlines tend to blur over the fact that results varied as a function of discipline. While the success rate for cognitive psychology was 50% and even higher for within-subject designs with many observations per participant, the success rate was only 25% for social psychology and even lower for the typical between-subjects design that was employed to study ego depletion, facial feedback, or other prominent topics in social psychology.
These results do not warrant the broad claim that psychology has a replication crisis or that most results published in psychology are false. A more nuanced conclusion is that social psychology has a replication crisis and that methodological factors account for these differences. Disciplines that use designs with low statistical power are more likely to have a replication crisis.
To conclude, the 2010s have seen a rise in publications of nonsignificant results that fail to replicate original results and that contradict theoretical predictions. The replicability of published results is particularly low in social psychology.
Responses to the Replication Crisis in Social Psychology
There have been numerous responses to the replication crisis in social psychology. Broadly, they can be classified as arguments that support the notion of a crisis and arguments that claim that there is no crisis. I first discuss problems with no-crisis arguments. I then examine the pro-crisis arguments and discuss their implications for the future of psychology as a science.
No Crisis: Downplaying the Finding
Some social psychologists have argued that the term crisis is inappropriate and overly dramatic. “Every generation or so, social psychologists seem to enjoy experiencing a ‘crisis.’ While sympathetic to the underlying intentions underlying these episodes— first the field’s relevance, then the field’s methodological and statistical rigor—the term crisis seems to me overly dramatic. Placed in a positive light, social psychology’s presumed ‘crises’ actually marked advances in the discipline” (Pettigrew, 2018, p. 963). Others use euphemistic and vague descriptions of the low replication rate in social psychology. For example, Fiske (2017) notes that “like other sciences, not all our effects replicate” (p. 654). Crandall and Sherman (2016) note that the number of successful replications in social psychology was “at a lower rate than expected” (p. 94).
These comments downplay the stunning finding that only 25% of social psychology results could be replicated. Rather than admitting that there is a problem, these social psychologists find fault with critics of social psychology. “I have been proud of the professional stance of social psychology throughout my long career. But unrefereed blogs and social media attacks sent to thou- sands can undermine the professionalism of the discipline” (Pettigrew, 2018, p. 967). I would argue that lecturing thousands of students each year based on evidence that is not replicable is a bigger problem than talking openly about the low replicability of social psychology on social media.
No Crisis: Experts Can Reliably Produce Effects
After some influential priming results could not be replicated, Daniel Kahneman wrote a letter to John Bargh and suggested that leading priming researchers should conduct a series of replication studies to demonstrate that their original results are replicable (Yong, 2012). In response, Bargh and other prominent social psychologists conducted numerous studies that showed the effects are robust. At least, this is what might have happened in an alternate universe. In this universe, there have been few attempts to self-replicate original findings. Bartlett (2013) asked Bargh why he did not prove his critics wrong by doing the study again. “So why not do an actual examination? Set up the same experiments again, with additional safeguards. It wouldn’t be terribly costly. No need for a grant to get undergraduates to unscramble sentences and stroll down a hallway” (Bartlett, 2013).
Bargh’s answer is not very convincing. “Bargh says he wouldn’t want to force his graduate students, already worried about their job prospects, to spend time on research that carries a stigma. Also, he is aware that some critics believe he’s been pulling tricks, that he has a ‘special touch’ when it comes to priming, a comment that sounds like a compliment but isn’t. ‘I don’t think anyone would believe me,’ he says” (Bartlett, 2013).
One self-replication ended with a replication failure (Elkins- Brown, Saunders, & Inzlicht, 2018). One notable successful self- replication was conducted by Petty and colleagues (Luttrell, Petty, & Xu, 2017), after a replication study by Ebersole et al. (2016) failed to replicate a seminal finding by Cacioppo, Petty, and Morris (1983) that need for cognition moderates the effect of argument strength on attitudes. Luttrell et al. (2017) were able to replicated the original finding by Cacioppo et al., and they repro- duced the nonsignificant result of Ebersole et al.’s replication study. In addition, they found a significant interaction with exper- imental design, indicating that procedural differences made the effect weaker in Ebersole et al.’s replication study. This study has been celebrated as an exemplary way to respond to replication failures. It also suggests that flaws in replication studies are some- times responsible for replication failures. However, it is impossible to generalise from this single instance to other replication failures. Thus, it remains unclear how many replication failures were caused by problems with the replication studies.
No Crisis: Decline Effect
The idea that replication failures occur because effects weaken over time was proposed by Johnathan Schooler and popularized in a New Yorker article (Lehrer, 2010). Schooler coined the term decline effect for the observation that effect sizes often decrease over time. Unfortunately, it does not work for more mundane behaviours like eating cheesecake. No matter how often you eat cheesecakes, they still add pounds to your weight. However, for effects in social psychology, it seems to be the case that it is easier to discover effects than to replicate them (Wegner, 1992). This is also true for Schooler and Engstler-Schooler’s (1990) verbal over- shadowing effect. A registered replication report replicated a statistically significant effect but with smaller effect sizes (Alogna et al., 2014). Schooler (2014) considered this finding a win-win because his original results had been replicated, and the reduced effect size supported the presence of a decline effect. However, the notion of a decline effect is misleading because it merely describes a phenomenon rather than providing an explanation for it. Schooler (2014) offered several possible explanations. One possible explanation was regression to the mean (see next paragraph). A second explanation was that slight changes in experimental procedures can reduce effect sizes (more detailed discussion below). More controversial, Schooler also eludes to the possibility that some paranormal processes may produce a decline effect. “Perhaps, there are some parallels between VO [verbal overshadowing] effects and parapsychology after all, but they reflect genuine unappreciated mechanisms of nature (Schooler, 2011) and not simply the product of publication bias or other artifact” (p. 582). Schooler, however, fails to acknowledge that a mundane explanation for the decline effect involves questionable research practices that inflate effect size estimates in original studies. Using statistical tools, Francis (2012) showed that Schooler’s original verbal over-shadowing studies showed signs of bias. Thus, there is no need to look for paranormal explanation of the decline effect in verbal overshadowing. The normal practices of selectively publishing only significant results are sufficient to explain it. In sum, the decline effect is descriptive rather than explanatory, and Schooler’s suggestion that it reflects some paranormal phenomena is not supported by scientific evidence.
No Crisis: Regression to the Mean Is Normal
Regression to the mean has been invoked as one possible explanation for the decline effect (Fiedler, 2015; Schooler, 2014). Fiedler’s argument is that random measurement error in psycho- logical measures is sufficient to produce replication failures. How- ever, random measurement error is neither necessary nor sufficient to produce replication failures. The outcome of a replication study is determined solely by a study’s statistical power, and if the replication study is an exact replication of an original study, both studies have the same amount of random measurement error and power (Brunner & Schimmack, 2020). Thus, if the Open Science Collaboration (OSC) project found 97 significant results in 100 published studies, the observed discovery rate of 97% suggests that the studies had 97% power to obtain a significant result. Random measurement error would have the same effect on power in the replication studies. Thus, random measurement error cannot ex- plain why the replication studies produced only 37% significant results. Therefore, Fiedler’s claim that random measurement error alone explains replication failures is based on a misunderstanding of the phenomenon of regression to the mean.
Moreover, regression to the mean requires that studies were selected for significance. Schooler (2014) ignores this aspect of regression to the mean when he suggests that regression to the mean is normal and expected. It is not. The effect sizes of eating cheesecake do not decrease over time because there is no selection process. In contrast, the effect sizes of social psychological experiments decrease when original articles selected significant results and replication studies do not select for significance. Thus, it is not normal for success rates to decrease from 97% to 25%, just like it would not be normal for a basketball players’ free-throw percent- age to drop from 97% to 25%. In conclusion, regression to the mean implies that original studies were selected for significance and would suggest that replication failures are produced by questionable research practices. Regression to the mean therefore be- comes an argument why there is a crisis once it is recognized that it requires selective reporting of significant results, which leads to illusory success rates in psychology journals.
No Crisis: Exact Replications Are Impossible
Heraclitus, an ancient Greek philosopher, observed that you can never step into the same river twice. Similarly, it is impossible to exactly re-create the conditions of a psychological experiment. This trivial observation has been used to argue that replication failures are neither surprising nor problematic but rather the norm. We should never expect to get the same result from the same paradigm because the actual experiments are never identical, just like a river is always changing (Stroebe & Strack, 2014). This argument has led to a heated debate about the distinction and value of direct versus conceptual replication studies (Crandall & Sherman, 2016; Pashler & Harris, 2012; Zwaan, Etz, Lucas, & Donnellan, 2018).
The purpose of direct replication studies is to replicate an original study as closely as possible so that replication failures can correct false results in the literature (Pashler & Harris, 2012). However, journals were reluctant to publish replication failures. Thus, a direct replication had little value. Either the results were not significant or they were not novel. In contrast, conceptual replication studies were publishable as long as they produced a significant result. Thus, publication bias provides an explanation for many seemingly robust findings (Bem, 2011) that suddenly cannot be replicated (Galak et al., 2012). After all, it is simply not plausible that conceptual replications that intentionally change features of a study are always successful, while direct replications that try to reproduce the original conditions as closely as possible fail in large numbers.
The argument that exact replications are impossible also ignores the difference between disciplines. Why is there no replication crisis in cognitive psychology if each experiment is like a new river? And why does eating cheesecake always lead to a weight gain, no matter whether it is chocolate cheesecake, raspberry white-truffle cheesecake, or caramel fudge cheesecake? The reason is that the main features of rivers remain the same. Even if the river is not identical, you still get wet every time you step into it. To explain the higher replicability of results in cognitive psychology than in social psychology, Van Bavel, Mende-Siedlecki, Brady, and Reinero (2016) proposed that social psychological studies are more difficult to replicate for a number of reasons. They called this property of studies contextual sensitivity. Coding studies for contextual sensitivity showed the predicted negative correlation between contextual sensitivity and replicability. However, Inbar (2016) found that this correlation was no longer significant when discipline was included as a predictor. Thus, the results suggested that social psychological studies are more contextually sensitive and less replicable but that contextual sensitivity did not explain the lower replicability of social psychology.
It is also not clear that contextual sensitivity implies that social psychology does not have a crisis. Replicability is not the only criterion of good science, especially if exact replications are impossible. Findings that can only be replicated when conditions are reproduced exactly lack generalizability, which makes them rather useless for applications and for construction of broader theories. Take verbal overshadowing as an example. Even a small change in experimental procedures reduced a practically significant effect size of 16% to a no longer meaningful effect size of 4% (Alogna et al., 2014), and neither of these experimental conditions were similar to real-world situations of eyewitness identification. Thus, the practical implications of this phenomenon remain unclear because it depends too much on the specific context.
In conclusion, empirical results are only meaningful if research- ers have a clear understanding of the conditions that can produce a statistically significant result most of the time (Fisher, 1926). Contextual sensitivity makes it harder to do so. Thus, it is one potential factor that may contribute to the replication crisis in social psychology because social psychologists do not know under which conditions their results can be reproduced. For example, I asked Roy F. Baumeister to specify optimal conditions to replicate ego depletion. He was unable or unwilling to do so (Baumeister, 2016).
No Crisis: The Replication Studies Are Flawed
The argument that replication studies are flawed comes in two flavors. One argument is that replication studies are often carried out by young researchers with less experience and expertise. They did their best, but they are just not very good experimenters (Gilbert, King, Pettigrew, & Wilson, 2016). Cunningham and Baumeister (2016) proclaim, “Anyone who has served on university thesis committees can attest to the variability in the competence and commitment of new researchers. Nonetheless, a graduate committee may decide to accept weak and unsuccessful replication studies to fulfill degree requirements if the student appears to have learned from the mistakes” (p. 4). There is little evidence to support this claim. In fact, a meta-analysis found no differences in effect sizes between studies carried out by Baumeister’s lab and other labs (Hagger, Wood, Stiff, & Chatzisarantis, 2010).
The other argument is that replication failures are sexier and more attention grabbing than successful replications. Thus, replication researchers sabotage their studies or data analyses to produce nonsignificant results (Bryan, Yeager, & O’Brien, 2019; Strack, 2016). The latter accusations have been made without empirical evidence to support this claim. For example, Strack (2016) used a positive correlation between sample size and effect size to claim that some labs were motivated to produce nonsignificant results, presumably by using a smaller sample size. However, a proper bias analysis showed no evidence that there were too few significant results (Schimmack, 2018a). Moreover, the overall effect size across all labs was also nonsignificant.
Inadvertent problems, however, may explain some replication failures. For example, some replication studies reduced statistical power by replicating a study with a smaller sample than the original study (OSC, 2015; Ritchie et al., 2012). In this case, a replication failure could be a false negative (Type II error). Thus, it is problematic to conduct replication studies with smaller samples. At the same time, registered replication reports with thou- sands of participants should be given more weight than original studies with fewer than 100 participants. Size matters.
However, size is not the only factor that matters, and researchers disagree about the implications of replication failures. Not surpris- ingly, authors of the original studies typically recognise some problems with the replication attempts (Baumeister & Vohs, 2016; Strack, 2016; cf. Skibba, 2016). Ideally, researchers would agree ahead of time on a research design that is acceptable to all parties involved. Kahneman called this model an adversarial collaboration (Kahneman, 2003). However, original researchers have either not participated in the planning of a study (Strack, 2016) or withdrawn their approval after the negative results were known (Baumeister & Vohs, 2016). No author of an original study that failed to replicate has openly admitted that questionable research practices contributed to replication failures.
In conclusion, replication failures can occur for a number of reasons, just like significant results in original studies can occur for a number of reasons. Inconsistent results are frustrating because they often require further research. This being said, there is no evidence that low quality of replication studies is the sole or the main cause of replication failures in social psychology.
No Crisis: Replication Failures Are Normal
In an opinion piece for the New York Times, Lisa Feldmann Barrett, current president of the Association for Psychological Science, commented on the OSC results and claimed that “the failure to replicate is not a cause for alarm; in fact, it is a normal part of how science works” (Barrett, 2015). On the surface, Barrett makes a valid point. It is true that replication failures are a normal part of science. First, if psychologists would conduct studies with 80% power, one out of five studies would fail to replicate, even if everything is going well and all predictions are true. Second, replication failures are expected when researchers test risky hypotheses (e.g., effects of candidate genes on personality) that have a high probability of being false. In this case, a significant result may be a false-positive result and replication failures demonstrate that it was a false positive. Thus, honest reporting of replication failures plays an integral part in normal science, and the success rate of replication studies provides valuable information about the empirical support for a hypothesis. However, a success rate of 25% or less for social psychology is not a sign of normal science, especially when social psychology journals publish over 90% significant results (Motyl et al., 2017; Sterling, 1959; Sterling et al., 1995). This discrepancy suggests that the problem is not the low success rate in replication studies but the high success rate in psychology journals. If social psychologists tested risky hypotheses that have a high probability of being false, journals should report a lot of nonsignificant results, especially in articles that report multiple tests of the same hypothesis, but they do not (cf. Schimmack, 2012).
Crisis: Original Studies Are Not Credible Because They Used Null-Hypothesis Significance Testing
Bem’s anomalous results were published with a commentary by Wagenmakers, Wetzels, Borsboom, and van der Maas (2011). This commentary made various points that are discussed in more detail below, but one unique and salient point of Wagenmakers et al.’s comment concerned the use of null-hypothesis significance testing (NHST). Bem presented nine results with p values below .05 as evidence for ESP. Wagenmakers et al. object to the use of a significance criterion of .05 and argue that this criterion makes it too easy to publish false-positive results (see also Benjamin et al., 2016).
Wagenmakers et al. (2011) claimed that this problem can be avoided by using Bayes factors. When they used Bayes factors with default priors, several of Bem’s studies no longer showed evidence for ESP. Based on these findings, they argued that psychologists must change the way they analyse their data. Since then, Wagenmakers has worked tirelessly to promote Bayes factors as an alternative to NHST. However, Bayes factors have their own problems. The biggest problem is that they depend on the choice of a prior.
Bem, Utts, and Johnson (2011) pointed out that Wagenmakers et al.’s (2011) default prior assumed that there is a 50% probability that ESP works in the opposite direction (below chance accuracy) and a 25% probability that effect sizes are greater than one stan- dard deviation (Cohen’s d > 1). Only 25% of the prior distribution was allocated to effect sizes in the predicted direction between 0
No Crisis: Replication Failures Are Normal
In an opinion piece for the New York Times, Lisa Feldmann Barrett, current president of the Association for Psychological Science, commented on the OSC results and claimed that “the failure to replicate is not a cause for alarm; in fact, it is a normal part of how science works” (Barrett, 2015). On the surface, Barrett makes a valid point. It is true that replication failures are a normal part of science. First, if psychologists would conduct studies with 80% power, one out of five studies would fail to replicate, even if everything is going well and all predictions are true. Second, replication failures are expected when researchers test risky hy- potheses (e.g., effects of candidate genes on personality) that have a high probability of being false. In this case, a significant result may be a false-positive result and replication failures demonstrate that it was a false positive. Thus, honest reporting of replication failures plays an integral part in normal science, and the success rate of replication studies provides valuable information about the empirical support for a hypothesis. However, a success rate of 25% or less for social psychology is not a sign of normal science, especially when social psychology journals publish over 90% significant results (Motyl et al., 2017; Sterling, 1959; Sterling et al., 1995). This discrepancy suggests that the problem is not the low success rate in replication studies but the high success rate in psychology journals. If social psychologists tested risky hypothe- ses that have a high probability of being false, journals should report a lot of nonsignificant results, especially in articles that report multiple tests of the same hypothesis, but they do not (cf. Schimmack, 2012).
Crisis: Original Studies Are Not Credible Because They Used Null-Hypothesis Significance Testing
Bem’s anomalous results were published with a commentary by Wagenmakers, Wetzels, Borsboom, and van der Maas (2011). This commentary made various points that are discussed in more detail below, but one unique and salient point of Wagenmakers et al.’s comment concerned the use of null-hypothesis significance testing (NHST). Bem presented nine results with p values below .05 as evidence for extrasensory perception (ESP). Wagenmakers et al. object to the use of a significance criterion of .05 and argue that this criterion makes it too easy to publish false-positive results (see also Benjamin et al., 2016).
Wagenmakers et al. (2011) claimed that this problem can be avoided by using Bayes factors. When they used Bayes factors with default priors, several of Bem’s studies no longer showed evidence for ESP. Based on these findings, they argued that psychologists must change the way they analyse their data. Since then, Wagenmakers has worked tirelessly to promote Bayes factors as an alternative to NHST. However, Bayes factors have their own problems. The biggest problem is that they depend on the choice of a prior.
Bem, Utts, and Johnson (2011) pointed out that Wagenmakers et al.’s (2011) default prior assumed that there is a 50% probability that ESP works in the opposite direction (below chance accuracy) and a 25% probability that effect sizes are greater than one standard deviation (Cohen’s d > 1). Only 25% of the prior distribution was allocated to effect sizes in the predicted direction between 0 and 1. This prior makes no sense for research on ESP processes that are expected to produce small effects.
When Bem et al. (2011) specified a more reasonable prior, Bayes factors actually showed more evidence for ESP than NHST. Moreover, the results of individual studies are less important than the combined evidence across studies. A meta-analysis of Bem’s studies shows that even with the default prior, Bayes factors reject the null hypothesis with an odds ratio of 1 billion to 1. Thus, if we trust Bem’s data, Bayes factors also suggest that Bem’s results are robust, and it remains unclear why Galak et al. (2012) were unable to replicate Bem’s results.
Another argument in favour of Bayes-Factors is that NHST is one-sided. Significant results are used to reject the null-hypothesis, but nonsignificant results cannot be used to affirm the null- hypothesis. This makes nonsignificant results difficult to publish, which leads to publication bias. The claim is that Bayes factors solve this problem because they can provide evidence for the null hypothesis. However, this claim is false (Tendeiro & Kiers, 2019). Bayes factors are odds ratios between two alternative hypotheses. Unlike in NHST, these two competing hypotheses are not mutually exclusive. That is, an infinite number of additional hypotheses are not tested. Thus, if the data favour the null hypothesis, they do not provide support for the null hypothesis. They merely provide evidence against one specified alternative hypothesis. There is always another possible alternative hypothesis that fits the data better than the null hypothesis. As a result, even Bayes factors that strongly favour H0 fail to provide evidence that the true effect size is exactly zero.
The solution to this problem is not new but unfamiliar to many psychologists. To demonstrate the absence of an effect, it is necessary to specify a region of effect sizes around zero and to demonstrate that the population effect size is likely to be within this region. This can be achieved using NHST (equivalence tests; Lakens, Scheel, & Isager, 2018) or Bayesian statistics (Kruschke & Liddell, 2018). The main reason why psychologists are not familiar with tests that demonstrate the absence of an effect may be that typical sample sizes in psychology are too small to produce precise estimates of effect sizes that could justify the conclusion that the population effect size is too close to zero to be meaningful.
An even more radical approach was taken by the editors of Basic and Applied Social Psychology (Trafimow & Marks, 2015), who claimed that NHST is logically invalid (Trafimow, 2003). Based on this argument, the editors banned p values from publications, which solves the problem of replication failures because there are no formal inferential tests. However, authors continue to draw causal inferences that are in line with NHST but simply omit statements about p values. It is not clear that this cosmetic change in the presentation of results is a solution to the replication crisis.
In conclusion, Wagenmakers et al. and others have blamed the use of NHST for the replication crisis, but this criticism ignores the fact that cognitive psychology also uses NHST and does not suffer a replication crisis. The problem with Bem’s results was not the use of NHST but the use of questionable research practices to produce illusory evidence (Francis, 2012; Schimmack, 2012, 2018b, 2020).
Crisis: Original Studies Report Many False Positives
An influential article by Ioannidis (2005) claimed that most published research findings are false. This eye-catching claim has been cited thousands of times. Few citing authors have bothered to point out that the claim is entirely based on hypothetical scenarios rather than empirical evidence. In psychology, fear that most published results are false positives was stoked by Simmons, Nelson, and Simonsohn’s (2011) “False-Positive Psychology” ar- ticle that showed with simulation studies that the aggressive use of questionable research practices can dramatically increase the prob- ability that a study produces a significant result without a real effect. These articles shifted concerns about false negatives in the 1990s (e.g., Cohen, 1994) to concerns about false positives.
The problem with the current focus on false-positive results is that it implies that replication failures reveal false-positive results in original studies. This is not necessarily the case. There are two possible explanations for a replication failure. Either the original study had low power to show a true effect (the nil hypothesis is false) or the original study reported a false-positive result and the nil hypothesis is true. Replication failures do not distinguish be- tween true and false nil hypothesis, but they are often falsely interpreted as if replication failures reveal that the original hypothesis was wrong. For example, Nelson, Simmons, and Simonsohn (2018) write, “Experimental psychologists spent several decades relying on methods of data collection and analysis that make it too easy to publish false-positive, nonreplicable results. During that time, it was impossible to distinguish between findings that are true and replicable and those that are false and not replicable” (p. 512). This statement ignores that results can be true but difficult to replicate and that the nil hypothesis is often unlikely to be true.
The false assumption that replication failures reveal false- positive results has created a lot of confusion in the interpretation of replication failures (Maxwell, Lau, & Howard, 2015). For example, Gilbert et al. (2016) attribute the low replication rate in the reproducibility project to low power of the replication studies. This does not make sense when the replication studies had the same or sometimes even larger sample sizes than the original studies. As a result, the replication studies had as much or more power than the original studies. So, how could low power explain that discrepancy between the 97% success rate in original studies and the 25% success rate in replication studies? It cannot.
Gilbert et al.’s (2016) criticism only makes sense if replication failures in the replication studies are falsely interpreted as evidence that the original results were false positives. Now it makes sense to argue that both the original studies and the replication studies had low power to detect true effects and that replication failures are expected when true effects are tested in studies with low power. The only question that remains is why original studies all reported significant results when they had low power, but Gilbert et al. (2016) do not address this question.
Aside from Simmons et al.’s (2011) simulation studies, a few articles tried to examine the rate of false-positive results empirically. One approach is to examine sign changes in replication studies. If 100 true null hypotheses are tested, 50 studies are expected to show a positive sign and 50 studies are expected to show a negative sign due to random sampling error. If these 100 studies are replicated, this will happen again. Just like two coin flips, we would therefore expect 50 studies with the same outcome(both positive or both negative) and 50 studies with different outcomes (one positive, one negative).
Wilson and Wixted (2018) found that 25% of social psychological results in the OSC project showed a sign reversal. This would suggest that 50% of the studies tested a true null hypothesis. Of course, sign reversals are also possible when the effect size is not strictly zero. However, the probability of a sign reversal decreases as effect sizes increase. Thus, it is possible to say that about 50% of the replicated studies had an effect size close to zero. Unfortunately, this estimate is imprecise due to the small sample size.
Gronau, Duizer, Bakker, and Wagenmakers (2017) attempted to estimate the false discovery rate using a statistical model that is fitted to the exact p values of original studies. The applied this model to three data sets and found false discovery rates (FDRs) of 34-46% for cognitive psychology, 40 – 60% for social psychology in general, and 48-88% for social priming. However, Schimmack and Brunner (2019) discovered a statistical flaw in this model that leads to the overestimation of the FDR. They also pointed out that it is impossible to provide exact estimates of the FDR because the distinction between absolutely no effect and a very small effect is arbitrary.
Bartoš and Schimmack (2020) developed a statistical model, called z-curve.2.0, that makes it possible to estimate the maximum FDR. If this maximum is low, it suggests that most replication failures are due to low power. Applying z-curve2.0 to Gronau et al.’s (2017) data sets yields FDRs of 9% (95% CI [2%, 24%]) for cognitive psychology, 26% (95% CI [4%, 100%]) for social psychology, and 61% (95% CI [19%, 100%]) for social priming. The z-curve estimate that up to 61% of social priming results could be false positives justifies Kahneman’s letter to Bargh that called out social priming research as the “poster child for doubts about the integrity of psychological research” (cf. Yong, 2012). The difference between 9% for cognitive psychology and 61% for social priming makes it clear that it is not possible to generalize from the replication crisis in social psychology to other areas of psychology. In conclusion, it is impossible to specify exactly whether an original finding was a false-positive result or not. There have been several attempts to estimate the number of false-positive results in the literature, but there is no consensus about the proper method to do so. I believe that the distinction between false and true positives is not particularly helpful if the null hypothesis is specified as a value of zero. An effect size of d = .0001 is not any more meaningful than an effect size of d = 0000. To be meaningful, published results should be replicable given the same sample sizes as used in original research. Demonstrating a significant result in the same direction in a much larger sample with a much smaller effect size should not be considered a successful replication.
Crisis: Original Studies Are Selected for Significance
The most obvious explanation for the replication crisis is the well-known bias to publish only significant results that confirm theoretical predictions. As a result, it is not necessary to read the results section of a psychological article. It will inevitably report confirmatory evidence, p < .05. This practice is commonly known as publication bias. Concerns about publication bias are nearly as old as empirical psychology (Rosenthal, 1979; Sterling, 1959). Kerr (1998) published his famous “HARKing” (hypothesising after results are known) article to explain how social psychologists were able to report mostly significant results. Social psychology journals responded by demanding that researchers publish multiple replication studies within a single article (cf. Wegner, 1992). These multiple-study articles created a sense of rigor and made false- positive results extremely unlikely. With five significant results with p < .05, the risk of a false-positive result is smaller than the criterion used by particle physicists to claim a discovery (cf. Schimmack, 2012). Thus, Bem’s (2011) article that contained nine successful studies exceeded the stringent criterion that was used to claim the discovery of the Higgs-Boson particle, the most celebrated findings in physics in the 2010s. The key difference be- tween the discovery of the Higgs-Boson particle in 2012 and Bem’s discovery of mental time travel is that physicists conducted a single powerful experiment to test their predictions, while Bem conducted many studies and selectively published results that supported his claim (Schimmack, 2018b). Bem (2012) even admitted that he ran many small studies that were not included in the article. At the same time, he was willing to combine several small studies with promising trends into a single data set. For example, Study 6 was really four studies with Ns = 50, 41, 19, and 40 (cf. Schimmack, Schultz, Carlsson, & Schmukle, 2018). These questionable, to say the least, practices were so common in social psychology that leading social psychologists were unwilling to retract Bem’s article because this practice was considered acceptable (Kitayama, 2018).
There have been three independent approaches to examine the use of questionable research practices. All three approaches show converging evidence that questionable practices inflate the rate of significant results in social psychology journals. Cairo, Green, Forsyth, Behler, and Raldiris (2020) demonstrated that published articles report more significant results than dissertations. John et al. (2012) found evidence for the use of questionable practices with a survey of research practices. The most widely used QRPs were not reporting all dependent variables (65%), collecting more data after snooping (57%), and selectively reporting studies that worked (48%). Moreover, researchers found these QRPs acceptable with defensibility ratings (0 –2) of 1.84, 1.79, and 1.66, respectively. Thus, researchers are using questionable practices because they do not consider them to be problematic. It is unclear whether attitudes toward questionable research practices have changed in response to the replication crisis.
Social psychologists have responded to John et al.’s (2012) article in two ways. One response was to question the importance of the findings. Stroebe and Strack (2014) argued that these practices may not be questionable, but they do not counter Sterling’s argument that these practices invalidate the meaning of significance testing and p values. Fiedler and Schwarz (2016) argue that John et al.’s (2012) survey produced inflated estimates of the use of QRPs. However, they fail to provide an alternative explanation for the low replication rate of social psychological research.
Statistical methods that can reveal publication bias provide additional evidence about the use of QRPs. Although these tests often have low power in small sets of studies (Renkewitz & Keiner, 2019), they can provide clear evidence of publication bias when bias is large (Francis, 2012; Schimmack, 2012) or when the set of studies is large (Carter, Kofler, Forster, & McCullough, 2015; Carter & McCullough, 2013, 2014). One group of bias tests compares the success rate to estimates of mean power. The advantage of these tests is that they provide clear evidence of QRPs. Francis used this approach to demonstrate that 82% of articles with four or more studies that were published between 2009 and 2012 in Psychological Science showed evidence of bias. Given the small set of studies, this finding implies that selection for significance was severe (Schimmack, 2020).
Social psychologists have mainly ignored evidence that QRPs were used to produce significant results. John et al.’s article has been cited over 500 times, but it has not been cited by social psychologists who commented on the replication crisis like Fiske, Baumeister, Gilbert, Wilson, or Nisbett. This is symptomatic of the response by some eminent social psychologists to the replication crisis. Rather than engaging in a scientific debate about the causes of the crisis, they have remained silent or dismissed critics as unscientific. “Some critics go beyond scientific argument and counterargument to imply that the entire field is inept and misguided (e.g., Gelman, 2014; Schimmack, 2014)” (Fiske, 2017, p. 653). Yet, Fiske fails to explain why social psychological results cannot be replicated.
Others have argued that Francis’s work is unnecessary because the presence of publication bias is a well-known fact. Therefore, “one is guaranteed to eventually reject a null we already know is false” (Simonsohn, 2013, p. 599). This argument ignores that bias tests can help to show that social psychology is improving. For example, bias tests show no bias in registered replication reports, indicating that this new format produces more credible results (Schimmack, 2018a).
Murayama, Pekrun, and Fiedler (2014) noted that demonstrating the presence of bias does not justify the conclusion that there is no effect. This is true but not very relevant. Bias undermines the credibility of the evidence that is supposed to demonstrate an effect. Without credible evidence, it remains uncertain whether an effect is present or not. Moreover, Murayama et al. acknowledge that bias always inflates effect size estimates, which makes it more difficult to assess the practical relevance of published results.
A more valid criticism of Francis’s bias analyses is that they do not reveal the amount of bias (Simonsohn, 2013). That is, when we see 95% significant results in a journal and there is bias, it is not clear whether mean power was 75% or 25%. To be more useful, bias tests should also provide information about the amount of bias.
In conclusion, selective reporting of significant results inflates effect sizes, and the observed discovery rate in journals gives a false impression of the power and replicability of published results. Surveys and bias tests show that the use of QRPs in social psychology were widespread. However, bias tests merely show that QRPs were used. They do not show how much QRPs influenced reported results.
z-Curve: Quantifying the Crisis
Some psychologists developed statistical models that can quantify the influence of selection for significance on replicability. Brunner and Schimmack (2020) compared four methods to estimate the expected replication rate (ERR), including the popular p-curve method (Brunner, 2018; Simonsohn, Nelson, & Simmons, 2014; Ulrich & Miller, 2018). They found that p-curve overestimated replicability when effect sizes vary across studies. In contrast, a new method called z-curve performed well across many scenarios, especially when heterogeneity was present.
Bartoš and Schimmack (2020) validated an extended version of z-curve (z-curve2.0) that provides confidence intervals and pro- vides estimates of the expected discovery rate, that is, the percent- age of observed significant results for all tests that were conducted, even if they were not reported. To do so, z-curve estimates the size of the file drawer of unpublished studies with nonsignificant results. The z-curve has already been applied to various data sets of results in social psychology (see R-Index blog for numerous examples).
The most important data set was created by Motyl et al. (2017), who used representative sampling of social psychology journals to examine the credibility of social psychology. The data set was also much larger than the 100 studies of the actual replication project (OSC, 2015). The main drawback of Motyl et al.’s audit of social psychology was that they did not have a proper statistical tool to estimate replicability. I used this data set to estimate the replica- bility of social psychology based on a representative sample of studies. To be included in the z-curve analysis, a study had to use a t test or F test with no more than four numerator degrees of freedom. I excluded studies from the journal Psychological Science to focus on social psychology. This left 678 studies for analysis. The set included 450 between-subjects studies, 139 mixed designs, and 67 within-subject designs. The preponderance of between-subjects designs is typical of social psychology and one of the reasons for the low power of studies in social psychology.
Figure 1. z-Curve of Motyl et al.’s (2017) representative sample of focal tests in social psychology.
Figure 1 was created with the R-package zcurve. The figure shows a histogram of test statistics converted into z-scores. The red line shows statistical significance at z = 1.96, which corresponds to p < .05 (two-tailed). The blue line shows the predicted values based on the best-fitting mixture model that is used to estimate the expected replication rate and the expected discovery rate. The dotted lines show 95% confidence intervals.
The results in Figure 1 show an expected replication rate of 43% (95% CI [36%, 52%]). This result is a bit better than the 25% estimate obtained in the OSC project. There are a number of possible explanations for the discrepancy between the OSC estimate and the z-curve estimate. First of all, the number of studies in the OSC project is very small and sampling error alone could explain some of the differences. Second, the set of studies in the OSC project was not representative and may have selected studies with lower replicability. Third, some actual replication studies may have modified procedures in ways that lowered the chance of obtaining a significant result. Finally, it is never possible to exactly replicate a study (Stroebe & Strack, 2014; Van Bavel et al., 2016). Thus, z-curve estimates are overly optimistic because they assume exact replications. If there is contextual sensitivity, selection for significance will produce additional regression to the mean, and a better estimate of the actual replication rate is the expected discovery rate, EDR (Bartoš & Schimmack, 2020). The estimated EDR of 21% is close to the 25% estimate based on actual replication studies. In combination, the existing evidence suggests that the replicability of social psychological research is somewhere be- tween 20% and 50%, which is clearly unsatisfactory and much lower than the observed discovery rate of 90% or more in social psychology journals.
Figure 1 also clearly shows that questionable research practices explain the gap between success rates in laboratories and success rates in journals. The z-curve estimate of nonsignificant results shows that a large proportion of nonsignificant results is expected, but hardly any of these expected studies ever get published. This is reflected in an observed discovery rate of 90% and an expected discovery rate of 21%. The confidence intervals do not overlap, indicating that this discrepancy is statistically significant. Given such extreme selection for significance, it is not surprising that published effect sizes are inflated and replication studies fail to reproduce significant results. In conclusion, out of all explanations for replication failures in psychology, the use of questionable research practices is the main factor.
The z-curve can also be used to examine the power of subgroups of studies. In the OSC project, studies with a z-score greater than 4 had an 80% chance to be replicated. To achieve an ERR of 80% with Motyl et al.’s (2017) data, z-scores have to be greater than 3.5. In contrast, studies with just significant results (p < .05 and p > .01) have an ERR of only 28%. This information can be used to reevaluate published results. Studies with p values between .05 and .01 should not be trusted unless other information suggests otherwise (e.g., a trustworthy meta-analysis). In contrast, results with z-scores greater than 4 can be used to plan new studies. Unfortunately, there are much more questionable results with p values greater than .01 (42%) than trustworthy results with z > 4 (17%), but at least there are some findings that are likely to replicate even in social psychology.
An Inconvenient Truth
Every crisis is an opportunity to learn from mistakes. Lending practices were changed after the financial crisis in the 2000s. Psychologists and other sciences can learn from the replication crisis in social psychology, but only if they are honest and upfront about the real cause of the replication crisis. Social psychologists did not use the scientific method properly. Neither Fisher nor Neyman and Pearson, who created NHST, proposed that nonsignificant results are irrelevant or that only significant results should be published. The problems of selection for significance is evident and has been well known (Rosenthal, 1979; Sterling, 1959). Cohen (1962) warned about low power, but the main concern was a large file drawer filled with Type II errors. Nobody could imagine that whole literatures with hundreds of studies are built on nothing but sampling error and selection for significance. Bem’s article and replication failures in the 2010s showed that the abuse of questionable research practices was much more excessive than any- body was willing to believe.
The key culprit were conceptual replication studies. Even social psychologists were aware that it is unethical to hide replication failures. For example, Bem advised researchers to use questionable research practices to find significant results in their data. “Go on a fishing expedition for something—anything—interesting, even if this meant to ‘err on the side of discovery’” (Bem, 2000). However, even Bem made it clear that “this is not advice to suppress negative results. If your study was genuinely designed to test hypotheses that derive from a formal theory or are of wide general interest for some other reason, then they should remain the focus of your article. The integrity of the scientific enterprise requires the reporting of disconfirming results.”
How did social psychologists justify to themselves that it is OK to omit nonsignificant results? One explanation is the distinction between direct and conceptual replications. Conceptual replications always vary at least a small detail of a study. Thus, a nonsignificant result is never a replication failure of a previous study. It is just a failure of a specific study to show a predicted effect. Graduate students were explicitly given the advice to “never do a direct replication; that way, if a conceptual replication doesn’t work, you maintain plausible deniability” (Anonymous, cited in Spellman, 2015). This is also how Morewedge, Gilbert, and Wilson (2014) explain why they omitted nonsignificant results from a publication:
Let us be clear: We did not run the same study over and over again until it yielded significant results and then report only the study that “worked.” Doing so would be clearly unethical. Instead, like most researchers who are developing new methods, we did some preliminary studies that used different stimuli and different procedures and that showed no interesting effects. Why didn’t these studies show interesting effects? We’ll never know.
It was only in 2012 that psychologists realized that changing results in their studies were heavily influenced by sampling error and not by some minor changes in the experimental procedure. Only a few psychologists have been open about this. In a commendable editorial, Lindsay (2019) talks about his realization that his research practices were suboptimal:
Early in 2012, Geoff Cumming blew my mind with a talk that led me to realize that I had been conducting underpowered experiments for decades. In some lines of research in my lab, a predicted effect would come booming through in one experiment but melt away in the next. My students and I kept trying to find conditions that yielded consistent statistical significance—tweaking items, instructions, exclusion rules— but we sometimes eventually threw in the towel because results were maddeningly inconsistent.
Rather than invoking some supernatural decline effect, Lindsay realized that his research practices were suboptimal. A first step for social psychologists is to acknowledge their past mistakes and to learn from their mistakes. Making mistakes is a fact of life. What counts is the response to a mistake. So far, the response by social psychologists has been underwhelming. It is time for some leaders to step up or to step down and make room for a new generation of social psychologists who follow open and transparent practices.
The Way Out of the Crisis
A clear analysis of the replication crisis points toward a clear path out of the crisis. Given that “lax data collection, analysis, and reporting” standards (Carpenter, 2012, p. 1558) allowed for the use of QRPs that undermine the credibility of social psychology, the most obvious solution is to ban the use of questionable research practices and to treat them like other types of unethical behaviours (Engel, 2015). However, no scientific organisation has clearly
stated which practices are acceptable and which practices are not, and prominent social psychologists oppose clear rules of scientific misconduct (Fiske, 2016).
At present, the enforcement of good practices is left to editors of journals who can ask pertinent questions during the submission process (Lindsay, 2019). Another solution has been to ask re- searchers to preregister their studies, which limits researchers’ freedom to go on a fishing expedition (Nosek, Ebersole, DeHaven, & Mellor, 2018). Some journals reward preregistering with badges (JESP), but some social psychology journals do not (PSPB, SPPS). There has been a lot of debate about the value of preregistration and concerns that it may reduce creativity. However, preregistra- tion does not imply that all research has to be confirmatory. It merely makes it possible to distinguish clearly between explor- atory and confirmatory research.
It is unlikely that preregistration alone will solve all problems, especially because there are no clear standards about preregistra- tions and how much they constrain the actual analyses. For exam- ple, Noah, Schul, and Mayo (2018) preregistered the prediction of an interaction between being observed and a facial feedback ma- nipulation. Although the predicted interaction was not significant, they interpreted the nonsignificant pattern as confirming their prediction rather than stating that there was no support for their preregistered prediction of an interaction effect. A z-curve analysis of preregistered studies in JESP still found evidence of QRPs, although less so than for articles that were not preregistered (Schimmack, 2020). To improve the value of preregistration, so- cieties should provide clear norms for research ethics that can be used to hold researchers accountable when they try to game preregistration (Yamada, 2018).
Preregistration of studies alone will only produce more nonsig- nificant results and not increase the replicability of significant results because studies are underpowered. To increase replicabil- ity, social psychologists finally have to conduct power analysis to plan studies that can produce significant results without QRPs. This also means they need to publish less because more resources are needed for a single study (Schimmack, 2012).
To ensure that published results are credible and replicable, I argue that researchers should be rewarded for conducting high- powered studies. As a priori power analyses are based on estimates of effect sizes, they cannot provide information about the actual power of studies. However, z-curve can provide information about the typical power of studies that are conducted within a lab. This information provides quantitative information about the research practices of a lab.
This can be useful information to evaluate the contribution of a research to psychological science. Imagine an eminent scholar [I had to delete the name of this imaginary scholar in the published version, I used the R-Index of Roy F. Baumeister for this example] with an H-index of 100, but assume that this H-index was achieved by publishing many studies with low power that are difficult to replicate. A z-curve analysis might produce an estimate of 25%. This information can be integrated with the H-index to produce a replicability-weighted H-index of RH = 100 * .25 = 25. Another researcher may be less prolific and only have an H-index of 50. A z-curve analysis shows that these studies have a replicability of 80%. This yields an RH-index of 40, which is higher than the RH index of the prolific researcher. By quantifying replicability, we can reward researchers who make replicable contributions to psychological science.
By taking replicability into account, the incentive to publish as many discoveries as possible without concerns about their truth- value (i.e., “to err on the side of discovery”) is no longer the best strategy to achieve fame and recognition in a field. The RH-index could also motivate researchers to retract articles that they no longer believe in, which would lower the H-index but increase the R-index. For highly problematic studies, this could produce a net gain in the RH-index.
Conclusion
Social psychology is changing in response to a replication crisis. To (re)gain trust in social psychology as a science, social psychol- ogists need to change their research practices. The problem of low power has been known since Cohen (1962), but only in recent years, power of social psychological studies has increased (Schim- mack, 2020). Aside from larger samples, social psychologists are also starting to use within-subject designs that increase power (Lin, Saunders, Friese, Evans, & Inzlicht, 2020). Finally, social psychologists need to change the way they report their results. Most important, they need to stop reporting only results that confirm their predictions. Fiske (2016) recommended that scientists keep track of their questionable practices, and Wicherts et al. (2016) provided a checklist to do so. I think it would be better to ban these practices altogether. Most important, once a discovery has been made, failures to replicate this finding provide valuable, new information and need to be published (Galak et al., 2012), and theories that fail to provide consistent support need to be abandoned or revised (Ferguson & Heene, 2012).
My personal contribution to improving science has been the development of tools that make it possible to examine whether reported results are credible or not (Bartoš & Schimmack, 2020; Schimmack, 2012; Brunner & Schimmack, 2020). I agree with Fiske (2017) that science works better when we can trust scientists, but a science with a replication rate of 25% is not trustworthy. Ironically, the same tool that reveals shady practices in the past can also demonstrate that practices in social psychology are improving (Schimmack, 2020). Hopefully, z-curve analyses of social psychology will eventually show that social psychology has become a trustworthy science.
References
Acosta, A., Adams, R. B., Jr., Albohn, D. N., Allard, E. S., Beek, T., Benning, S. D., . . . Zwaan, R. A. (2016). Registered replication report: Strack, Martin, & Stepper (1988). Perspectives on Psychological Sci- ence, 11, 917–928. http://dx.doi.org/10.1177/1745691616674458
Alogna, V. K., Attaya, M. K., Aucoin, P., Bahník, Š., Birch, S., Birt, A. R.,. . . Zwaan, R. A. (2014). Registered replication report: Schooler & Engstler-Schooler (1990). Perspectives on Psychological Science, 9, 556 –578. http://dx.doi.org/10.1177/1745691614545653
Bakker, M., van Dijk, A., & Wicherts, J. M. (2012). The Rules of the Game Called Psychological Science. Perspectives on Psychological Science, 7(6), 543–554. https://doi.org/10.1177/1745691612459060
Bartlett, T. (2013). Power of suggestion: The amazing influence of uncon- scious cues is among the most fascinating discoveries of our time—That is, if it’s true. The Chronicle of Higher Education. Retrieved from https://www.chronicle.com/article/Power-of-Suggestion/136907
Bartoš, F., & Schimmack, U. (2020). z-curve.2.0: Estimating replication and discovery rates. Unpublished manuscript.
Baumeister, R. F., & Vohs, K. D. (2016). Misguided Effort With Elusive Implications. Perspectives on Psychological Science, 11(4), 574–575. https://doi.org/10.1177/1745691616652878
Bem, D. J. (2000). Writing an empirical article. In R. J. Sternberg (Ed.), Guide to publishing in psychological journals (pp. 3–16). Cambridge, UK: Cambridge University Press. http://dx.doi.org/10.1017/CBO9780511807862.002
Bem, D. J. (2011). Feeling the future: Experimental evidence for anoma- lous retroactive influences on cognition and affect. Journal of Person- ality and Social Psychology, 100, 407– 425. http://dx.doi.org/10.1037/a0021524
Bem, D. J., Utts, J., & Johnson, W. O. (2011). Must psychologists change the way they analyze their data? Journal of Personality and Social Psychology, 101, 716 –719. http://dx.doi.org/10.1037/a0024777
Benjamin, D.J., Berger, J.O., Johannesson, M. et al. Redefine statistical significance. Nature Human Behaviour 2, 6–10 (2018). https://doi.org/10.1038/s41562-017-0189-z
Brunner, J., & Schimmack, U. (2020). Estimating population mean power under conditions of heterogeneity and selection for significance. Meta- Psychology. MP.2018.874, https://doi.org/10.15626/MP.2018.874
Bryan, C. J., Yeager, D. S., & O’Brien, J. M. (2019). Replicator degrees of freedom allow publication of misleading failures to replicate. Proceed- ings of the National Academy of Sciences USA, 116, 25535–25545. http://dx.doi.org/10.1073/pnas.1910951116
Cacioppo, J. T., Petty, R. E., & Morris, K. (1983). Effects of need for cognition on message evaluation, recall, and persuasion. Journal of Personality and Social Psychology, 45, 805– 818. http://dx.doi.org/10.1037/0022-3514.45.4.805
Cairo, A. H., Green, J. D., Forsyth, D. R., Behler, A. M. C., & Raldiris, T. L. (2020). Gray (literature) mattes: Evidence of selective hypothesis reporting in social psychological research. Personality and Social Psy- chology Bulletin. Advance online publication. http://dx.doi.org/10.1177/ 0146167220903896
Carter, E. C., Kofler, L. M., Forster, D. E., & McCullough, M. E. (2015). A series of meta-analytic tests of the depletion effect: Self-control does not seem to rely on a limited resource. Journal of Experimental Psy- chology: General, 144, 796 – 815. http://dx.doi.org/10.1037/xge0000083 Carter, E. C., & McCullough, M. E. (2013). Is ego depletion too incredible? Evidence for the overestimation of the depletion effect. Behavioraland Brain Sciences, 36, 683– 684. http://dx.doi.org/10.1017/S0140525X13000952
Carter, E. C., & McCullough, M. E. (2014). Publication bias and the limited strength model of self-control: Has the evidence for ego depletion been overestimated? Frontiers in Psychology, 5, 823.http://dx.doi.org/10.3389/fpsyg.2014.00823
Cohen, J. (1962). The statistical power of abnormal-social psychological research: A review. Journal of Abnormal and Social Psychology, 65, 145–153. http://dx.doi.org/10.1037/h0045186
Crandall, C. S., & Sherman, J. W. (2016). On the scientific superiority of conceptual replications for scientific progress. Journal of Experimental Social Psychology, 66, 93–99. http://dx.doi.org/10.1016/j.jesp.2015.10.002
Cunningham, M. R., & Baumeister, R. F. (2016). How to make nothing out of something: Analyses of the impact of study sampling and statistical interpretation in misleading meta-analytic conclusions. Frontiers in Psy- chology, 7, 1639. http://dx.doi.org/10.3389/fpsyg.2016.01639
Ebersole, C. R., Atherton, O. E., Belanger, A. L., Skulborstad, H. M., Allen, J. M., Banks, J. B., . . . Nosek, B. A. (2016). Many Labs 3: Evaluating participant pool quality across the academic semester via replication. Journal of Experimental Social Psychology, 67, 68 – 82. http://dx.doi.org/10.1016/j.jesp.2015.10.012
Elkins-Brown, N., Saunders, B., & Inzlicht, M. (2018). The misattribution of emotions and the error-related negativity: A registered report. Cortex, 109, 124 –140. http://dx.doi.org/10.1016/j.cortex.2018.08.017
Ferguson, C. J., & Heene, M. (2012). A vast graveyard of undead theories: Publication bias and psychological science’s aversion to the null. Per- spectives on Psychological Science, 7, 555–561. http://dx.doi.org/10.1177/1745691612459059
Fiedler, K., & Schwarz, N. (2016). Questionable research practices revis- ited. Social Psychological & Personality Science, 7, 45–52. http://dx.doi.org/10.1177/1948550615612150
Fisher, R. A. (1926). The arrangement of field experiments. Journal of the Ministry of Agriculture, 33, 503–513.
Fiske, S. T. (2016). How to publish rigorous experiments in the 21st century. Journal of Experimental Social Psychology, 66, 145–147. http://dx.doi.org/10.1016/j.jesp.2016.01.006
Francis, G. (2012). Too good to be true: Publication bias in two prominent studies from experimental psychology. Psychonomic Bulletin & Review, 19, 151–156. http://dx.doi.org/10.3758/s13423-012-0227-9
Galak, J., LeBoeuf, R. A., Nelson, L. D., & Simmons, J. P. (2012). Correcting the past: Failures to replicate. Journal of Personality andSocial Psychology, 103, 933–948. http://dx.doi.org/10.1037/a0029709
Gilbert, D. T., King, G., Pettigrew, S., & Wilson, T. D. (2016). Comment on “Estimating the reproducibility of psychological science.” Science, 351, 1037–1103. http://dx.doi.org/10.1126/science.aad7243
Gronau, Q. F., Duizer, M., Bakker, M., & Wagenmakers, E.-J. (2017). Bayesian mixture modeling of significant p values: A meta-analytic method to estimate the degree of contamination from Ho. Journal of Experimental Psychology: General, 146, 1223–1233. http://dx.doi.org/10.1037/xge0000324
Hagger, M. S., Chatzisarantis, N. L. D., Alberts, H., Anggono, C. O., Batailler, C., Birt, A. R., . Zwienenberg, M. (2016). A multilab preregistered replication of the ego-depletion effect. Perspectives on Psychological Science, 11, 546 –573. http://dx.doi.org/10.1177/1745691616652873
Hagger, M. S., Wood, C., Stiff, C., & Chatzisarantis, N. L. D. (2010). Ego depletion and the strength model of self-control: A meta-analysis. Psychological Bulletin, 136, 495–525. http://dx.doi.org/10.1037/a0019486
Inbar, Y. (2016). Association between contextual dependence and replicability in psychology may be spurious. Proceedings of the National Academy of Sciences, 113(34):E4933-9334, doi.org/10.1073/pnas.1608676113
John, L. K., Loewenstein, G., & Prelec, D. (2012). Measuring the Prevalence of Questionable Research Practices With Incentives for Truth Telling. Psychological Science, 23(5), 524–532. https://doi.org/10.1177/0956797611430953
Kerr, N. L. (1998). HARKing: Hypothesizing After the Results are Known. Personality and Social Psychology Review, 2(3), 196–217. https://doi.org/10.1207/s15327957pspr0203_4
Kruschke, J. K., & Liddell, T. M. (2018). The Bayesian new statistics: Hypothesis testing, estimation, meta-analysis, and power analysis from a Bayesian perspective. Psychonomic Bulletin & Review, 25, 178 –206. http://dx.doi.org/10.3758/s13423-016-1221-4
Kvarven, A., Strømland, E. & Johannesson, M. (2020). Comparing meta-analyses and preregistered multiple-laboratory replication projects. Nature Human Behaviour 4, 423–434 (2020). https://doi.org/10.1038/s41562-019-0787-z
Lakens, D., Scheel, A. M., & Isager, P. M. (2018). Equivalence testing for psychological research: A tutorial. Advances in Methods and Practices in Psychological Science, 1, 259 –269. http://dx.doi.org/10.1177/2515245918770963
Luttrell, A., Petty, R. E., & Xu, M. (2017). Replicating and fixing failed replications: The case of need for cognition and argument quality. Journal of Experimental Social Psychology, 69, 178 –183. http://dx.doi.org/10.1016/j.jesp.2016.09.006
Maxwell, S. E., Lau, M. Y., & Howard, G. S. (2015). Is psychology suffering from a replication crisis? What does “failure to replicate” really mean? American Psychologist, 70, 487– 498. http://dx.doi.org/10.1037/a0039400
Motyl, M., Demos, A. P., Carsel, T. S., Hanson, B. E., Melton, Z. J., Mueller, A. B., . . . Skitka, L. J. (2017). The state of social and personality science: Rotten to the core, not so bad, getting better, or getting worse? Journal of Personality and Social Psychology, 113, 34 –58. http://dx.doi.org/10.1037/pspa0000084
Murayama, K., Pekrun, R., & Fiedler, K. (2014). Research practices that can prevent an inflation of false-positive rates. Personality and Social Psychology Review, 18, 107–118. http://dx.doi.org/10.1177/1088868313496330
Noah, T., Schul, Y., & Mayo, R. (2018). When both the original study and its failed replication are correct: Feeling observed eliminates the facial- feedback effect. Journal of Personality and Social Psychology, 114, 657– 664. http://dx.doi.org/10.1037/pspa0000121
Nosek, B. A., Ebersole, C. R., DeHaven, A. C., & Mellor, D. T. (2018). The preregistration revolution. Proceedings of the National Academy of Sciences USA, 115, 2600 –2606. http://dx.doi.org/10.1073/pnas.1708274114
Pashler, H., & Harris, C. R. (2012). Is the replicability crisis overblown? Three arguments examined. Perspectives on Psychological Science, 7, 531–536. http://dx.doi.org/10.1177/1745691612463401
Pettigrew, T. F. (2018). The emergence of contextual social psychology. Personality and Social Psychology Bulletin, 44, 963–971. http://dx.doi.org/10.1177/0146167218756033
Renkewitz, F., & Keiner, M. (2019). How to detect publication bias in psychological research: A comparative evaluation of six statistical methods. Zeitschrift für Psychologie, 227(4), 261-279. http://dx.doi.org/10.1027/2151-2604/a000386
Ritchie, S. J., Wiseman, R., & French, C. C. (2012). Failing the future: Three unsuccessful attempts to replicate Bem’s ‘retroactive facilitation of recall’ effect. PLoS One, 7, e33423. http://dx.doi.org/10.1371/journal.pone.0033423
Scheel, A. M., Schijen, M., & Lakens, D. (2020). An excess of positive results: Comparing the standard psychology literature with registered reports. Retrieved from https://psyarxiv.com/p6e9c
Schimmack, U. (2012). The ironic effect of significant results on the credibility of multiple-study articles. Psychological Methods, 17, 551– 566. http://dx.doi.org/10.1037/a0029487
Schimmack, U. (2018b). Why the Journal of Personality and Social Psychology Should Retract Article DOI:10.1037/a0021524 “Feeling the future: Experimental evidence for anomalous retroactive influences on cognition and affect” by Daryl J. Bem. Retrieved January 6, 2020, from https://replicationindex.com/2018/01/05/bem-retraction
Schooler, J. W. (2014). Turning the lens of science on itself: Verbal overshadowing, replication, and metascience. Perspectives on Psycho- logical Science, 9, 579 –584. http://dx.doi.org/10.1177/1745691614547878
Schooler, J. W., & Engstler-Schooler, T. Y. (1990). Verbal overshadowing of visual memories: Some things are better left unsaid. Cognitive Psy- chology, 22, 36 –71. http://dx.doi.org/10.1016/0010-0285(90)90003-M
Simmons, J. P., Nelson, L. D., & Simonsohn, U. (2011). False-positive psychology: Undisclosed flexibility in data collection and analysis allows presenting anything as significant. Psychological Science, 22, 1359 –1366. http://dx.doi.org/10.1177/0956797611417632
Simonsohn, U. (2013). It does not follow: Evaluating the one-off publication bias critiques by Francis (2012a, 2012b, 2012c, 2012d, 2012e, in press). Perspective on Psychological Science, 7, 597–599. http://dx.doi.org/10.1177/1745691612463399
Simonsohn, U., Nelson, L. D., & Simmons, J. P. (2014). P-curve and effect size: Correcting for publication bias using only significant results. Perspectives on Psychological Science, 9, 666 – 681. http://dx.doi.org/10.1177/1745691614553988
Sterling, T. D. (1959). Publication decision and the possible effects on inferences drawn from tests of significance— or vice versa. Journal of the American Statistical Association, 54, 30 –34.
Sterling, T. D., Rosenbaum, W. L., & Weinkam, J. J. (1995). Publication decisions revisited: The effect of the outcome of statistical tests on the decision to publish and vice versa. The American Statistician, 49, 108 –112.
Strack, F. (2016). Reflection on the smiling registered replication report. Perspectives on Psychological Science, 11, 929 –930. http://dx.doi.org/10.1177/1745691616674460
Stroebe, W., & Strack, F. (2014). The alleged crisis and the illusion of exact replication. Perspectives on Psychological Science, 9, 59 –71. http://dx.doi.org/10.1177/1745691613514450
Tendeiro, J. N., & Kiers, H. A. L. (2019). A review of issues about null hypothesis Bayesian testing. Psychological Methods, 24, 774 –795. http://dx.doi.org/10.1037/met0000221
Trafimow, D. (2003). Hypothesis testing and theory evaluation at the boundaries: Surprising insights from Bayes’s theorem. Psychological Review, 110, 526 –535. http://dx.doi.org/10.1037/0033-295X.110.3.526 Trafimow, D., & Marks, M. (2015). Editorial. Basic and Applied Social Psychology, 37, 1–2. http://dx.doi.org/10.1080/01973533.2015.1012991 Ulrich, R., & Miller, J. (2018). Some properties of p-curves, with an application to gradual publication bias. Psychological Methods, 23, 546 –560. http://dx.doi.org/10.1037/met0000125
Van Bavel, J. J., Mende-Siedlecki, P., Brady, W. J., & Reinero, D. A. (2016). Contextual sensitivity in scientific reproducibility. Proceedings of the National Academy of Sciences USA, 113, 6454 – 6459. http://dx.doi.org/10.1073/pnas.1521897113
Wagenmakers, E. J., Wetzels, R., Borsboom, D., & van der Maas, H. L. (2011). Why psychologists must change the way they analyze their data: The case of psi: Comment on Bem (2011). Journal of Personality and Social Psychology, 100, 426 – 432. http://dx.doi.org/10.1037/a0022790
Wagenmakers, E.-J., Beek, T., Dijkhoff, L., Gronau, Q. F., Acosta, A., Adams, R. B., … Zwaan, R. A. (2016). Registered Replication Report: Strack, Martin, & Stepper (1988). Perspectives on Psychological Science, 11(6), 917–928. https://doi.org/10.1177/1745691616674458
Wicherts, J. M., Veldkamp, C. L. S., Augusteijn, H. E. M., Bakker, M., van Aert, R. C. M., & van Assen, M. A. L. M. (2016). Degrees of freedom in planning, running, analyzing, and reporting psychological studies: A checklist to avoid p-hacking. Frontiers in Psychology, 7, 1832.http://dx.doi.org/10.3389/fpsyg.2016.01832
Wilson, B. M., & Wixted, J. T. (2018). The prior odds of testing a true effect in cognitive and social psychology. Advances in Methods and Practices in Psychological Science, 1, 186 –197. http://dx.doi.org/10.1177/2515245918767122
Zwaan, R. A., Etz, A., Lucas, R. E., & Donnellan, M. B. (2018). Improving social and behavioral science by making replication mainstream: A response to commentaries. Behavioral and Brain Sciences, 41, e157. http://dx.doi.org/10.1017/S0140525X18000961
Cookie Consent
We use cookies to improve your experience on our site. By using our site, you consent to cookies.