
Conclusion
Gordon et al. (2021) conducted a meta-analysis of 103 studies that were included in prediction markets to forecast the outcome of replication studies. The results show that prediction markets can forecast replication outcomes above chance levels, but the value of this information is limited. Without actual replication studies, it remains unclear which published results can be trusted or not. Here I compare the performance of prediction markets to the R-Index and the closely related p < .005 rule. These statistical forecasts perform nearly as well as markets and are much easier to use to make sense of thousands of published articles. However, even these methods have a high failure rate. The best solution to this problem is to rely on meta-analyses of studies rather than to predict the outcome of a single study. In addition to meta-analyses, it will be necessary to conduct new studies that are conducted with high scientific integrity to provide solid empirical foundations for psychology. Claims that are not supported by bias-corrected meta-analyses or new preregistered studies are merely suggestive and currently lack empirical support.
Introduction
Since 2011, it became apparent that many published results in psychology, especially social psychology fail to replicate in direct replication studies (Open Science Collaboration, 2015). In social psychology the success rate of replication studies is so low (25%) that it makes sense to bet on replication failures. This would produce 75% successful outcomes, but it would also imply that an entire literature has to be discarded.
It is practically impossible to redo all of the published studies to assess their replicability. Thus, several projects have attempted to predict replication outcomes of individual studies. One strategy is to conduct prediction markets in which participants can earn real money by betting on replication outcomes. There have been four prediction markets with a total of 103 studies with known replication outcomes (Gordon et al., 2021). The key findings are summarized in Table 1.
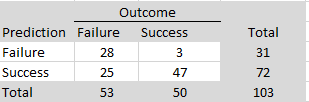
Markets have a good overall success rate, (28+47)/103 = 73% that is above chance (flipping a coin). Prediction markets are better at predicting failures, 28/31 = 90%, than predicting successes, 47/72 = 65%. The modest success rate for success is a problem because it would be more valuable to be able to identify studies that will replicate and do not require a new study to verify the results.
Another strategy to predict replication outcomes relies on the fact that the p-values of original studies and the p-values of replication studies are influenced by the statistical power of a study (Brunner & Schimmack, 2020). Studies with higher power are more likely to produce lower p-values and more likely to produce significant p-values in replication studies. As a result, p-values also contain valuable information about replication outcomes. Gordon et al. (2021) used p < .005 as a rule to predict replication outcomes. Table 2 shows the performance of this simple rule.
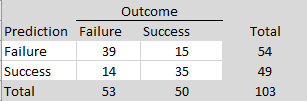
The overall success rate of this rule is nearly as good as the prediction markets, (39+35)/103 = 72%; a difference by k = 1 studies. The rule does not predict failures as well as the markets, 39/54 = 72% (vs. 90%), but it predicts successes slightly better than the markets, 35/49 = 71% (vs. 65%).
A logistic regression analysis showed that both predictors independently contribute to the prediction of replication outcomes, market b = 2.50, se = .68, p = .0002; p < .005 rule: b = 1.44, se = .48, p = .003.
In short, p-values provide valuable information about the outcome of replication studies.
The R-Index
Although a correlation between p-values and replication outcomes follows logically from the influence of power on p-values in original and replication studies, the cut-off value of .005 appears to be arbitrary. Gordon et al. (2017) justify its choice with an article by Benjamin et al. (2017) that recommended a lower significance level (alpha) to ensure a lower false positive risk. Moreover, they advocated for this rule for new studies that preregister hypotheses and do not suffer from selection bias. In contrast, the replication crisis was caused by selection for significance which produced success rates of 90% or more in psychology journals (Motyl et al., 2017; Sterling, 1959; Sterling et al., 1995). One main reason for replication failures is that selection for significance inflates effect sizes and due to regression to the mean, effect sizes in replication studies are bound to be weaker, resulting in non-significant results, especially if the original p-value was close to the threshold value of alpha = .05. The Open Science Collaboration (2015) replicability project showed that effect sizes are on average inflated by over 100%.
The R-Index provides a theoretical rational for the choice of a cut-off value for p-values. The theoretical cutoff value happens to be p = .0084. The fact that it is close to Benjamin et al.’s (2017) value of .005 is merely a coincidence.
P-values can be transformed into estimates of the statistical power of a study. These estimates rely on the observed effect size of a study and are sometimes called observed power or post-hoc power because power is computed after the results of a study are known. Figure 1 illustrates observed power with an example of a z-test that produced a z-statistic of 2.8 which corresponds to a two-sided p-value of .005.
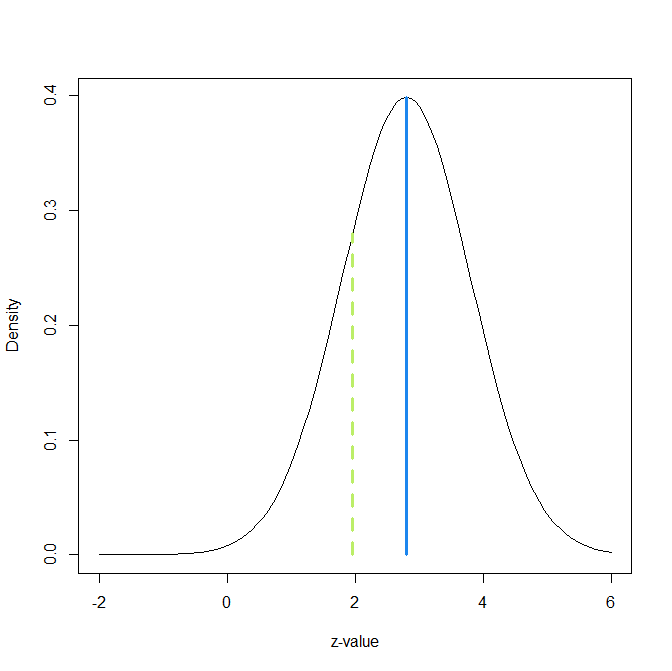
A p-value of .005 corresponds to z-value of 2.8 for the standard normal distribution centered over zero (the nil-hypothesis). The standard level of statistical significance, alpha = .05 (two-sided) corresponds to z-value of 1.96. Figure 1 shows the sampling distribution of studies with a non-central z-score of 2.8. The green line cuts this distribution into a smaller area of 20% below the significance level and a larger area of 80% above the significance level. Thus, the observed power is 80%.
Selection for significance implies truncating the normal distribution at the level of significance. This means the 20% of non-significant results are discarded. As a result, the median of the truncated distribution is higher than the median of the full normal distribution. The new median can be found using the truncnorm package in R.
qtruncnorm(.5,a = qnorm(1-.05/2),mean=2.8) = 3.05
This value corresponds to an observed power of
qnorm(3.05,qnorm(1-.05/2) = .86
Thus, selection for significance inflates observed power of 80% to 86%. The amount of inflation is larger when power is lower. With 20% power, the inflated power after selection for significance is 67%.
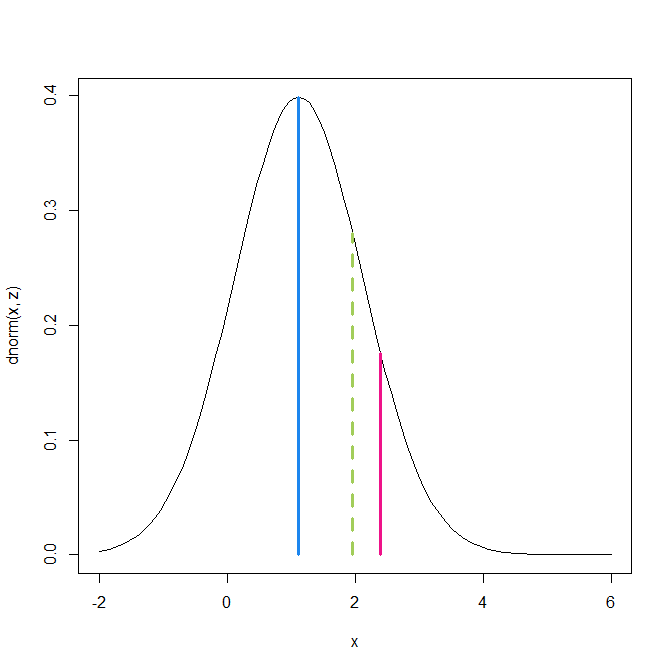
Figure 3 shows the relationship between inflated power on the x-axis and adjusted power on the y-axis. The blue curve uses the truncnorm package. The green line shows the simplified R-Index that simply substracts the amount of inflation from the inflated power. For example, if inflated power is 86%, the inflation is 1-.86 = 14% and subtracting the inflation gives an R-Index of 86-14 = 82%. This is close to the actual value of 80% that produced the inflated value of 86%.
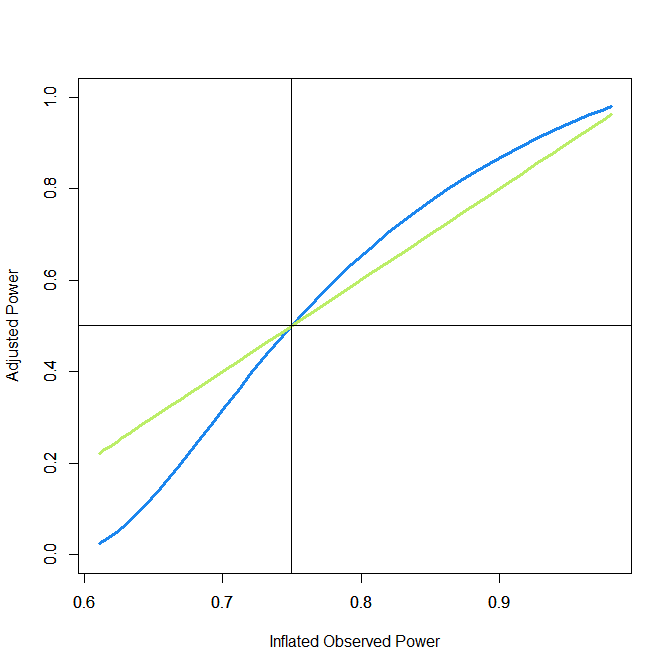
Figure 4 shows that the R-Index is conservative (underestimates power) when power is over 50%, but is liberal (overestimates power) when power is below 50%. The two methods are identical when power is 50% and inflated power is 75%. This is a fortunate co-incidence because studies with more than 50% power are expected to replicate and studies with less than 50% power are expected to fail in a replication attempt. Thus, the simple R-Index makes the same dichotomous predictions about replication outcomes as the more sophisticated approach to find the median of the truncated normal distribution.
The inflated power for actual power of 50% is 75% and 75% power corresponds to a z-score of 2.63, which in turn corresponds to a p-value of p = .0084.
Performance of the R-Index is slightly worse than the p < .005 rule because the R-Index predicts 5 more successes, but 4 of these predictions are failures. Given the small sample size, it is not clear whether this difference is reliable.

In sum, the R-Index is based on a transformation of p-values into estimates of statistical power, while taking into account that observed power is inflated when studies are selected for significance. It provides a theoretical rational for the atheoretical p < .005 rule, because this rule roughly cuts p-values into p-values with more or less than 50% power.
Predicting Success Rates
The overall success rate across the 103 replication studies was 50/103 = 49%. This percentage cannot be generalized to a specific population of studies because the 103 are not a representative sample of studies. Only the Open Science Collaboration project used somewhat representative sampling. However, the 49% success rate can be compared to the success rates of different prediction methods. For example, prediction markets predict a success rate of 72/103 = 70%, a significant difference (Gordon et al., 2021). In contrast, the R-Index predicts a success rate of 54/103 = 52%, which is closer to the actual success rate. The p < .005 rule does even better with a predicted success rate of 49/103 = 48%.
Another method that has been developed to estimate the expected replication rate is z-curve (Bartos & Schimmack, 2021; Brunner & Schimmack, 2020). Z-curve transforms p-values into z-scores and then fits a finite mixture model to the distribution of significant p-values. Figure 5 illustrates z-curve with the p-values from the 103 replicated studies.
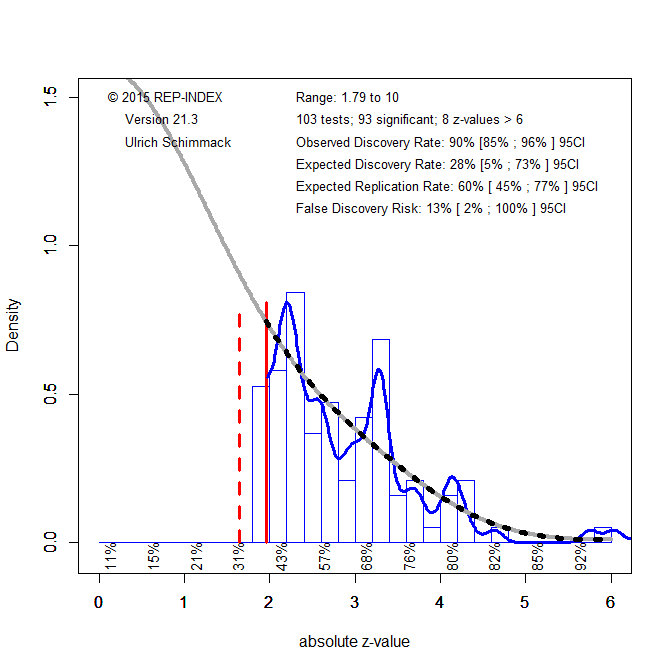
The z-curve estimate of the expected replication rate is 60%. This is better than the prediction market, but worse than the R-Index or the p < .005 rule. However, the 95%CI around the ERR includes the true value of 49%. Thus, sampling error alone might explain this discrepancy. However, Bartos and Schimmack (2021) discussed several other reasons why the ERR may overestimate the success rate of actual replication studies. One reason is that actual replication studies are not perfect replicas of the original studies. So called, hidden moderators may create differences between original and replication studies. In this case, selection for significance produces even more inflation that the model assumes. In the worst case scenario, a better estimate of actual replication outcomes might be the expected discovery rate (EDR), which is the power of all studies that were conducted, including non-significant studies. The EDR for the 103 studies is 28%, but the 95%CI is wide and includes the actual rate of 49%. Thus, the dataset is too small to decide between the ERR or the EDR as best estimates of actual replication outcomes. At present it is best to consider the EDR the worst possible and the ERR the best possible scenario and to expect the actual replication rate to fall within this interval.
Social Psychology
The 103 studies cover studies from experimental economics, cognitive psychology, and social psychology. Social psychology has the largest set of studies (k = 54) and the lowest success rate, 33%. The prediction markets overpredict successes, 50%. The R-Index also overpredicted successes, 46%. The p < .005 rule had the least amount of bias, 41%.

Z-curve predicted an ERR of 55% s and the actual success rate fell outside the 95% confidence interval, 34% to 74%. The EDR of 22% underestimates the success rate, but the 95%CI is wide and includes the true value, 95%CI = 5% to 70%. Once more the actual success rate is between the EDR and the ERR estimates, 22% < 34% < 55%.
In short, prediction models appear to overpredict replication outcomes in social psychology. One reason for this might be that hidden moderators make it difficult to replicate studies in social psychology which adds additional uncertainty to the outcome of replication studies.
Regarding predictions of individual studies, prediction markets achieved an overall success rate of 76%. Prediction markets were good at predicting failures, 25/27 = 93%, but not so good in predicting successes, 16/27 = 59%.
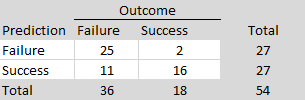
The R-Index performed as well as the prediction markets with one more prediction of a replication failure.

The p < .005 rule was the best predictor because it predicted more replication failures.

Performance could be increased by combining prediction markets and the R-Index and only bet on successes when both predictors predicted a success. In particular, the prediction of success improved to 14/19 = 74%. However, due to the small sample size it is not clear whether this is a reliable finding.
Non-Social Studies
The remaining k = 56 studies had a higher success rate, 65%. The prediction markets overpredicted success, 92%. The R-Index underpredicted successes, 59%. The p < .005 rule underpredicted successes even more.

This time z-curve made the best prediction with an ERR of 67%, 95%CI = 45% to 86%. The EDR underestimates the replication rate, although the 95%CI is very wide and includes the actual success rate, 5% to 81%. The fact that z-curve overestimated replicability for social psychology, but not for other areas, suggests that hidden moderators may contribute to the replication problems in social psychology.
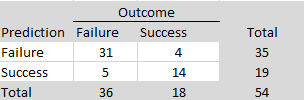
For predictions of individual outcomes, prediction markets had a success rate of (3 + 31)/49 = 76%. The good performance is due to the high success rate. Simply betting on success would have produced 32/49 = 65% successes. Predictions of failures had a s success rate of 3/4 = 75% and predictions of successes had a success rate of 31/45 = 69%.
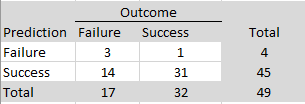
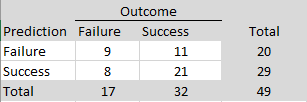
The R-Index had a lower success rate of (9 +21)/49 = 61%. The R-Index was particularly poor at predicting failures, 9/20 = 45%, but was slightly better at predicting successes than the prediction markets, 21/29 = 72%.
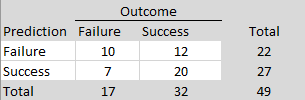
The p < .500 rule had a success rate equal to the R-Index, (10 + 20)/49 = 61%, with one more correctly predicted failure and one less correctly predicted success.
Discussion
The present results reproduce the key findings of Gordon et al. (2021). First, prediction markets overestimate the success of actual replication studies. Second, prediction markets have some predictive validity in forecasting the outcome of individual replication studies. Third, a simple rule based on p-values also can forecast replication outcomes.
The present results also extend Gordon et al.’s (2021) findings based on additional analyses. First, I compared the performance of prediction markets to z-curve as a method for the prediction of the success rates of replication outcomes (Bartos & Schimmack, 2021; Brunner & Schimmack, 2021). Z-curve overpredicted success rates for all studies and for social psychology, but was very accurate for the remaining studies (economics, cognition). In all three comparisons, z-curve performed better than prediction markets. Z-curve also has several additional advantages over prediction markets. First, it is much easier to code a large set of test statistics than to run prediction markets. As a result, z-curve has already been used to estimate the replication rates for social psychology based on thousands of test statistics, whereas estimates of prediction markets are based on just over 50 studies. Second, z-curve is based on sound statistical principles that link the outcomes of original studies to the outcomes of replication studies (Brunner & Schimmack, 2020). In contrast, prediction markets rest on unknown knowledge of market participants that can vary across markets. Third, z-curve estimates are provided with validated information about the uncertainty in the estimates, whereas prediction markets provide no information about uncertainty and uncertainty is large because markets tend to be small. In conclusion, z-curve is more efficient and provides better estimates of replication rates than prediction markets.
The main goal of prediction markets is to assess the credibility of individual studies. Ideally, prediction markets would help consumers of published research to distinguish between studies that produced real findings (true positives) and studies that produced false findings (false positives) without the need to run additional studies. The encouraging finding is that prediction markets have some predictive validity and can distinguish between studies that replicate and studies that do not replicate. However, to be practically useful it is necessary to assess the practical usefulness of the information that is provided by prediction markets. Here we need to distinguish the practical consequences of replication failures and successes. Within the statistical framework of nil-hypothesis significance testing, successes and failures have different consequences.
A replication failure increases uncertainty about the original finding. Thus, more research is needed to understand why the results diverged. This is also true for market predictions. Predictions that a study would fail to replicate cast doubt about the original study, but do not provide conclusive evidence that the original study reported a false positive result. Thus, further studies are needed, even if a market predicts a failure. In contrast, successes are more informative. Replicating a previous finding successfully strengthens the original findings and provides fairly strong evidence that a finding was not a false positive result. Unfortunately, the mere prediction that a finding will replicate does not provide the same reassurance because markets only have an accuracy of about 70% when they predict a successful replication. The p < .500 rule is much easier to implement, but its ability to forecast successes is also around 70%. Thus, neither markets nor a simple statistical rule are accurate enough to avoid actual replication studies.
Meta-Analysis
The main problem of prediction markets and other forecasting projects is that single studies are rarely enough to provide evidence that is strong enough to evaluate theoretical claims. It is therefore not particularly important whether one study can be replicated successfully or not, especially when direct replications are difficult or impossible. For this reason, psychologists have relied for a long time on meta-analyses of similar studies to evaluate theoretical claims.
It is surprising that prediction markets have forecasted the outcome of studies that have been replicated many times before the outcome of a new replication study was predicted. Take the replication of Schwarz, Strack, and Mai (1991) in Many Labs 2 as an example. This study manipulated the item-order of questions about marital satisfaction and life-satisfaction and suggested that a question about marital satisfaction can prime information that is used in life-satisfaction judgments. Schimmack and Oishi (2005) conducted a meta-analysis of the literature and showed that the results by Schwarz et al. (1991) were unusual and that the actual effect size is much smaller. Apparently, the market participants were unaware of this meta-analysis and predicted that the original result would replicate successfully (probability of success = 72%). Contrary to the market, the study failed to replicate. This example suggests that meta-analyses might be more valuable than prediction markets or the p-value of a single study.
The main obstacle for the use of meta-analyses is that many published meta-analyses fail to take selection for significance into account and overestimate replicability. However, new statistical methods that correct for selection bias may address this problem. The R-Index is a rather simple tool that allows to correct for selection bias in small sets of studies. I use the article by Nairne et al. (2008) that was used for the OSC project as an example. The replication project focused on Study 2 that produced a p-value of .026. Based on this weak evidence alone, the R-Index would predict a replication failure (observed power = .61, inflation = .39, R-Index = .61 – .39 = .22). However, Study 1 produced much more convincing evidence for the effect, p = .0007. If this study had been picked for the replication attempt, the R-Index would have predicted a successful outcome (observed power = .92, inflation = .08, R-Index = .84). A meta-analysis would average across the two power estimates and also predict a successful replication outcome (mean observed power = .77, inflation = .23, R-Index = .53). The actual replication study was significant with p = .007 (observed power = .77, inflation = .23, R-Index = .53). A meta-analysis across all three studies also suggests that the next study will be a successful replication (R-Index = .53), but the R-Index also shows that replication failures are likely because the studies have relatively low power. In short, prediction markets may be useful when only a single study is available, but meta-analysis are likely to be superior predictors of replication outcomes when prior replication studies are available.
Conclusion
Gordon et al. (2021) conducted a meta-analysis of 103 studies that were included in prediction markets to forecast the outcome of replication studies. The results show that prediction markets can forecast replication outcomes above chance levels, but the value of this information is limited. Without actual replication studies, it remains unclear which published results can be trusted or not. Statistical methods that simply focus on the strength of evidence in original studies perform nearly as well and are much easier to use to make sense of thousands of published articles. However, even these methods have a high failure rate. The best solution to this problem is to rely on meta-analyses of studies rather than to predict the outcome of a single study. In addition to meta-analyses, it will be necessary to conduct new studies that are conducted with high scientific integrity to provide solid empirical foundations for psychology.