Peer Reviewed by Editors of Biostatistics “You have produced a nicely written paper that seems to be mathematically correct and I enjoyed reading” (Professor Dimitris Rizopoulos & Professor Sherri Rose)
Estimating the false discovery risk in medical journals
Ulrich Schimmack∗
Department of Psychology, University of Toronto Mississauga 3359 Mississauga Road N. Mississauga, Ontario Canada ulrich.schimmack@utoronto.ca
Frantisek Bartos
Department of Psychology, University of Amsterdam;
Institute of Computer Science, Czech Academy of Sciences, Prague, Czech Republic
Abstract
Jager and Leek (2014) proposed an empirical method to estimate the false discovery rate in top medical journals and found a false discovery rate of 14%. Their work received several critical com- ments and has had relatively little impact on meta-scientific discussions about medical research. We build on Jager and Leek’s work and present a new way to estimate the false discovery risk. Our results closely reproduce their original finding with a false discovery rate of 13%. In addition, our method shows clear evidence of selection bias in medical journals, but the expected discovery rate is 30%, much higher than we would expect if most published results were false. Our results provide further evidence that meta-science needs to be built on solid empirical foundations.
Keywords: False discovery rate; Meta-analysis; Science-wise false discovery rate; Significance testing; Statistical powe
Introduction
The successful development of vaccines against Covid-19 provides a vivid example of a scientific success story. At the same time, many sciences are facing a crisis of confidence in published results. The influential article “Why most published research findings are false” suggested that many published significant results are false discoveries (Ioannidis, 2005). One limitation of Ioannidis’s article was the reliance on a variety of unproven assumptions. For example, Ioannidis assumed that only 1 out of 11 exploratory epidemiological studies tests a true hypothesis. To address this limitation, Jager and Leek (2014) developed a statistical model to estimate the percentage of false- positive results in a set of significant p-values. They applied their model to 5,322 p-values from medical journals and found that only 14% of the significant results may be false-positives. This is a sizeable percentage, but it is much lower than the false-positive rates predicted by Ioannidis. Although Jager and Leek’s article was based on actual data, the article had a relatively week impact on discussions about false-positive risks. So far, the article has received only 73 citations in WebOfScience. In comparison, Ioannidis’s purely theoretical article has been cited 518 times in 2020 alone. We believe that Jager and Leek’s article deserves a second look and that discussions about the credibility of published results benefit from empirical investigations
Estimating the False Discovery Risk
To estimate the false discovery rate, Jager and Leek developed a model with two populations of studies. One population includes studies in which the null-hypothesis is true (H0). The other population includes studies in which the null-hypothesis is false; that is, the alternative hypothesis is true (H1). The model assumes that the observed distribution of significant p-values is a mixture of these two populations.
One problem for this model is that it can be difficult to distinguish between studies in which H0 is true and studies in which H1 is true, but it was tested with low statistical power. Furthermore, the distinction between the point-zero null-hypothesis, the nil-hypothesis (Cohen, 1994), and alternative hypotheses with very small effect sizes is rather arbitrary. Many effect sizes may not be exactly zero but too small to have practical significance. This makes it difficult to distinguish clearly between the two populations of studies and estimates based on models that assume distinct populations may be unreliable.
To avoid the distinction between two populations of p-values, we distinguish between the false discovery rate and the false discovery risk. The false discovery risk does not aim to estimate the actual rate of H0 among significant p-values. Rather, it provides an estimate of the worst-case scenario with the highest possible amount of false-positive results. To estimate the false discovery risk, we take advantage of Soric’s (1989) insight that the maximum false discovery rate is limited by statistical power to detect true effects. When power is 100%, all non-significant results are produced by testing false hypotheses (H0). As this scenario maximizes the number of non-significant H0, it also maximizes the number of significant H0 tests and the false discovery rate. Soric showed that the maximum false discovery rate is a direct function of the discovery rate. For example, if 100 studies produce 30 significant results, the discovery rate is 30%. And when the discovery rate is 30%, the maximum false discovery risk with α = 5% is ≈ 0.12. In general, the false discovery risk is a simple transformation of the discovery rate, such as
false discovery risk = (1/discovery rate − 1) × (α/(1 − α)).
Our suggestion to estimate the false discovery risk rather than the actual false discovery rate addresses concerns about Jager and Leek’s two-population model that were raised in several commentaries (Gelman and O’Rourke, 2014; Benjamini and Hechtlinger, 2014; Ioannidis, 2005; Goodman, 2014).
If all conducted hypothesis tests were reported, the false discovery risk could be determined simply by computing the percentage of significant results. However, it is well-known that journals are more likely to publish significant results than non-significant results. This selection bias renders the observed discovery rate in journals uninformative (Bartoˇs and Schimmack, 2021; Brunner and Schimmack, 2020). Thus, a major challenge for any empirical estimates of the false discovery risk is to take selection bias into account.
Biostatistics published several commentaries to Jager and Leek’s article. A commentary by Ioannidis (2014) may have contributed to the low impact of Jager and Leek’s article. Ioannidis claims that Jager and Leek’s results can be ignored because they used automatic extraction of p-values, a wrong method, and unreliable data. We address these concerns by means of a new extraction method, a new estimation method, and new simulation studies that evaluate the performance of Jager and Leek’s original method and a new method. To foreshadow the main results, we find that Jager and Leek’s method can sometimes produce biased estimates of the false discovery risk. However, our improved method produces even lower estimates of the false discovery risk. When we applied this method to p-values from medical journals, we obtained an estimate of 13% that closely matches Jager and Leek’s original results. Thus, although Ioannidis (2014) raised some valid objections, our results provide further evidence that false discovery rates in medical research are much lower than Ioannidis (2005) predicted.
Z-curve
Jager and Leek (2014) proposed a selection model that could be fitted to the observed distribution of significant p-values. This model assumed a flat distribution for p-values from the H0 population and a beta distribution for p-values from the H1 population. A single beta distribution can only approximate the actual distribution of p-values; a better solution is to use a mixture of several beta-distributions or, alternatively, convert the p-values into z-scores and model the z-scores with several truncated normal distributions (similar to the suggestion by Cox, 2014). Since reported p-values often come from two-sided tests, the resulting z-scores need to be converted into absolute z-scores that can be modeled as a mixture of truncated folded normal distributions (Bartoˇs and Schimmack, 2021). The weights of the mixture components can then be used to compute the average power of studies that produced a significant result. As this estimate is limited to the set of studies that were significant, we refer to it as the average power after selection for statistical significance. As power determines the outcomes of replication studies, the average power after selection for statistical significance is an estimate of the expected replication rate.
Although an estimate of the expected replication rate is valuable in its own right, it does not provide an estimate of the false discovery risk because it is based on the population of studies after selection for statistical significance. To estimate the expected discovery rate, z-curve models the selection process operating on the significance level and assumes that studies produce a statistically significant result proportionally to their power. For example, studies with 50% power produce one non-significant result for every significant result and studies with 20% power produce four statistically non-significant results for every significant result. It is therefore possible to estimate the average power before selection of statistical significance based on the weights of the mixture components that are obtained by fitting the model to only significant results. As power determines the percentage of significant results, we refer to average power before selection for statistical significance as the expected discovery rate.Extensive simulation studies have demonstrated that z-curve produces good large-sample estimates of the expected discovery rate with exact p-values (Bartoˇs and Schimmack, 2021). Moreover, these simulation studies showed that z-curve produces robust confidence intervals with good coverage. As the false discovery risk is a simple transformation of the EDR, these confidence intervals also provide confidence intervals for estimates of the false discovery risk. To use z-curve for p-values from medical abstracts, we extended z-curve’s expectation-maximization (EM) algorithm (Dempster and others, 1977) to incorporate rounding and censoring similarly to Jager and Leek’s model. To demonstrate that z-curve can obtain valid estimates of the false discovery risk for medical journals, we conducted a simulation study that compared Jager and Leek’s method with z-curve.
Simulation Study
We extended the simulation performed by Jager and Leek in several ways. Instead of simulating H1 p-values directly from a beta distribution, we used power estimates from individual studies based on meta-analyses (Lamberink and others, 2018) and simulated p-values of two-sided z-tests with corresponding power (excluding all power estimates based meta-analyses with non-significant results). This allows us to assess the performance of the methods under heterogeneity of power to detect H1 corresponding to the actual literature. To simulate H0 p-values, we used a uniform distribution.
We manipulated the true false discovery rate from 0 to 1 with a step size of 0.01 and simulated 10,000 observed significant p-values. Similarly to Jager and Leek, we performed four simulation scenarios with an increasing percentage of imprecisely reported p-values. Scenario A used exact p-values, scenario B rounded p-values to three decimal places (with p-values lower than 0.001 censored at 0.001), scenario C rounds 20% p-values to two decimal places (with p-values rounded to 0 censored at 0.01), and scenario D first rounds 20% p-values to two decimal places and further censors 20% p-values at on of the closest ceilings (0.05, 0.01, or 0.001).
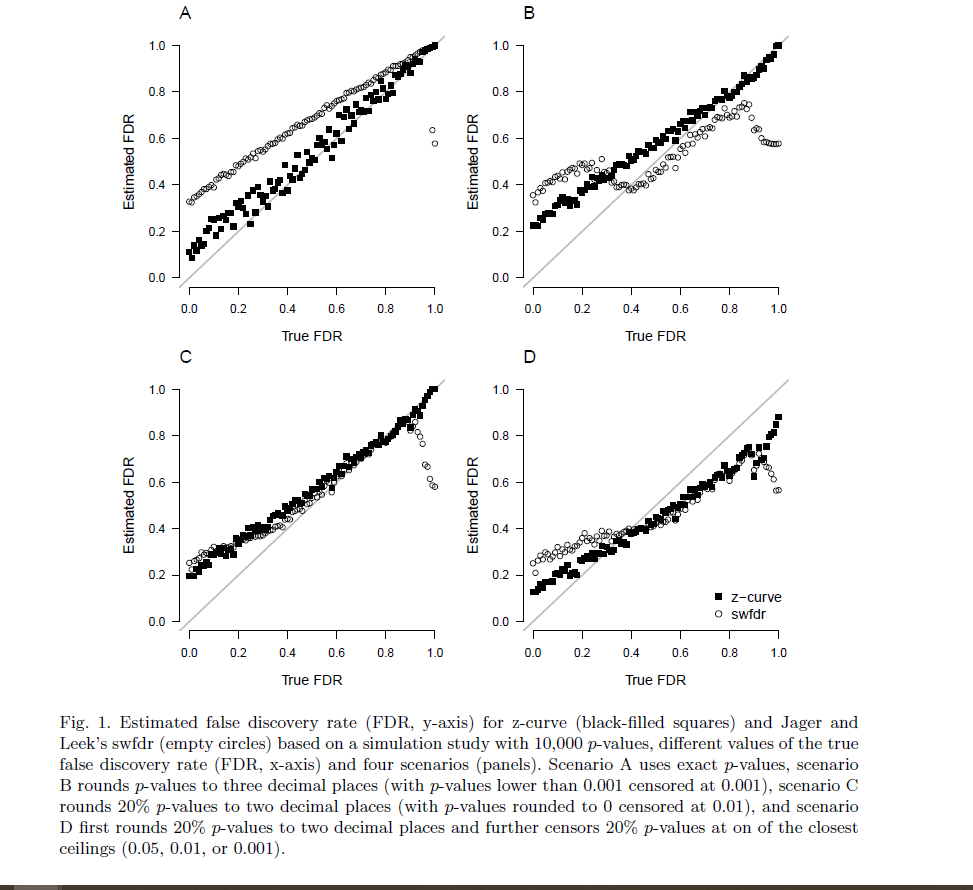
Figure 1 displays the true (x-axis) vs. estimated (y-axis) false discovery rate (FDR) for Jager and Leek’s method and the false discovery risk for z-curve across the different scenarios (panels). We see that when precise p-values are reported (panel A in the upper left corner), z-curve can handle the heterogeneity in power very well across the whole range of false discovery rates and produces accurate estimates of false discovery risks. Higher estimate than the actual false discovery rates are expected because the false discovery risk is an estimate of the maximum false discovery rate. Discrepancies are especially expected when power of true hypothesis tests is low. For the simulated scenarios, the discrepancies are less than 20 percentage points and decrease as the true false discovery rate increases. Even though Jager and Leek’s method aims to estimate the true false discovery rates, it produces higher estimates than z-curve. This is problematic because the method produces inflated estimates of the true false discovery rate. Even if the estimates were interpreted as maximum estimates, the method is less sensitive to the actual variation in the false discovery rate than the z-curve method.
Panel B shows that the z-curve method produces similar results when p-values are rounded to three decimals. The Jager and Leek’s method however experiences estimation issues, especially in the lower spectrum of the true false discovery rate since the current implementation only allows to deal with rounding to two decimal places (we also tried specifying the p-values as a rounded input; however, the optimizing routine failed with several errors).
Panel C shows a surprisingly similar performance of the two methods when 20% of p-values are rounded to two decimals, except for very high levels of true false discovery rates, where Jager and Leek’s method starts to underestimate the false discovery rate. Despite the similar performance, the results have to be interpreted as estimates of the false discovery risk (maximum false discovery rate) because both methods overestimate the true false discovery rate for low false discovery rates.
Panel D shows that both methods have problems when 20% of p-values are at the closest ceiling of .05, .01, or .001 without providing clear information about the exact p-value. Z-curve does a little bit better than Jager and Leek’s method. Underestimation of true false discovery rates over 40% is not a serious problem because any actual false discovery rate over 40% is unacceptably high. One solution to the underestimation problem is to exclude p-values that are reported in this way from analyses.
Root mean square error and bias of the false discovery rate estimates for each scenario summa- rized in Table 1 show that z-curve produces estimates with considerably lower root mean square error. The results for bias show that both methods tend to produce higher estimates than the true false discovery rate. For z-curve this is expected because it aims to estimate the maximum false discovery rate. It would only be a problem if estimates of the false discovery risk were lower than the actual false discovery rate. This is only the case in Scenario D, but as shown previously, underestimation only occurs when the true false discovery rate is high.

To summarize, our simulation confirms that Jager and Leek’s method provides meaningful estimates of the false discovery risk and that the method is likely to overestimate the true false discovery rate. Thus, it is likely that the reported estimate of 14% for top medical journals overestimates the actual false discovery rate. Our results also show that z-curve improves over the original method and that the modifications can handle rounding and imprecise reporting when the false discovery rates are below 40%.
Application to Medical Journals
Commentators raised more concerns about Jager and Leek’s mining of p-values than about their estimation method. To address these concerns, we extended Jager and Leek’s data mining approach in the following ways; (1) we extracted p-values only from abstracts labeled as “randomized controlled trial” or “clinical trial” as suggested by Goodman (2014); Ioannidis (2014); Gelman and O’Rourke (2014), (2) we improved the regex script for extracting p-values to cover more possible notations as suggested by Ioannidis (2014), (3) we extracted confidence intervals from abstracts not reporting p-values as suggested by Ioannidis (2014); Benjamini and Hechtlinger (2014). We further scraped p-values from abstracts in “PLoS Medicine” to compare the false discovery rate estimates to a less-selective journal as suggested by Goodman (2014). Finally, we randomly subset the scraped p-values to include only a single p-value per abstract in all analyses, thus breaking the correlation between the estimates as suggested by Goodman (2014). Although there are additional limitations inherent to the chosen approach, these improvements, along with our improved estimation method, make it possible to test the prediction by several commentators that the false discovery rate is well above 14%.

We executed the scraping protocol on July 2021 and scraped abstracts published since 2000 (see Table 2 for a summary of the scraped data). Interactive visualization of the individual abstracts and scraped values can be accessed at https://tinyurl.com/zcurve-FDR.

Figure 2 visualizes the estimated false discovery rates based on z-curve and Jager and Leek’s method based on scraped abstracts from clinical trials and randomized controlled trials and further divided by journal and whether the article was published before (and including) 2010 (left) or after 2010 (right). We see that, in line with the simulation results, Jager and Leek’s method produces slightly higher false discovery rate estimates. Furthermore, z-curve produced considerably wider bootstrapped confidence intervals, suggesting that the confidence interval reported by Jager and Leek (± 1 percentage point) was too narrow.
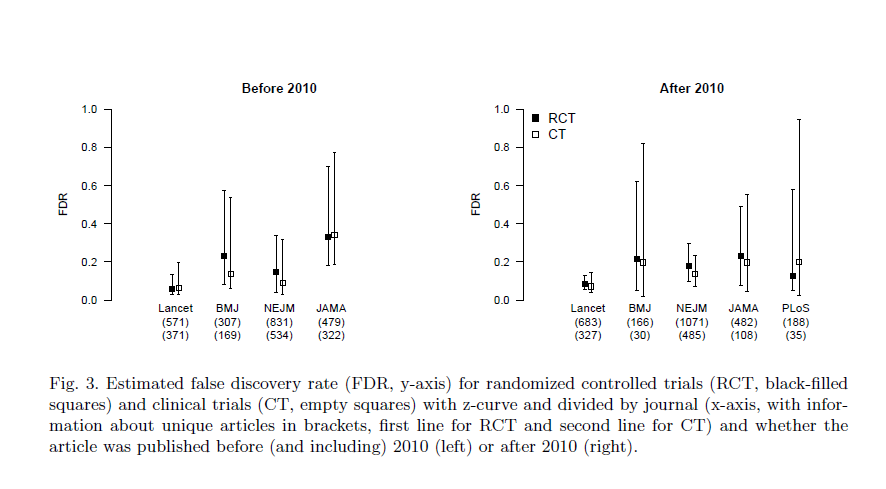
A comparison of the false discovery estimates based on data before (and including) 2010 and after 2010 shows that confidence intervals overlap, suggesting that false discovery rates have not changed. Separate analyses based on clinical trials and randomized controlled trials also showed no significant differences (see Figure 3). Therefore, to reduce the uncertainty about the false discovery rate, we estimate the false discovery rate for each journal irrespective of publication year. The resulting false discovery rate estimates based z-curve and Jager and Leek’s method are summarized in Table 3. We find that all false discovery rate estimates fall within a .05 to .30 interval. Finally, further aggregating data across the journals provides a false discovery rate estimate of 0.13, 95% [0.08, 0.21] based on z-curve and 0.19, 95% [0.17, 0.20] based on Jager and Leek’s method. This finding suggests that Jager and Leek’s extraction method slightly underestimate the false discovery rate, whereas their model overestimated the false discovery rate.
Additional Z-Curve Results
So far, we used the expected discovery rate only to estimate the false discovery risk, but the expected discovery rate provides valuable information in itself. Ioannidis’s predictions of the false discovery rate were based on scenarios that assumed that less than 10% of all hypothesis are true hypothesis. The same assumption was made to recommend lowering α from .05 to .005 (Benjamin and others, 2018). If all true hypotheses were tested with 100% power, the discovery rate would match the percentage of true hypotheses plus the false-positive results; 10% + 90% × .05 = 14.5%. Because the actual power is less than 100%, the discovery rate would be even less, but the estimated expected discovery rate for top medical journals is 30% with a confidence interval ranging from 20% to 41%. Thus, our results suggest that previous speculations about discovery rates were overly pessimistic.

The expected discovery rate also provides valuable information about the extent of selection bias in medical journals. While the expected discovery rate is only 30%, the observed discovery rate (i.e., the percentage of significant results in abstracts) is more than double (69.7%). This discrepancy is visible in Figure 4. The histogram of observed non-significant z-scores does not match the predicted distribution (blue curve). This evidence of selection bias implies that reported effect sizes are inflated by selection bias. Thus, follow-up studies need to adjust effect sizes when planning the sample sizes via power analyses.
Z-curve also provides information about the replicability of significant results in medical abstracts. The expected replication rate is 65% with a confidence interval ranging from 61% to 69%. This result suggests that sample sizes should be increased to meet the recommended level of 80% power. Furthermore, this estimate may be overly optimistic because comparisons of actual replication rates and z-curve predictions show lower success rates for actual replication studies (Bartoˇs and Schimmack, 2021). One reason could be that exact replication studies are impossible and changes in population will result in lower power due to selection bias and regression to the mean. In the worst case, the actual replication rate might be as low as the expected discovery rate. Thus, our results predict that the success rate of actual replication studies in medicine will be somewhere between 30% and 65%.
Finally, z-curve can be used to adjust the significance level α retrospectively to maintain a false discovery risk of less than 5% Goodman. To do so, it is only necessary to compute the expected discovery rate for different levels of α. With α = .01, the expected discovery rate decreases to 20% and the false discovery risk decreases to 4%. Adjusting α to the recommended level of .005 reduced the expected discovery rate to 17% and the false discovery risk to 2%. Based on these results, it is possible to use α = .01 as a criterion to reject the null-hypothesis while maintaining a false positive risk of 5%.
Discussion
Like many other human activities, science relies on trust. Over the past decade, it has become clear that some aspects of modern science undermine trust. The biggest problem remains the prioritization of new discoveries that meet the traditional threshold of statistical significance. The selection for significance has many undesirable consequences. Although medicine has responded to this problem by demanding preregistration of clinical trials, our results suggest that selection for significance remains a pervasive problem in medical research. As a result, the observed discovery rate and reported effect sizes provide misleading information about the robustness of published results. To maintain trust in medical research, it is important to take selection bias into account. Concerns about the replicability of published results have led to the emergence of meta- science as an active field of research over the past decade. Unlike meta-physics, meta-science is an empirical enterprise that uses data to investigate science. Data can range from survey studies of research practices to actual replication studies. Jager and Leek made a valuable contribution to meta-science by developing a method to estimate the false discovery rate based on published p-values using a statistical model that takes selection bias into account. Their work stimulated discussion, but their key finding that false discovery rates in medicine are not at an alarmingly high rate was ignored. We followed up on Jager and Leek’s seminal contribution with a different estimation model and an improved extraction method to harvest results from medical abstracts. Despite these methodological improvements, our results firmly replicated Jager and Leek’s key finding that false discovery rates in top medical journals are between 10% and 20%.
We also extended the meta-scientific investigation of medical research in several ways. First, we demonstrated that the false discovery risk can be reduced to less than 5% by lowering the criterion for statistical significance to .01. This recommendation is similar to other proposals to lower α to .005, but our proposal is based on empirical data. Moreover, the α level can be modified for different fields of studies or it can be changed in the future in response to changes in research practices. Thus, rather than recommending one fixed α, we recommend to justify α (Lakens and others, 2018). Fields with low discovery rates should use a lower α than fields with high discovery rates to maintain a false discovery risk below 5%.
We also demonstrated that medical journals have substantial selection bias. Whereas the percentage of significant results in abstracts is over 60%, the expected discovery rate is only 30%. This test for selection bias is important because it would be unnecessary to use selection models if selection bias were negligible. Evidence of substantial selection bias may also help to change publication practices in order to reduce selection bias. For example, journals could be evaluated on the basis of the amount of selection bias just like they are being evaluated in terms of impact factors.
Finally, we provided evidence that the average power of studies with significant results is 65%. As power increases for studies with lower p-values, this estimate implies that power for studies that are significant at p < .01 to produce a p-value below .05 in a replication study would be even higher. Based on these findings, we would predict that at least 50% of results that achieved p < .01 can be successfully replicated. This is comparable to cognitive psychology, where 50% of significant results at p < .05 could be successfully replicated (Open Science Collaboration, 2015).
Limitations and Future Directions
Even though we were able to address several of the criticisms of Jager and Leek’s seminal article, we were unable to address all of them. The question is whether the remaining concerns are sufficient to invalidate our results. We think this is rather unlikely because our results are in line with findings in other fields. The main remaining concern is that mining p-values and confidence intervals from abstracts creates a biased sample of results. The only way to address this concern is to read the actual articles and to pick the focal hypothesis test for the z-curve analysis. Unfortunately, nobody seems to have taken on this daunting task for medical journals. However, social psychologists have hand-coded a large, representative sample of test-statistics (Motyl and others, 2017). The coding used the actual test statistics rather than p-values. Thus, exact p-values were computed and no rounding or truncation problems are present in these data. A z-curve analysis of these data estimated an expected discovery rate of 19%, 95% CI = 6% to 36% (Schimmack, 2020). Given the low replication rate of social psychology, it is not surprising that the expected discovery rate is lower than for medical studies (Open Science Collaboration, 2015). However, even a low expected discovery rate of 19% limits the false discovery risk at 22%, which is not much higher than the false discovery risk in medicine and does not justify the claim that most published results are false. To provide more conclusive evidence for medicine, we strongly encourage hand-coding of medical journals and high powered replication studies. Based on the present results, we predict false positive rates well below 50%.
Software
The zcurve R package is available from https://github.com/FBartos/zcurve/tree/censored.
Supplementary Material
Supplementary Materials including data and R scripts for reproducing the simulations, data scraping, and analyses are available from https://osf.io/y3gae/.
Acknowledgments
Conflict of Interest: None declared.
References
Bartos, Frantisek and Schimmack, Ulrich. (2021). Z-curve 2.0: Estimating replication rates and discovery rates. Meta-Psychology.
Benjamin, Daniel J, Berger, James O, Johannesson, Magnus, Nosek, Brian A, Wagenmakers, E-J, Berk, Richard, Bollen, Kenneth A, Brembs, Bjorn, Brown, Lawrence, Camerer, Colin and others. (2018). Redefine statistical significance. Nature Human Behaviour 2(1), 6–10.
Benjamini, Yoav and Hechtlinger, Yotam. (2014). Discussion: An estimate of the science- wise false discovery rate and applications to top medical journals by jager and leek. Biostatistics 15(1), 13–16.
Brunner, Jerry and Schimmack, Ulrich. (2020). Estimating population mean power under conditions of heterogeneity and selection for significance. Meta-Psychology 4.
Cohen, Jacob. (1994). The earth is round (p ¡.05). American Psychologist 49(12), 997.
Cox, David R. (2014). Discussion: Comment on a paper by jager and leek. Biostatistics 15(1), 16–18.
Dempster, Arthur P, Laird, Nan M and Rubin, Donald B. (1977). Maximum likelihood from incomplete data via the em algorithm. Journal of the Royal Statistical Society: Series B (Methodological) 39(1), 1–22.
Gelman, Andrew and O’Rourke, Keith. (2014). Difficulties in making inferences about scientific truth from distributions of published p-values. Biostatistics 15(1), 18–23.
Goodman, Steven N. (2014). Discussion: An estimate of the science-wise false discovery rate and application to the top medical literature. Biostatistics 15(1), 13–16.
Ioannidis, John PA. (2005). Why most published research findings are false. PLoS medicine 2(8), e124.
Ioannidis, John PA. (2014). Discussion: Why “an estimate of the science-wise false discovery rate and application to the top medical literature” is false. Biostatistics 15(1), 28–36.
Jager, Leah R and Leek, Jeffrey T. (2014). An estimate of the science-wise false discovery rate and application to the top medical literature. Biostatistics 15(1), 1–12.
Lakens, Daniel, Adolfi, Federico G, Albers, Casper J, Anvari, Farid, Apps, Matthew AJ, Argamon, Shlomo E, Baguley, Thom, Becker, Raymond B, Benning, Stephen D, Bradford, Daniel E and others. (2018). Justify your alpha. Nature Human Behaviour 2(3), 168–171.
Lamberink, Herm J, Otte, Willem M, Sinke, Michel RT, Lakens, Daniel, Glasziou, Paul P, Tijdink, Joeri K and Vinkers, Christiaan H. (2018). Statistical power of clinical trials increased while effect size remained stable: an empirical analysis of 136,212 clinical trials between 1975 and 2014. Journal of Clinical Epidemiology 102, 123–128.
Motyl, Matt, Demos, Alexander P, Carsel, Timothy S, Hanson, Brittany E, Melton, Zachary J, Mueller, Allison B, Prims, JP, Sun, Jiaqing, Washburn, An- thony N, Wong, Kendal M and others. (2017). The state of social and personality science: Rotten to the core, not so bad, getting better, or getting worse? Journal of Personality and Social Psychology 113(1), 34.
Open Science Collaboration. (2015). Estimating the reproducibility of psychological science. Science 349(6251).
Schimmack, Ulrich. (2020). A meta-psychological perspective on the decade of replication failures in social psychology. Canadian Psychology/Psychologie canadienne.
Soric, Branko. (1989). Statistical “discoveries” and effect-size estimation. Journal of the American Statistical Association 84(406), 608–610.
But how good is a false discovery rate of 13%? Perhaps what we want to know isn’t what fraction of medical journal articles make wrong conclusions, but what fraction of them are fatally flawed. Fatally flawed articles testing a hypothesis should be correct just by chance half the time, and “26% of medical journal articles are fatally flawed” doesn’t sound very good. Then we have selection bias, which–supposing medical journal articles aren’t ALL fatally flawed, should always reduce the number of wrong conclusions. So perhaps 40% of all medical experiments conducted are fatally flawed, and selection bias reduces this to 26%.
As pointed out in the “article”, we can reduce the FDR to 5%, by setting alpha to .01.
Also, I am not sure what you mean by fatally flawed? Of course, there maybe fraud or other problems that a statistical analysis does not address, but to simply assume that 50% of articles have these flaws seems a bit ad hoc.