Wilson BM, Wixted JT. The Prior Odds of Testing a True Effect in Cognitive and Social Psychology. Advances in Methods and Practices in Psychological Science. 2018;1(2):186-197. doi:10.1177/2515245918767122
Abstract
Wilson and Wixted had a cool idea, but it turns out to be wrong. They proposed that sign errors in replication studies can be used to estimate false positive rates. Here I show that their approach makes a false assumption and does not work.
Introduction
Two influential articles shifted concerns about false positives in psychology from complacency to fear (Ioannidis, 2005; Simmons, Nelson, & Simonsohn, 2011). First, psychologists assumed that false rejections of the null hypothesis (no effect) are rare because the null hypothesis is rarely true. Effects were either positive or negative, but never really zero. In addition, meta-analyses typically found evidence for effects, even assuming biased reporting of studies (Rosenthal, 1979).
Simmons et al. (2011) demonstrated, however, that questionable, but widely used statistical practices can increase the risk of publishing significant results without real effects from the nominal 5% level (p < .05) to levels that may exceed 50% in some scenarios. When only 25% of significant results in social psychology could be replicated, it seemed possible that a large number of the replication failures were false positives (Open Science Collaboration, 2015).
Wilson and Wixted (2018) used the reproducibility results to estimate how often social psychologists test true null hypotheses. Their approach relied on the rate of sign reversals between original and replication estimates. If the null hypothesis is true, sampling error will produce an equal number of estimates in both directions. Thus, a high rate of sign reversals could be interpreted as evidence that many original findings reflect sampling error around a true null. Second, for every sign reversal there is typically a same-sign replication, and Wilson and Wixted treated the remaining same-sign results as reflecting tests of true hypotheses that reliably produce the correct sign.
Let P(SR) be the observed proportion of sign reversals between originals and replications (not conditional on significance). If true effects always reproduce the same sign and null effects produce sign reversals 50% of the time, then the observed SR provides an estimate of the proportion of true null hypotheses that were tested, P(True-H0).
P(True-H0) = 2*P(SR)
Wilson and Wixted further interpreted this quantity as informative about the fraction of statistically significant original results that might be false positives. Wilson and Wixted (2018) found approximately 25% sign reversals in replications of social psychological studies. Under their simplifying assumptions, this implies 50% true null hypotheses in the underlying set of hypotheses being tested, and they used this inference, together with assumptions about significance and power, to argue that false positives could be common in social psychology.
Like others, I thought this was a clever way to make use of sign reversals. The article has been cited only 31 times (WoS, January 6, 2026), and none of the articles critically examined Wilson and Wixted’s use of sign errors to estimate false positive rates.
However, other evidence suggested that false positives are rare (Schimmack, 2026). To resolve the conflict between Wilson and Wixted’s conclusions and other findings, I reexamined their logic and ChatGPT pointed out Wilson and Wixted’s (2018) formula rests on assumptions that need not hold.
The main reason is that it makes the false assumption that tests of true hypotheses do not produce sign errors. This is simply false because studies that test false null hypotheses with low power can still produce sign reversals (Gelman & Carlin, 2014). Moreover, sign reversals can be generated even when the false-positive rate is essentially zero, if original studies are selected for statistical significance and the underlying studies have low power. In fact, it is possible to predict the percentage of sign reversals from the non-centrality of the test statistic under the assumption that all studies have the same power. To obtain 25% sign reversals, all studies could test a false null hypothesis with about 10% power. In that scenario, many replications would reverse sign because estimates are highly noisy, while the original literature could still contain few or no literal false positives if the true effects are nonzero.
Empirical Examination with Many Labs 5
I used the results from ManyLabs5 (Ebersole et al., 2020) to evaluate what different methods imply about the false discovery risk of social psychological studies in the Reproducibility Project, first applying Wilson and Wixted’s sign-reversal approach and then using z-curve (Bartos & Schimmack, 2022; Brunner & Schimmack, 2020).
ManyLabs5 conducted additional replications of 10 social psychological studies that failed to replicate in the Reproducibility Project (Open Science Collaboration, 2015). The replication effort included both the original Reproducibility Project protocols and revised protocols developed in collaboration with the original authors. There were 7 sign reversals in total across the 30 replication estimates. Using Wilson and Wixted’s sign-reversal framework, 7 out of 30 sign reversals (23%) would be interpreted as evidence that approximately 46% of the underlying population effects in this set are modeled as exactly zero (i.e., that H0 is true for about 46% of the effects).
To compare these results more directly to Wilson and Wixted’s analysis, it is necessary to condition on non-significant replication outcomes, because ManyLabs5 selected studies based on replication failure rather than original significance alone. Among the non-significant replication results, 25 sign reversals occurred out of 75 estimates, corresponding to a rate of 33%, which would imply a false-positive rate of approximately 66% under Wilson and Wixted’s framework. Although this estimate is somewhat higher, both analyses would be interpreted as implying a large fraction of false positives—on the order of one-half—among the original significant findings within that framework.
To conduct a z-curve analysis, I transformed the effect sizes (r) in ManyLabs5 (Table 3) into d-values and used the reported confidence intervals to compute standard errors, SE = (d upper − d lower)/3.92, and corresponding z-values, z = d/SE. I fitted a z-curve model that allows for selection on statistical significance (Bartos & Schimmack, 2022; Brunner & Schimmack, 2020) to the 10 significant original results. I fitted a second z-curve model to the 30 replication results, treating this set as unselected (i.e., without modeling selection on significance).

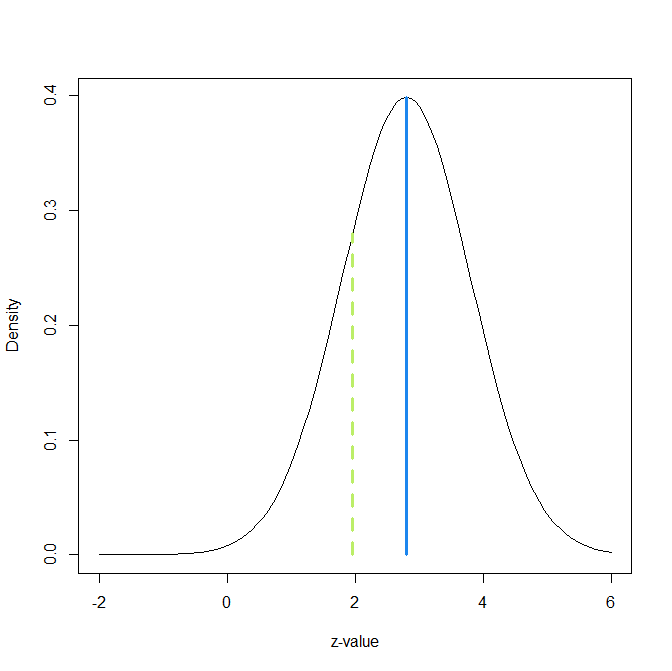
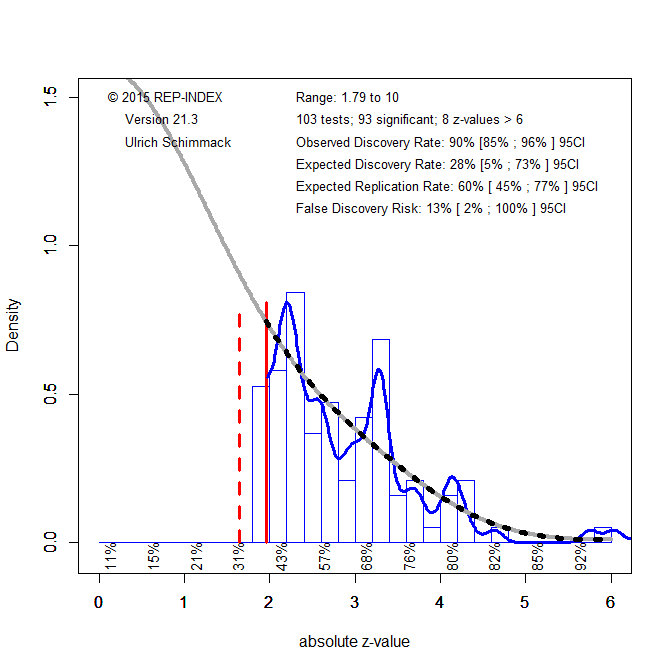
The z-curve for the 10 original results shows evidence consistent with strong selection on statistical significance, despite the small set of studies. Although all original results are statistically significant, the estimated expected discovery rate is only 8%, and the upper limit of the 95% confidence interval is 61%, well below 100%. Visual inspection of the z-curve plot also shows a concentration of results just above the significance threshold (z = 1.96) and none just below it, even though sampling variation does not create a discontinuity between results with p = .04 and p = .06.
The expected replication rate (ERR) is a model-based estimate of the average probability that an exact replication would yield a statistically significant result in the same direction. For the 10 original studies, ERR is 32%, but the confidence interval is wide (3% to 70%). The lower bound near 3% is close to the directional false-alarm rate under a two-sided test when the true effect is zero (α/2 = 2.5%), meaning that the data are compatible with the extreme-null scenario in which all underlying effects are zero and the original significant results reflect selection. This does not constitute an estimate of the false-positive rate; rather, it indicates that the data are too limited to rule out that worst-case possibility. At the same time, the same results are also compatible with an alternative scenario in which all underlying effects are non-zero but power is low across studies.
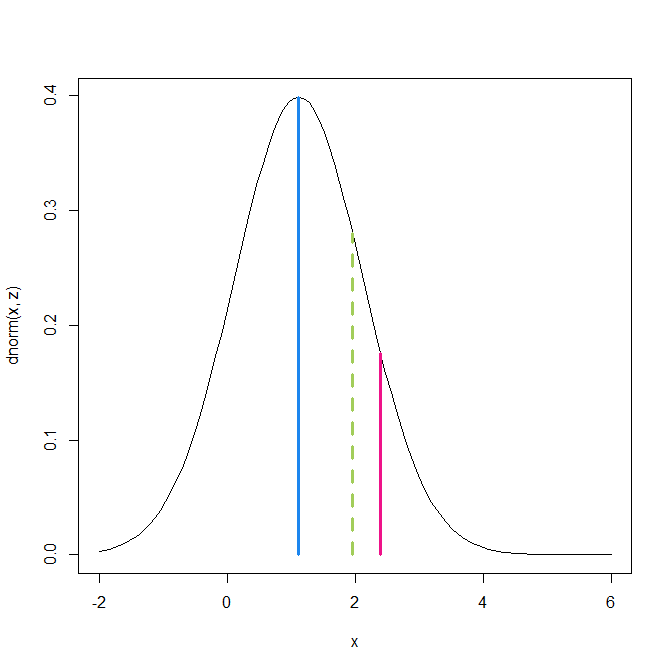
For the 30 replication results, the z-curve model provides a reasonable fit to the observed distribution, which supports the use of a model that does not assume selection on statistical significance. In this context, the key quantity is the expected discovery rate (EDR), which can be interpreted as a model-based estimate of the average true power of the 30 replication studies. The estimated EDR is 17%. This value is lower than the corresponding estimate based on the original studies, despite increases in sample sizes and statistical power in the replication attempts. This pattern illustrates that ERR estimates derived from biased original studies tend to be overly optimistic predictors of actual replication outcomes (Bartos & Schimmack, 2022). In contrast, the average power of the replication studies can be estimated more directly because the model does not need to correct for selection bias.
A key implication is that the observed rate of sign reversals (23%) could have been generated by a set of studies in which all null hypotheses are false but average power is low (around 17%). However, the z-curve analysis also shows that even a sample of 30 studies is insufficient to draw precise conclusions about false positive rates in social psychology. Following Sorić (1989), the EDR can be used to derive an upper bound on the false discovery rate (FDR), that is, the maximum proportion of false positives consistent with the observed discovery rate. Based on this approach, the FDR ranges from 11% to 100%. To rule out high false positive risks, studies would need higher power, narrower confidence intervals, or more stringent significance thresholds.
Conclusion
This blog post compared Wilson and Wixted’s use of sign reversals to estimate false discovery rates with z-curve estimates of false discovery risk. I showed that Wilson and Wixted’s approach rests on implausible assumptions. Most importantly, it assumes that sign reversals occur only when the true effect is exactly zero. It does not allow for sign reversals under nonzero effects, which can occur when all null hypotheses are false but tests of these hypotheses have low power.
The z-curve analysis of 30 replication estimates in the ML5 project shows that low average power is a plausible explanation for sign reversals even without invoking a high false-positive rate. Even with the larger samples used in ML5, the data are not precise enough to draw firm conclusions about false positives in social psychology. A key problem remains the fundamental asymmetry of NHST: it makes it possible to reject null hypotheses, but it does not allow researchers to demonstrate that an effect is (practically) zero without very high precision.
The solution is to define the null hypothesis as a region of effect sizes that are so small that they are practically meaningless. The actual level may vary across domains, but a reasonable default is Cohen’s criterion for a small effect size, r = .1 or d = .2. By this criterion, only two of the replication studies in ML5 had sample sizes that were large enough to produce results that ruled out effect sizes of at least r = .1 with adequate precision. Other replications still lacked precision to do so. Interestingly, five of the ten original statistically significant results also failed to rule out effect sizes of at least r = .1, because their confidence intervals included r = .10. Thus, these studies at best provided suggestive evidence about the sign of an effect, but no evidence that the effect size is practically meaningful.
The broader lesson is that any serious discussion of false positives in social psychology requires (a) a specification of what counts as an “absence of an effect” in practice, using minimum effect sizes of interest that can be empirically tested, (b) large sample sizes that allow precise estimation of effect sizes, and (c) unbiased reporting of results. A few registered replication reports come close to this ideal, but even these results have failed to resolve controversies because effect sizes close to zero in the predicted direction remain ambiguous without a clearly specified threshold for practical importance. To avoid endless controversies and futile replication studies, it is necessary to specify minimum effect sizes of interest before data are collected.
In practice, this means designing studies so that the confidence interval can exclude effects larger than the minimum effect size of interest, rather than merely achieving p < .05 against a point null of zero. Conceptually, this is closely related to specifying the null hypothesis as a minimum effect size and using a directional test, rather than using a two-sided test against a nil null of exactly zero. Put differently, the problem is not null hypothesis testing per se, but nil hypothesis testing (Cohen, 1994).