Wilson BM, Wixted JT. The Prior Odds of Testing a True Effect in Cognitive and Social Psychology. Advances in Methods and Practices in Psychological Science. 2018;1(2):186-197. doi:10.1177/2515245918767122
Abstract
Wilson and Wixted had a cool idea, but it turns out to be wrong. They proposed that sign errors in replication studies can be used to estimate false positive rates. Here I show that their approach makes a false assumption and does not work.
Introduction
Two influential articles shifted concerns about false positives in psychology from complacency to fear (Ioannidis, 2005; Simmons, Nelson, & Simonsohn, 2011). First, psychologists assumed that false rejections of the null hypothesis (no effect) are rare because the null hypothesis is rarely true. Effects were either positive or negative, but never really zero. In addition, meta-analyses typically found evidence for effects, even assuming biased reporting of studies (Rosenthal, 1979).
Simmons et al. (2011) demonstrated, however, that questionable, but widely used statistical practices can increase the risk of publishing significant results without real effects from the nominal 5% level (p < .05) to levels that may exceed 50% in some scenarios. When only 25% of significant results in social psychology could be replicated, it seemed possible that a large number of the replication failures were false positives (Open Science Collaboration, 2015).
Wilson and Wixted (2018) used the reproducibility results to estimate how often social psychologists test true null hypotheses. Their approach relied on the rate of sign reversals between original and replication estimates. If the null hypothesis is true, sampling error will produce an equal number of estimates in both directions. Thus, a high rate of sign reversals could be interpreted as evidence that many original findings reflect sampling error around a true null. Second, for every sign reversal there is typically a same-sign replication, and Wilson and Wixted treated the remaining same-sign results as reflecting tests of true hypotheses that reliably produce the correct sign.
Let P(SR) be the observed proportion of sign reversals between originals and replications (not conditional on significance). If true effects always reproduce the same sign and null effects produce sign reversals 50% of the time, then the observed SR provides an estimate of the proportion of true null hypotheses that were tested, P(True-H0).
P(True-H0) = 2*P(SR)
Wilson and Wixted further interpreted this quantity as informative about the fraction of statistically significant original results that might be false positives. Wilson and Wixted (2018) found approximately 25% sign reversals in replications of social psychological studies. Under their simplifying assumptions, this implies 50% true null hypotheses in the underlying set of hypotheses being tested, and they used this inference, together with assumptions about significance and power, to argue that false positives could be common in social psychology.
Like others, I thought this was a clever way to make use of sign reversals. The article has been cited only 31 times (WoS, January 6, 2026), and none of the articles critically examined Wilson and Wixted’s use of sign errors to estimate false positive rates.
However, other evidence suggested that false positives are rare (Schimmack, 2026). To resolve the conflict between Wilson and Wixted’s conclusions and other findings, I reexamined their logic and ChatGPT pointed out Wilson and Wixted’s (2018) formula rests on assumptions that need not hold.
The main reason is that it makes the false assumption that tests of true hypotheses do not produce sign errors. This is simply false because studies that test false null hypotheses with low power can still produce sign reversals (Gelman & Carlin, 2014). Moreover, sign reversals can be generated even when the false-positive rate is essentially zero, if original studies are selected for statistical significance and the underlying studies have low power. In fact, it is possible to predict the percentage of sign reversals from the non-centrality of the test statistic under the assumption that all studies have the same power. To obtain 25% sign reversals, all studies could test a false null hypothesis with about 10% power. In that scenario, many replications would reverse sign because estimates are highly noisy, while the original literature could still contain few or no literal false positives if the true effects are nonzero.
Empirical Examination with Many Labs 5
I used the results from ManyLabs5 (Ebersole et al., 2020) to evaluate what different methods imply about the false discovery risk of social psychological studies in the Reproducibility Project, first applying Wilson and Wixted’s sign-reversal approach and then using z-curve (Bartos & Schimmack, 2022; Brunner & Schimmack, 2020).
ManyLabs5 conducted additional replications of 10 social psychological studies that failed to replicate in the Reproducibility Project (Open Science Collaboration, 2015). The replication effort included both the original Reproducibility Project protocols and revised protocols developed in collaboration with the original authors. There were 7 sign reversals in total across the 30 replication estimates. Using Wilson and Wixted’s sign-reversal framework, 7 out of 30 sign reversals (23%) would be interpreted as evidence that approximately 46% of the underlying population effects in this set are modeled as exactly zero (i.e., that H0 is true for about 46% of the effects).
To compare these results more directly to Wilson and Wixted’s analysis, it is necessary to condition on non-significant replication outcomes, because ManyLabs5 selected studies based on replication failure rather than original significance alone. Among the non-significant replication results, 25 sign reversals occurred out of 75 estimates, corresponding to a rate of 33%, which would imply a false-positive rate of approximately 66% under Wilson and Wixted’s framework. Although this estimate is somewhat higher, both analyses would be interpreted as implying a large fraction of false positives—on the order of one-half—among the original significant findings within that framework.
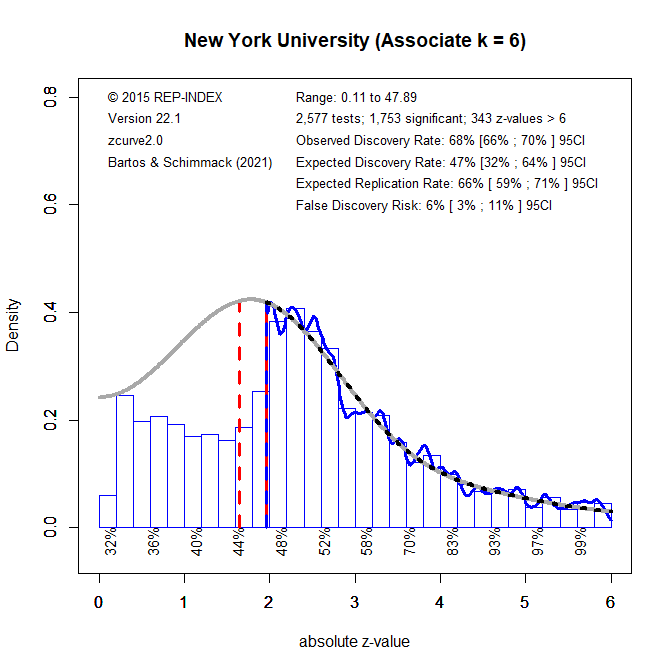
To conduct a z-curve analysis, I transformed the effect sizes (r) in ManyLabs5 (Table 3) into d-values and used the reported confidence intervals to compute standard errors, SE = (d upper − d lower)/3.92, and corresponding z-values, z = d/SE. I fitted a z-curve model that allows for selection on statistical significance (Bartos & Schimmack, 2022; Brunner & Schimmack, 2020) to the 10 significant original results. I fitted a second z-curve model to the 30 replication results, treating this set as unselected (i.e., without modeling selection on significance).
The z-curve for the 10 original results shows evidence consistent with strong selection on statistical significance, despite the small set of studies. Although all original results are statistically significant, the estimated expected discovery rate is only 8%, and the upper limit of the 95% confidence interval is 61%, well below 100%. Visual inspection of the z-curve plot also shows a concentration of results just above the significance threshold (z = 1.96) and none just below it, even though sampling variation does not create a discontinuity between results with p = .04 and p = .06.
The expected replication rate (ERR) is a model-based estimate of the average probability that an exact replication would yield a statistically significant result in the same direction. For the 10 original studies, ERR is 32%, but the confidence interval is wide (3% to 70%). The lower bound near 3% is close to the directional false-alarm rate under a two-sided test when the true effect is zero (α/2 = 2.5%), meaning that the data are compatible with the extreme-null scenario in which all underlying effects are zero and the original significant results reflect selection. This does not constitute an estimate of the false-positive rate; rather, it indicates that the data are too limited to rule out that worst-case possibility. At the same time, the same results are also compatible with an alternative scenario in which all underlying effects are non-zero but power is low across studies.
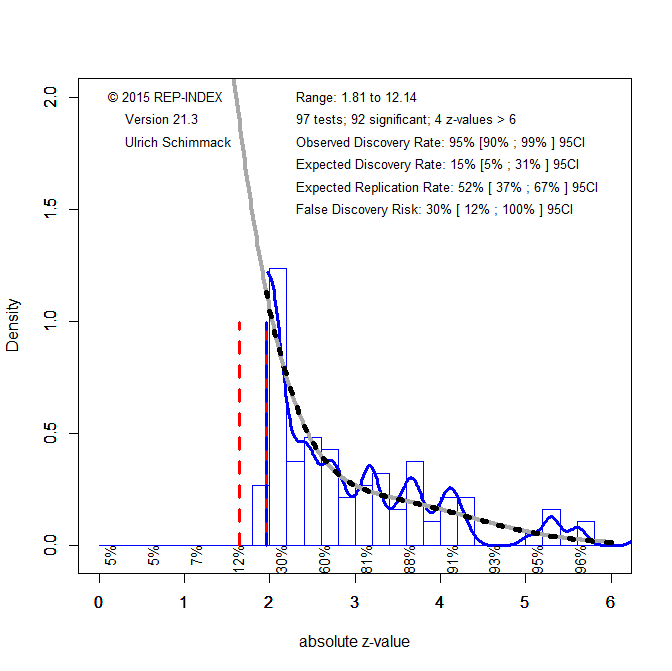
For the 30 replication results, the z-curve model provides a reasonable fit to the observed distribution, which supports the use of a model that does not assume selection on statistical significance. In this context, the key quantity is the expected discovery rate (EDR), which can be interpreted as a model-based estimate of the average true power of the 30 replication studies. The estimated EDR is 17%. This value is lower than the corresponding estimate based on the original studies, despite increases in sample sizes and statistical power in the replication attempts. This pattern illustrates that ERR estimates derived from biased original studies tend to be overly optimistic predictors of actual replication outcomes (Bartos & Schimmack, 2022). In contrast, the average power of the replication studies can be estimated more directly because the model does not need to correct for selection bias.
A key implication is that the observed rate of sign reversals (23%) could have been generated by a set of studies in which all null hypotheses are false but average power is low (around 17%). However, the z-curve analysis also shows that even a sample of 30 studies is insufficient to draw precise conclusions about false positive rates in social psychology. Following Sorić (1989), the EDR can be used to derive an upper bound on the false discovery rate (FDR), that is, the maximum proportion of false positives consistent with the observed discovery rate. Based on this approach, the FDR ranges from 11% to 100%. To rule out high false positive risks, studies would need higher power, narrower confidence intervals, or more stringent significance thresholds.
Conclusion
This blog post compared Wilson and Wixted’s use of sign reversals to estimate false discovery rates with z-curve estimates of false discovery risk. I showed that Wilson and Wixted’s approach rests on implausible assumptions. Most importantly, it assumes that sign reversals occur only when the true effect is exactly zero. It does not allow for sign reversals under nonzero effects, which can occur when all null hypotheses are false but tests of these hypotheses have low power.
The z-curve analysis of 30 replication estimates in the ML5 project shows that low average power is a plausible explanation for sign reversals even without invoking a high false-positive rate. Even with the larger samples used in ML5, the data are not precise enough to draw firm conclusions about false positives in social psychology. A key problem remains the fundamental asymmetry of NHST: it makes it possible to reject null hypotheses, but it does not allow researchers to demonstrate that an effect is (practically) zero without very high precision.
The solution is to define the null hypothesis as a region of effect sizes that are so small that they are practically meaningless. The actual level may vary across domains, but a reasonable default is Cohen’s criterion for a small effect size, r = .1 or d = .2. By this criterion, only two of the replication studies in ML5 had sample sizes that were large enough to produce results that ruled out effect sizes of at least r = .1 with adequate precision. Other replications still lacked precision to do so. Interestingly, five of the ten original statistically significant results also failed to rule out effect sizes of at least r = .1, because their confidence intervals included r = .10. Thus, these studies at best provided suggestive evidence about the sign of an effect, but no evidence that the effect size is practically meaningful.
The broader lesson is that any serious discussion of false positives in social psychology requires (a) a specification of what counts as an “absence of an effect” in practice, using minimum effect sizes of interest that can be empirically tested, (b) large sample sizes that allow precise estimation of effect sizes, and (c) unbiased reporting of results. A few registered replication reports come close to this ideal, but even these results have failed to resolve controversies because effect sizes close to zero in the predicted direction remain ambiguous without a clearly specified threshold for practical importance. To avoid endless controversies and futile replication studies, it is necessary to specify minimum effect sizes of interest before data are collected.
In practice, this means designing studies so that the confidence interval can exclude effects larger than the minimum effect size of interest, rather than merely achieving p < .05 against a point null of zero. Conceptually, this is closely related to specifying the null hypothesis as a minimum effect size and using a directional test, rather than using a two-sided test against a nil null of exactly zero. Put differently, the problem is not null hypothesis testing per se, but nil hypothesis testing (Cohen, 1994).
One of the bigger stories in Psychological (WannaBe) Science was the forced resignation of Klaus Fiedler from his post as editor-in-chief at the prestigious journal “Perspectives on Psychological Science.” In response to his humiliating eviction, Klaus Fiedler declared “I am the victim.”
In an interview, he claimed that the his actions that led to the vote of no confidence by the Board of Directors of the Association of Psychological Science (APS) were “completely fair, respectful, and in line with all journal standards.” In contrast, the Board of Directors listed several violations of editorial policies and standards.
The APS board listed the following complaints.
accept an article criticizing the original article based on three reviews that were also critical of the original article and did not reflect a representative range of views on the topic of the original article;
invite the three reviewers who reviewed the critique favorably to themselves submit commentaries on the critique;
accept those commentaries without submitting them to peer review; and,
inform the author of the original article that his invited reply would also not be sent out for peer review. The EIC then sent that reply to be reviewed by the author of the critical article to solicit further comments.
As bystanders, we have to decide whether these accusations by several board members are accurate or whether these are trumped up charges that misrepresent the facts and Fiedler is an innocent victim. Even without specific knowledge about this incidence and the people involved, bystanders are probably forming an impression about Fiedler and his accusers. First, it is a natural human response to avoid embarrassment after a public humiliation. Thus, Fiedler’s claims of no wrong-doing have to be taken with a grain of salt. On the other hand, APS board members could also have motives to distort the facts, although they are less obvious.
To understand the APS board’s responses to Fiedler’s actions, it is necessary to take into account that Fiedler’s questionable editorial decisions affected Steven Roberts, an African American scholar, who had published an article about systemic racism in psychology in the same journal under a previous editor (Roberts et al., 2020). Fiedler’s decision to invite three White critical reviewers to submit their criticisms as additional commentaries was perceived by Roberts’ as racially biased. When he made his concerns public, over 1,000 bystanders agreed and signed an open letter asking for Fiedler’s resignation. In contrast, an opposing open letter received much fewer signatures. While some of the signatures on both sides have their own biases because they know Fiedler as a friend or foe, most of the signatures did not know anything about Fiedler, but reacted to Roberts’ description of his treatment. Fiedler never denied that this account was an accurate description of events. He merely claims that his actions were “completely fair, respectful, and in line with journal standards.” Yet, nobody else has supported Fiedler’s claim that it is entirely fair and acceptable to invite three White-ish reviewers to submit their reviews as commentaries and to accept these commentaries without peer-review.
I conducted an informal and unrepresentative poll that confirmed my belief that inviting reviewers to submit a commentary is rare.
What is even more questionable is that all the three reviews support with Hommel’s critical commentary of Robert’s target article. It is not clear why reviews of a commentary were needed to be published as additional commentaries if these reviews agreed with Hommel’s commentary. The main point of reviews is to determine whether a submission is suitable for publication. If Hommel’s commentary was so deficient that all three reviewers were able to make additional points that were missing from his commentary, his submission should have been rejected with or without a chance of resubmission. In short, Fiedler’s actions were highly unusual and questionable, even if they were not racially motivated.
Even if Fiedler thought that his actions were fair and unbiased when he was acting, the response by Roberts, over 1,000 signatories, and the APS board of directors could have made him realize that others viewed his behaviors differently and maybe recognize that his actions were not as fair as he assumed. He could even have apologized for his actions or at least the harm they caused however unintentional. Yet, he chose to blame others for his resignation – “I am the victim”. I believe that Fiedler is indeed a victim, but not in the way he perceives the situation. Rather than blaming others for his disgraceful resignation, he should blame himself. To support my argument, I will propose a mediation model and provide a case-study of Fiedler’s response to criticism as empirical support.
From Arrogance to Humiliation
A well-known biblical proverb states that arrogance is the cause of humiliation (“Hochmut kommt vor dem Fall). I am proposing a median model of this assumed relationship. Fiedler is very familiar with mediation models (Fiedler, Harris, & Schott, 2018). A mediation model is basically a causal chain. I propose that arrogance may lead to humiliation because it breeds ignorance. Figure 1 shows ignorance as the mediator. That is, arrogance makes it more likely that somebody is discounting valid criticism. In turn, individuals may act in ways that are not adaptive or socially acceptable. This leads to either personal harm or a damage to a person’s reputation. Arrogance and ignorance will also shape the response to social rejection. Rather than making an internal attribution that elicits feelings of embarrassed, an emotion that repairs social relationships, arrogant and ignorant individuals will make an external attribution (blame) that leads to anger, an emotion that further harms social relationships.
Fiedler’s claim that his actions were fair and that he is the victim makes it clear that he made an external attribution. He blames others, but the real problem is that Fiedler is unable to recognize when he is wrong and criticism is justified. This attributional bias is well known in psychology and called a self-serving attribution. To enhance one’s self-esteem, some individuals attribute successes to their own abilities and blame others for their failures. I present a case-study of Fiedler’s response to the replication crisis as evidence that his arrogance blinds him to valid criticism.
Replicability and Regression to the Mean
In 2011, social psychology was faced with emerging evidence that many findings, including fundamental findings like unconscious priming, cannot be replicated. A major replication project found that only 25% of social psychology studies produced a significant result again in an attempt to replicate the original study. These findings have triggered numerous explanations for the low replication rate in social psychology (OSC, 2015; Schimmack, 2020; Wiggins & Christopherson, 2019).
Explanations for the replication crisis in social psychology can be divided into two camps. One camp believes that replication failures reveal major problems with the studies that social psychologists conducted for decades. The other camp argues that replication failures are a normal part of science and that published results can be trusted even if they failed to replicate in recent replication studies. A notable difference between these two camps is that defenders of the credibility of social psychology tend to be established and prominent figures in social psychology. As a result, they also tend to be old, men, and White. However, these surface characteristics are only correlated with views about the replication crisis. The main causal factor is likely to be the threat to eminent social psychologists concerns about their reputation and legacy. Rather than becoming famous names along with Allport, their names may be used to warn future generations about the dark days when social psychologists invented theories based on unreliable results.
Consistent with the stereotype of old, White, male social psychologists, Fiedler has become an outspoken critic of the replication movement and tried to normalize replication failures. After the credibility of psychology was challenged in news outlets, the board of the German Psychological Society (DGPs) issued a reassuring (whitewashing) statement that tried to reassure the public that psychology is a science. The web page has been deleted, but a copy of the statement is preserved here (Stellungnahme). This official statement triggered outrage among some members and DGPs created a discussion forum (also deleted now). Fiedler participated in this discussion with the claim that replication failures can be explained by a statistical phenomenon known as regression to the mean. He repeated this argument in an email with a reporter that was shared by Mickey Inzlicht in the International Social Cognition Network group (ISCON) on Facebook. This post elicited many commentaries that were mostly critical of Fiedler’s attempt to cast doubt about the scientific validity of the replication project. The ISCON post and the comments were deleted (when Mickey left Facebook), but they were preserved in my Google inbox. Here is the post and the most notable comments.
Michael Inzlicht shares Fiedler’s response to the outcome of the Reproducibility Project that only 25% of significant results in social psychology could be replicated (i.e., produced a p-value below .05).
August 31 at 9:46am
Klaus Fiedler has granted me permission to share a letter that he wrote to a reported (Bruce Bowers) in response to the replication project. This letter contains Klaus’s words only and the only part I edited was to remove his phone number. I thought this would be of interest to the group.
Dear Bruce:
Thanks for your email. You can call me tomorrow but I guess what I have to say is summarized in this email.
Before I try to tell it like it is, I ask you to please attend to my arguments, not just the final evaluations, which may appear unbalanced. So if you want to include my statement in your article, maybe along with my name, I would be happy not to detach my evaluative judgment from the arguments that in my opinion inevitably lead to my critical evaluation.
First of all I want to make it clear that I have been a big fan of properly conducted replication and validation studies for many years – long before the current hype of what one might call a shallow replication research program. Please note also that one of my own studies has been included in the present replication project; the original findings have been borne out more clearly than in the original study. So there is no self-referent motive for me to be overly critical.
However, I have to say that I am more than disappointed by the present report. In my view, such an expensive, time-consuming, and resource-intensive replication study, which can be expected to receive so much attention and to have such a strong impact on the field and on its public image, should live up (at least) to the same standards of scientific scrutiny as the studies that it evaluates. I’m afraid this is not the case, for the following reasons …
The rationale is to plot the effect size of replication results as a function of original results. Such a plot is necessarily subject to regression toward the mean. On a-priori-grounds, to the extent that the reliability of the original results is less than perfect, it can be expected that replication studies regress toward weaker effect sizes. This is very common knowledge. In a scholarly article one would try to compare the obtained effects to what can be expected from regression alone. The rule is simple and straightforward. Multiply the effect size of the original study (as a deviation score) with the reliability of the original test, and you get the expected replication results (in deviation scores) – as expected from regression alone. The informative question is to what extent the obtained results are weaker than the to-be-expected regressive results.
To be sure, the article’s muteness regarding regression is related to the fact that the reliability was not assessed. This is a huge source of weakness. It has been shown (in a nice recent article by Stanley & Spence, 2014, in PPS) that measurement error and sampling error alone will greatly reduce the replicability of empirical results, even when the hypothesis is completely correct. In order not to be fooled by statistical data, it is therefore of utmost importance to control for measurement error and sampling error. This is the lesson we took from Frank Schmidt (2010). It is also very common wisdom.
The failure to assess the reliability of the dependent measures greatly reduces the interpretation of the results. Some studies may use single measures to assess an effect whereas others may use multiple measures and thereby enhance the reliability, according to a principle well-known since Spearman & Brown. Thus, some of the replication failures may simply reflect the naïve reliance on single-item dependent measures. This is of course a weakness of the original studies, but a weakness different from non-replicability of the theoretically important effect. Indeed, contrary to the notion that researchers perfectly exploit their degrees of freedom and always come up with results that overestimate their true effect size, they often make naïve mistakes.
By the way, this failure to control for reliability might explain the apparent replication advantage of cognitive over social psychology. Social psychologists may simply often rely on singular measure, whereas cognitive psychologists use multi-trial designs resulting in much higher reliability.
The failure to consider reliability refers to the dependent measure. A similar failure to systematically include manipulation checks renders the independent variables equivocal. The so-called Duhem-Quine problem refers to the unwarranted assumption that some experimental manipulation can be equated with the theoretical variable. An independent variable can be operationalized in multiple ways. A manipulation that worked a few years ago need to work now, simply because no manipulation provides a plain manipulation of the theoretical variable proper. It is therefore essential to include a manipulation check, to make sure that the very premise of a study is met, namely a successful manipulation of the theoretical variable. Simply running the same operational procedure as years before is not sufficient, logically.
Last but not least, the sampling rule that underlies the selection of the 100 studies strikes me as hard to tolerate. Replication teams could select their studies from the first 20 articles published in a journal in a year (if I correctly understand this sentence). What might have motivated the replication teams’ choices? Could this procedure be sensitive to their attitude towards particular authors or their research? Could they have selected simply studies with a single dependent measure (implying low reliability)? – I do not want to be too suspicious here but, given the costs of the replication project and the human resources, does this sampling procedure represent the kind of high-quality science the whole project is striving for?
Across all replication studies, power is presupposed to be a pure function of the size of participant samples. The notion of a truly representative design in which tasks and stimuli and context conditions and a number of other boundary conditions are taken into account is not even mentioned (cf. Westfall & Judd).
Comments
Brent W. Roberts, 10:02am Sep 4 This comment just killed me “What might have motivated the replication teams’ choices? Could this procedure be sensitive to Their attitude towards Particular authors or Their research?” Once again, we have an eminent, high powered scientist impugning the integrity of, in this case, close to 300, mostly young researchers. What a great example to set.
Daniel Lakens, 12:32pm Sep 4 I think the regression to the mean comment just means: if you start from an extreme initial observation, there will be regression to the mean.He will agree there is publication bias – but just argues the reduction in effect sizes is nothing unexpected – we all agree with that, I think. I find his other points less convincing – there is data about researchers expectencies about whether a study would replicate. Don’t blabla, look at data. The problem with moderators is not big – original researchers OKéd the studies – if they can not think of moderators, we cannot be blamed for not including others checks. Finally, it looks like our power was good, if you examine the p-curve. Not in line with the idea we messed up. I wonder why, with all commentaries I’ve seen, no one takes the effort to pre-register their criticisms, and then just look at the studies and data, and let us know how much it really matters?
Felix Cheung, ,2:11pm Sep 4 I don’t understand why the regression to mean cannot be understood in a more positive light when the “mean” in regression to the mean refers to the effect sizes of interests. If that’s the case, then regressing to mean would mean that we are providing more accurate estimates of the effect sizes.
Joachim Vandekerckhove, 2:15pm Aug 31 The dismissive “regression to the mean” argument either simply takes publication bias as given or assumes that all effect sizes are truly zero. Either of those assumptions make for an interesting message to broadcast, I feel.
Michael Inzlicht, 2:54pm Aug 31 I think we all agree with this, Jeff, but as Simine suggested, if the study in question is a product of all the multifarious biases we’ve discussed and cannot be replicated (in an honest attempt), what basis do we have to change our beliefs at all? To me the RP–plus lots of other stuff that has come to light in the past few years–make me doubt the evidentiary basis of many findings, and by extension, many theories/models. Theories are based on data…and it turns out that data might not be as solid as we thought.
Jeff Sherman, 2:58pm Aug 31 Michael, I don’t disagree. I think RP–plus was an important endeavor. I am sympathetic to Klaus’s lament that the operationalizations of the constructs weren’t directly validated in the replications.
Uli Schimmack, 11:15am Sep 1 This is another example that many psychologists are still trying to maintain the illusion that psychology doesn’t have a replicabiltiy problem. A recurrent argument is that human behavior is complex and influenced by many factors that will produce variation in results across seemingly similar studies. Even if this were true, it would not explain why all original studies find significant effects. If moderators can make effects appear or disappear, there would be an equal number of non-significant results in original and replication studies. If psychologists were really serious about moderating factors, non-significant results would be highly important to understand under what conditions an effect does not occur. The publication of only significant results in psychology (since 1959 Sterling) shows that psychologists are not really serious about moderating factors and that moderators are only invoked post-hoc to explain away failed replications of significant results. Just like Klaus Fiedler’s illusory regression to the mean, these arguments are hollow and only reveal the motivated biases of their proponents to deny a fundamental problem in the way psychologists collect, analyze, and report their research findings. If a 25% replication rate for social psychology is not enough to declare a crisis then psychology is really in a crisis and psychologists provide the best evidence for the validity of Freud’s theory of repression. Has Daniel Kahneman commented on the reproducibility-project results?
Garriy Shteynberg, 10:33pm Sep 7 Again, I agree that there is publication bias and its importance even in a world where all H0 are false (as you show in your last comment). Now, do you see that in that very world, regression to the mean will still occur? Also, in the spirit of the dialogue, try to refrain from claiming what others do not know. I am sure you realize that making such truth claims on very little data is at best severely underpowered.
Uli Schimmack, 10:38pm Sep 7 Garriy Shteynberg Sorry, but I always said that regression to the mean occurs when there is selection bias, but without selection bias it will not occur. That is really the issue here and I am not sure what point you are trying to make. We agree that studies were selected and that low replication rate is a result of this selection and regression to the mean. If you have any other point to make, you have to make it clearer.
Malte Elson, 3:38am Sep 8 Garriy Shteynberg would you maybe try me instead? I followed your example of the perfect discipline with great predictions and without publication bias. What I haven’t figured out is what would cause regression to the mean to only occur in one direction (decreased effect size at replication level). The predictions are equally great at both levels since they are exactly the same. Why would antecedent effect sizes in publications be systematically larger if there was no selection at that level?
Marc Halusic, 12:53pm Sep 1 Even if untold moderators affect the replicability of a study that describes a real effect, it would follow that any researcher who cannot specify the conditions under which an effect will replicate does not understand that effect well enough to interpret it in the discussion section.
Maxim Milyavsky, 11:16am Sep 3 I am not sure whether Klaus meant that regression to mean by itself can explain the failure of replication or regression to mean given a selection bias. I think that without selection bias regression to mean cannot count as an alternative explanation.If it could, every subsequent experiment would yield a smaller effect than the previous one, which sounds like absurd.I assume that Klaus knows that. So, probably he admits that there was a selection bias. Maybe he just wanted to say – it’s nobody’s fault. Nobody played with data, people were just publishing effects that “worked”. Yet, what is sounds puzzling to me is that he does not see any problem in this process.
– Mickey shared some of the responses with Klaus and posted Klaus’s responses to the comment. Several commentators tried to defend Klaus by stating that he would agree with the claim that selection for significance is necessary to see an overall decrease in effect sizes. However, Klaus Fiedler doubles down on the claim that this is not necessary even though the implication would be that effect sizes shrink every time a study is replicated which is “absurd” (Maxim Milyavsk), although even this absurd claim has been made (Schooler, 2011).
Michael Inzlicht, September 2 at 1:08pm
More from Klaus Fiedler. He has asked me to post a response to a sample of the replies I sent him. Again, this is unedited, directly copying and pasting from a note Klaus sent me. (Also not sure if I should post it here or the other, much longer, conversation).
Having read the echo to my earlier comment on the Nosek report, I got the feeling that I should add some more clarifying remarks.
(1) With respect to my complaints about the complete failure to take regressiveness into account, some folks seem to suggest that this problem can be handled simply by increasing the power of the replication study and that power is a sole function of N, the number of participants. Both beliefs are mistaken. Statistical power is not just a function of N, but also depends on treating stimuli as a random factor (cf. recent papers by Westfall & Judd). Power is 1 minus β, the probability that a theoretical hypothesis, which is true, will be actually borne out in a study. This probability not only depends on N. It also depends on the appropriateness of selected stimuli, task parameters, instructions, boundary conditions etc. Even with 1000 participant per cell, measurement and sampling error can be high, for instance, when a test includes weakly selected items, or not enough items. It is a cardinal mistake to reduce power to N.
(2) The only necessary and sufficient condition for regression (to the mean or toward less pronounced values) is a correlation less than zero. This was nicely explained and proven by Furby (1973). We all “learned” that lesson in the first semester, but regression remains a counter-intuitive thing. When you plot effect sizes in the replication studies as a function of effect sizes in the original studies and the correlation between corresponding pairs is < 1, then there will be regression. The replication findings will be weaker than the original ones. One can refrain from assuming that the original findings have been over-estimations. One might represent the data the other way around, plotting the original results as a function of given effects in the replication studies, and one will also see regression. (Note in this connection that Etz’ Bayesian analysis of the replication project also identified quite a few replications that were “too strong”). For a nice illustration of this puzzling phenomenon, you may also want to read the Erev, Wallsten & Budescu (1994) paper, which shows both overconfidence and underconfidence in the same data array.
(3) I’m not saying that regression is easy to understand intuitively (Galton took many years to solve the puzzle). The very fact that people are easily fooled by regression is the reason why controlling for expected regression effects is standard in the kind of research published here. It is almost a prototypical example of what Don Campbell (1996) had in mind when he tried to warn the community from drawing erroneous inferences.
(4) I hope it is needless to repeat that controlling for the reliability of the original studies is essential, because variation in reliability affects the degree of regressiveness. It is particularly important to avoid premature interpretations of seemingly different replication results (e.g., for cognitive and social psychology) that could reflect nothing but unequal reliability.
(5) My critical remark that the replication studies did not include manipulation checks was also met with some spontaneous defensive reactions. Please note that the goal to run so-called “exact” replications (I refrain from discussing this notion here) does not prevent replication researchers from including additional groups supposed to estimate the effectiveness of a manipulation under the current conditions. (Needless to add that a manipulation check must be more than a compliant repetition of the instruction).
(6) Most importantly perhaps, I would like to reinforce my sincere opinion that methodological and ethical norms have to be applied to such an expensive, pretentious and potentially very consequential project even more carefully and strictly than they are applied to ordinary studies. Hardly any one of the 100 target studies could have a similarly strong impact, and call for a similar degree of responsibility, as the present replication project.
Kind regards, Klaus
This response elicited an even more heated discussion. Unfortunately, only some of these comments were mailed to my inbox. I must have made a very negative comment about Klaus Fiedler that elicited a response by Jeff Sherman, the moderator of the group. Eventually, I was banned from the group and created the Psychological Methods Discussion Group. that became the main group for critical discussion of psychological science.
Uli Schimmack, 2:36pm Sep 2 Jeff Sherman The comparison extends to the (in German) official statement regarding the results of the OSF-replication project. It does not mention that publication bias is at least a factor that contributed to the outcome or mentions any initiatives to improve the way psychologists conduct their research. It would be ironic if a social psychologists objects to a comparison that is based on general principles of social behavior. I think I don’t have to mention that the United States of America pride themselves on freedom of expression that even allows Nazis to publish their propaganda which German law does not allow. In contrast, censorship was used by socialist Germany to maintain in power. So, please feel free to censor my post. and send me into Psychological Method exile.
Jeff Sherman, 2:49pm Sep 2 Uli Schimmack I am not censoring the ideas you wish to express. I am saying that opinions expressed on this page must be expressed respectfully. Calling this a freedom of speech issue is a red herring. Ironic, too, given that one impact of trolling and bullying is to cause others to self-censor. I am working on a policy statement. If you find the burden unbearable, you can choose to not participate.
Uli Schimmack, 2:53pm Sep 2 Jeff Sherman Klaus is not even part of this. So, how am I bullying him? Plus, I don’t think Klaus is easily intimidated by my comment. And, as a social psychologist how do you explain that Klaus doubled down when every comment pointed out that he ignores the fact that regression to the mean can only produce a decrease in the average if the original sample was selected to be above the mean?
This discussion led to a letter to the DGPs board by Moritz Heene that expressed outrage about the whitewashing of the replication results in their official statement.
From: Moritz Heene To: Andrea Abele-Brehm, Mario Gollwitzer, & Fritz Strack Subject: DGPS-Stellungnahme zu Replikationsprojekt Date: Wed, 02 Sep 2015
[I suggest to copy and past the German text into DeepL, a powerful translation program]
Sehr geehrte Mitglieder des Vorstandes der DGPS,
Zunächst Dank an Sie für das Bemühen, die Ergebnisse des OSF-Replikationsprojektes der Öffentlichkeit klarer zu machen. Angesichts dieser Stellungnahme der DGPS möchte ich jedoch persönlich meinen Widerspruch dazu ausdrücken, da ich als Mitglied der DGPS durch diese Stellungnahmen in keiner Weise eine ausgewogene Sichtweise ausgedrückt sehe, sie im Gegenteil als sehr einseitig empfinde. Ich sehe diese Stellungnahme vielmehr als einen Euphemismus der Replikationsproblematik in der Psychologie an, um es milde auszudrücken, bin davon enttäuscht und hatte mir mehr erwartet. Meine Kritikpunkte an ihrer Stellungnahme:
1. Zum Argument 68% der Studien seien repliziert worden: Der Test dazu prüft, ob der replizierte Effekte im Konfidenzintervall um den originalen Effekt liegt, ob diese also signifikant voneinander verschieden sind, so die Logik der Autoren. Lassen wir mal großzügig beiseite, dass dies kein Test über die Differenz der Effektgrößen ist, da das Konfidenzintervall um den originalen beobachteten Effekt gelegt wird, nicht um die Differenz. Wesentlicher ist, dass dies ein schlechtes Maß für Replizierbarkeit ist, denn die originalen Effekte sind upward biased (sieht man in dem originalen paper auch), und vergessen wir den publication bias nicht (siehe density distribution der p-Werte im originalen paper). Anzunehmen, dass die originalen Effektgrößen die Populationseffektgrößen sind, ist wirklich eine heroische Annahme, gerade angesichts des positiven bias der originalen Effekte. Nebenbei: In einem offenen Brief von Klaus Fiedler auf Facebook dazu publiziert wurde, wird argumentiert, die Regression zur Mitte habe die im Schnitt geringeren Effektgrößen im OSF-Projekt produziert, könne diesen Effekt erklären. Dieses Argument mag teilweise stimmen, impliziert aber, dass die originalen Effekte extrem (also biased, weil selektiv publiziert wurde) waren, denn genau das ist ja das Charakteristikum dieses Regressionseffektes: Ergebnisse, die in einer ersten Messung extrem waren, “tendieren” in einer zweiten Messung zum Mittelwert. Die Tatsache, dass die originalen Effekte einen deutlichen positiven bias aufweisen, wird in Ihrer Stellungnahme ignoriert, bzw. gar nicht erst erwähnt.
Das Argument der 68%-Replizierbarkeit wird im übrigen auch vom Hauptautor in Antwort auf ihre Stellungnahme ganz offen in ähnlicher Weise kritisiert:
Kurzum: Sich genau diese Statistik als Unterstützung dafür aus der OSF-Studie herauszusuchen, um der Öffentlichkeit zu erklären, dass in der Psychologie im Grunde alles in Ordnung ist, sehe ich als “cherry picking” von Ergebnissen an.
2. Das Moderatoren-Argument ist letztlich unhaltbar, denn erstens > wurde dies insbesondere im OSF-Projekt 3 intensiv getestet. Das Ergebnis ist u.a. hier zusammengefasst:
Siehe u.a.: In Many Labs 1 and Many Labs 3 (which I reviewed here), different labs followed standardized replication protocols for a series of experiments. In principle, different experimenters, different lab settings, and different subject populations could have led to differences between lab sites. But in analyses of heterogeneity across sites, that was not the result. In ML1, some of the very large and obvious effects (like anchoring) varied a bit in just how large they were (from “kinda big” to “holy shit”). Across both projects, more modest effects were quite consistent. Nowhere was there evidence that interesting effects wink in and out of detectability for substantive reasons linked to sample or setting. Länger findet man es hier zusammengefasst:
The authors put the interpretation so well that I’ll quote them at length here [emphasis added]: A common explanation for the challenges of replicating results across samples and settings is that there are many seen and unseen moderators that qualify the detectability of effects (Cesario, 2014). As such, when differences are observed across study administrations, it is easy to default to the assumption that it must be due to features differing between the samples and settings. Besides time of semester, we tested whether the site of data collection, and the order of administration during the study session moderated the effects. None of these had a substantial impact on any of the investigated effects. This observation is consistent with the first “Many Labs” study (Klein et al., 2014) and is the focus of the second (Klein et al., 2015). The present study provides further evidence against sample and setting differences being a default explanation for variation in replicability. That is not to deny that such variation occurs, just that direct evidence for a given effect is needed to demonstrate that it is a viable explanation. Zweitens schreiben Sie In ihrer Stellungnahme: Solche Befunde zeigen vielmehr, dass psychologische Prozesse oft kontextabhängig sind und ihre Generalisierbarkeit weiter erforscht werden muss. Die Replikation einer amerikanischen Studie erbringt möglicherweise andere Ergebnisse, wenn diese in Deutschland oder in Italien durchgeführt wird (oder umgekehrt). In ähnlicher Weise können sich unterschiedliche Merkmale der Stichprobe (Geschlechteranteil, Alter, Bildungsstand, etc.) auf das Ergebnis auswirken. Diese Kontextabhängigkeit ist kein Zeichen von fehlender Replizierbarkeit, sondern vielmehr ein Zeichen für die Komplexität psychologischer Phänomene und Prozesse. Nein, das zeigen diese neuen Befunde eben nicht, denn dies ist eine (Post-hoc-)Interpretation die durch die im neuen OSF-Projekt erhobenen Moderatoren nicht unterstützt wird, da diese Moderatorenanalysen gar nicht durchgeführt wurden. Die postulierte Kontextabhängigkeit wurde zudem im OSF-Projekt #3 nicht gefunden. Was man zwischen den labs als Variationsquelle fand war schlicht und einfach Stichprobenvariation, wie man sie nun mal in der Statistik erwarten muss. Ich sehe für Ihre Behauptung also gar keine empirische Basis, wie sie doch in einer sich empirisch nennenden Wissenschaft doch vorhanden sein sollte. Was mir als abschließende Aussage in der Stellungnahme deutlich fehlt ist, dass die Psychologie (und gerade die Sozialpsychologie) in Zukunft keine selektiv publizierten und “underpowered studies” mehr akzeptieren sollte. Das hätte den Kern des Problems etwas besser getroffen. Mit freundlichen Grüßen, Moritz Heene
Moritz Heene received the following response from one of the DGPs board members.
From: Mario Gollwitzer To: Moritz Heene Subject: Re: DGPS-Stellungnahme zu Replikationsprojekt Date: Thu, 03 Sep 2015 10:19:28 +0200
Lieber Moritz,
vielen Dank für deine Mail — sie ist eine von vielen Rückmeldungen, die uns auf unsere Pressemitteilung vom Montag hin erreicht hat, und wir finden es sehr gut, dass in der DGPs-Mitgliedschaft dadurchoffenbar eine Diskussion angestoßen wurde. Wir glauben, dass diese Diskussion offen geführt werden sollte; daher haben wir uns entschlossen, zu unserer Pressemitteilung (und der Science-Studie bzw. dem ganzen Replikations-Projekt) eine Art Diskussionsforum auf unserer DGPs-Homepage einzurichten. Wir arbeiten gerade daran, die Seite aufzubauen. Ich fände es gut, wenn auch du dich hier beteiligen würdest, gerne mit deiner kritischen Haltung gegenüber unserer Pressemitteilung.
Deine Argumente kann ich gut nachvollziehen — und ich stimme dir zu, dass die Zahl “68%” nicht einen “Replikationsanteil” wiederspiegelt. Das war eine missverständliche Äußerung.
Aber abgesehen davon war unser Ziel, mit dieser Pressemitteilung den negativen, teilweise hämischen und destruktiven Reaktionen vieler Medien auf die Science-Studie etwas Konstruktives hinzuzufügen bzw. entgegenzusetzen. Keineswegs wollten wir die Ergebnisse der Studie”schönreden” oder eine Botschaft im Sinne von “alles gut, business as usual” verbreiten! Vielmehr wollten wir argumentieren, dass Replikationsversuche wie diese die Chance auf einen Erkenntnisgewinn bieten, die man nutzen sollte. Das ist die konstruktive Botschaft, die wir gerne auch ein bisschen stärker in den Medien vertreten sehen wollen.
Anders als du bin ich allerdings der Überzeugung, dass es durchaus möglich ist, dass die Unterschiede zwischen einer Originalstudie undihren Replikationen durchaus durch eine (unbekannte) Menge (teilweise bekannter, teilweise unbekannter) Moderatorvariablen (und deren Interaktionen) zustande kommen. Auch “Stichprobenvariation” ist nicht anderes als ein Sammelbegriff für solche Moderatoreffekte. Einige dieser Effekte sind für den Erkenntnisgewinn über ein psychologisches Phänomen zentral, andere nicht. Es gilt, die zentralen Effekte besser zu beschreiben und zu erklären. Darin sehe ich auch einen Wert von Replikationen, insbesondere von konzeptuellen Replikationen.
Abgesehen davon bin ich aber mit dir völlig einer Meinung, dass man nicht ausschließen kann, dass einige der nicht-replizierbaren, aber publizierten Effekte — übrigens nicht bloß in der Sozialpsychologie, sondern in allen Disziplinen — falsch Positive sind, für die es eine Reihe von Gründen gibt (selektives Publizieren, fragwürdige Auswertungspraktiken etc.), die hoch problematisch sind. Über diese Dinge wird ja andernorts auch heftig diskutiert. Diese Diskussionwollten wir aber in unserer Pressemitteilung erst einmal beseite lassen und stattdessen speziell auf die neue Science-Studiefokussieren.
Nochmals vielen Dank für deine Email. Solche Reaktionen sind für uns ein wichtiger Spiegel unserer Arbeit.
Herzliche Grüße, Mario
After the DGPs created a discussion forum, Klaus Fiedler, Moritz Heene and I shared our exchange of views openly on this site. The website is no longer available, but Moritz Heene saved a copy. He also shared our contribution on The Winnower.
1), that the notably lower average effect size in the OSF-project are a statistical artifact of regression to the mean,
2) that low reliability contributed to the lower effect sizes in the replication studies.
Response to 1) as noted in Heene’s previous post, Fiedler’s regression to the mean argument (results that were extreme in a first assessment tend to be closer to the mean in a second assessment) implicitly assumes that the original effects were biased; that is, they are extreme estimates of population effect sizes because they were selected for publication. However, Fiedler does not mention the selection of original effects, which leads to a false interpretation of the OSF-results in Fiedler’s commentary:
“(2) The only necessary and sufficient condition for regression (to the mean or toward less pronounced values) is a correlation less than zero. … One can refrain from assuming that the original findings have been over-estimations.” (Fiedler)
It is NOT possible to avoid the assumption that original results are inflated estimates because selective publication of results is necessary to account for the notable reduction in observed effect sizes.
a) Fiedler is mistaken when he cites Furby (1973) as evidence that regression to the mean can occur without selection. “The only necessary and sufficient condition for regression (to the mean or toward less pronounced values) is a correlation less than zero. This was nicely explained and proven by Furby (1973)” (Fiedler). It is noteworthy that Furby (1973) explicitly mentions a selection above or below the population mean in his example, when Furby (1973) writes: “Now let us choose a certain aggression level at Time 1 (any level other than the mean)”.
The math behind regression to the mean further illustrates this point. The expected amount of regression to the mean is defined as (1 – r)(mu – M), where r = correlation between first and second measurement, mu: population mean, and M = mean of the selected group (sample at time 1). For example, if r = .80 (thus, less than 1 as assumed by Fiedler) and the observed mean in the selected group (M) equals the population mean (mu) (e.g., M = .40, mu = .40, and M – mu = .40 – .40 = 0), no regression to the mean will occur because (1 – .80)(.40-.40) = .20*0 = 0. Consequently, a correlation less than 1 is not a necessary and sufficient condition for regression to the mean. The effect occurs only if the correlation is less than 1 and the sample mean differs from the population mean. [Actually the mean will decrease even if the correlation is 1, but individual scores will maintain their position relative to other scores]
b) The regression to the mean effect can be positive or negative. If M < mu and r < 1, the second observations would be higher than the first observations, and the trend towards the mean would be positive. On the other hand, if M > mu and r < 1, the regression effect is negative. In the OSF-project, the regression effect was negative, because the average effect size in the replication studies was lower than the average effect size in the original studies. This implies that the observed effects in the original studies overestimated the population effect size (M > mu), which is consistent with publication bias (and possibly p-hacking).
Thus, the lower effect sizes in the replication studies can be explained as a result of publication bias and regression to the mean. The OSF-results make it possible to estimate, how much publication bias inflates observed effect sizes in original studies. We calculated that for social psychology the average effect size fell from Cohen’s d = .6 to d = .2. This shows inflation by 200%. It is therefore not surprising that the replication studies produced so few significant results because the increase in sample size did not compensate for the large decrease in effect sizes.
Regarding Fiedler’s second point 2)
In a regression analysis, the observed regression coefficient (b) for an observed measure with measurement error is a function of the true relationship (bT) and an inverse function of the amount of measurement error (1 – error = reliability; Rel(X)):
(Interested readers can obtain the mathematical proof from Dr. Heene).
The formula implies that an observed regression coefficient (and other observed effect sizes) is always smaller than the true coefficient that could have been obtained with a perfectly reliable measure, when the reliability of the measure is less than 1. As noted by Dr. Fiedler, unreliability of measures will reduce the statistical power to obtain a statistically significant result. This statistical argument cannot explain the reduction in effect sizes in the replication studies because unreliability has the same influence on the outcome in the original studies and the replication studies. In short, the unreliability argument does not provide a valid explanation for the low success rate in the OSF-replication project.
REFERENCES Furby, L. (1973). Interpreting regression toward the mean in developmental research. Developmental Psychology, 8(2), 172-179. doi:10.1037/h0034145
On September 5, Klaus Fiedler emailed me to start a personal discussion over email.
From: klaus.fiedler [klaus.fiedler@psychologie.uni-heidelberg.de] Sent: September-05-15 7:17 AM To: Uli Schimmack; kf@psychologie.uni-heidelberg.de Subject: iscon gossip
Dear Uli … auf Deutsch … lieber Uli,
Du weisst vielleicht, dass ich nicht fuer Facebook registriert bin, aber ich kriege gelegentlich von anderen Notizen aus dem Chat geschickt. Du bist der Einzige, dem ich mal kurz schreibe. Du hattest geschrieben, dass meine Kommentare falsch waren und ich deshalb keinerlei Repsekt mehr verdiene.
Du bist ein methodisch motivierter und versierter Kollege, und ich waere daher sehr dankbar, wenn Du mir sagen koenntest, inwiefern meine Punkte nicht zutreffen. Was ist falsch:
— dass es die regression trap gibt? — dass eine state-of-the art Studie der Art Retest = f(Test) für Regression kontrollieren muss? — dass Regression eine Funktion der Reliabilitaet ist? — dass allein ein hohes participant N keineswegs dieses Problem behebt? — dass ein fehlender manipulation check die zentral Praemisse unterminiert, dass die UV ueberhaupt hergestellt wurde? — dass fehlende Kontrolle von measurement + sampling error die Interpretation der Ergebnisse unterminiert?
Oder ist der Punkt, dass scientific scrutiny nicht mehr zaehlt, wenn “junge Leute” fuer eine “gute Sache” kaempfen?
Sorry, die letzte Frage driftet ein bisschen ab ins Polemische. Das war nicht so gemeint. Ich moechte wirklich wissen, warum ich falsch liege, dann wuerde ich das auch gern richtigstellen. Ich habe doch nicht behauptet, dass ich empirische Daten habe, die den Vergleich von kognitiver und sozialer Psychologie erhellen (obwohl es stimmt, dass man den Vergleich nur machen kann, wenn man Reliabilitaet und Effektivitaet der Manipulationen kontrolliert). Was mich motiviert, ist lediglich das Ziel, dass auch Meta-Science (und gerade Meta-Science) denselben strengen Standards unterliegt wie jene Forschung, die sie bewertet (und oft leichtfertig schaedigt).
Was die Sozialpsychologie angeht, so hast Du sicher schon gemerkt, dass ich auch ihr Kritiker bin … Vielleicht koennen wir uns ja mal darueber unterhalten …
Schoene Gruesse aus Heidelberg, Klaus
I responded to this email and asked him directly to comment on selection bias as a reasonable explanation for the low replicability of social psychology results.
Dear Klaus Fiedler,
Moritz Heene and I have written a response to your comments posted on the DGPS website, which is waiting for moderation. I cc Moritz so that he can send you the response (in German), but I will try to answer your question myself.
First, I don’t think it was good that Mickey posted your comments. I think it would have been better to communicate directly with you and have a chance to discuss these issues in an exchange of arguments. It is also unfortunate that I mixed my response to the official DGPSs statement with your comments. I see some similarities, but you expressed a personal opinion and did not use the authority of an official position to speak for all psychologists when many psychologists disagree with the statement, which led to the post-hoc creation of a discussion forum to find out about members’ opinions on this issue.
Now let me answer your question. First, I would like to clarify that we are trying to answer the same question. To me the most important question is why the reproducibility of published results in psychology journals is so low (it is only 8% for social psychology, see my post https://replicationindex.wordpress.com/2015/08/26/predictions-about-replicat ion-success-in-osf-reproducibility-project/ )?
One answer to this question is publication bias. This argument has been made since Sterling (1959). Cohen (1962) estimated the replication rate at 60% based on his analysis of typical effect sizes and sample sizes in Journal of Abnormal and Social Psychology (now JPSP). The 60% estimate has been replicated by Sedlmeier and Giegerenzer (1989). So, with this figure in mind we could have expected that 60 out of 100 randomly selected results in JPSP would replicate. However, the actual success rate for JPSP is much lower. How can we explain this?
For the past five years I have been working on a better method to estimate post-hoc power, starting with my Schimmack (2012) Psych Method paper, followed by publications on my R-Index website. Similar work has been conducted by Simonsohn (p-curve) and Wicherts (puniform) approach. The problem with the 60% estimate is that it uses reported effect sizes which are inflated. After correcting for information, the estimated power for social psychology studies in the OSF-project is only 35%. This still does not explain why only 8% were replicated and I think it is an interesting question how much moderators or mistakes in the replication study explain this discrepancy. However, a low replication rate of 35% is entirely predicted based on the published result after taking power and publication bias into account.
In sum, it is well established and known that selectin of significant results distorts the evidence in the published literature and that this creates a discrepancy between the posted success rate (95%) and the replication rate (let’s say less than 50% to be conservative). I would be surprised if you would disagree with my argument that (a) publication bias is present and (b) that publication bias at least partially contributes to the low rate of successful replications in the OSF-project.
A few days later, I sent a reminder email.
Dear Klaus Fiedler,
I hope you received my email from Saturday in reply to your email “iscon gossip”. It would be nice if you could confirm that you received it and let me know whether you are planning to respond to it.
Best regards, Uli Schimmack
Klaus Fiedler responds without answering my question about the fact that regression to the mean can only explain a decrease in the mean effect sizes if the original values were inflated by selection for significance.
Hi:
as soon as my time permits, I will have a look. Just a general remark in response to your email, I do not undersatand what argument applies to my critical evaluation of the Nosek report. What you are telling me in the email does not apply to my critique.
Or do you contest that
a state-of the art study of retest = f(original test) has to tackle the regression beast
reliability of the dependent measure has to be controlled
manipulation check is crucial to assess the effective variation of the independent variable
the sampling of studies was suboptimal
If you disagree, I wonder if there is any common ground in scientific methodology.
I am not sure if I want to contribute to Facebook debates … As you can see, the distance from a scientitic argument to personal attacks is so short that I do not believe in the value of such a forum
Kind regards, Klaus
P.S. If I have a chance to read what you have posted, I may send a reply to the DPGs. By the way, I just sent my comments to Andrea Abele Brehm. I did not ask her to publicize it. But that’s OK
As in a chess game, I am pressing my advantage – Klaus Fiedler is clearly alone and wrong with his immaculate regression argument – in a follow up email.
Dear Klaus Fiedler,
I am waiting for a longer response from you, but to answer your question I find it hard to see how my comments are irrelevant as they are challenge direct quotes from your response.
My main concern is that you appear to neglect the fact that regression to the mean can only occur when selection occurred in the original set of studies.
Moritz Heene and I responded to this claim and find that it is invalid. If the original studies were not a selection of studies, the average mean should be an estimate of the average population mean and there would be no reason to expect a dramatic decrease in effect size in the OSF replication studies. Let’s just focus on this crucial point.
You can either maintain that selection is not necessary and try to explain how regression to the mean can occur without selection or you can concede that selection is necessary and explain how the OSF replication study should have taken selection into account. At a minimum, it would be interesting to hear your response to our quote of Furby (1973) that shows he assumed selection, while you cite Furby as evidence that selection is not necessary.
Although we may not be able to settle all disputes, we should be able to determine whether Furby assumed selection or not.
Here are my specific responses to your questions.
– a state-of the art study of retest = f(original test) has to tackle the regression beast [we can say that it tackeled it by examining how much selection contributed to the original results by seeing how much means regressed towards a lower mean of population effect sizes.
Result: there was a lot of selection and a lot of regression.
– reliability of the dependent measure has to be controlled
in a project that aims to replicate original studies exactly, reliability is determined by the methods of the original study
– manipulation check is crucial to assess the effective variation of the independent variable
sure, we can question how good the replication studies were, but adding additional manipulation checks might also introduce concerns that the study is not an exact replication. Nobody is claiming that the replication studies are conclusive, but no study can assure that it was a perfect study.
– the sampling of studies was suboptimal
how so? The year was selected at random. To take the first studies in a year was also random. Moreover it is possible to examine whether the results are representative of other studies in the same journals and they are; see my blog
You may decide that my responses are not satisfactory, but I would hope that you answer at least one of my questions: Do you maintain that the OSF-results could have been obtained without selection of results that overestimate the true population effect sizes (a lot)?
Sincerely,
Uli Schimmack
Moritz Heene comments.
Thanks, Uli! Don’t let them get away by tactically ignoring these facts. BTW, since we share the same scientific rigor, as far as I can see, we could ponder about a possible collaboration study. Just an idea. [This led to the statistical examination of Kahneman’s book Thinking: Fast and Slow]
Regards, Moritz
Too busy to really think about the possibility that he might have been wrong, Fiedler sends a terse response.
Klaus Fiedler
Very briefly … in a mad rush this morning: This is not true. A necessary and sufficient condition for regression is r < 1. So if the correlation between the original results and the replications is less than unity, there will be regression. Draw a scatter plot and you will easily see. An appropriate reference is Furby (1973 or 1974).
I try to clarify the issue in another attempt.
Dear Klaus Fiedler,
The question is what you mean by regression. We are talking about the mean at time 1 and time 2.
Of course, there will be regression of individual scores, but we are interested in the mean effect size in social psychology (which also determines power and percentage of significant results given equal N).
It is simply NOT true that the mean will change systematically unless there is systematic selection of observations.
As regression to the mean is defined by (1- r) * (mu – M), the formula implies that a selection effect (mu – M unequal 0) is necessary. Otherwise the whole term becomes 0.
There are three ways to explain mean differences between two sets of exact replication studies. The original set was selected to produce significant results. The replication studies are crappy and failed to reproduce the same conditions. Random sampling error (which can be excluded because the difference in OSF is highly significant).
In the case of the OSF replication studies, selection occurred because the published results were selected to be significant from a larger set of results with non-significant results.
If you see another explanation, it would be really helpful if you would elaborate on your theory.
Sincerely, Uli Schimmack
Moritz Heene joins the email exchange and makes a clear case that Fiedler’s claims are statistically wrong.
Dear Klaus Fiedler, dear Uli,
Just to add another clarification:
Once again, Furby (1973, p.173, see attached file) explicitly mentioned selection: “Now let us choose a certain aggression level at Time 1 (any level other than the mean) and call it x’ “.
Furthermore, regression to the mean is defined by (1- r)*(mu – M). See Shepard and Finison (1983, p.308, eq. [1]): “The term in square brackets, the product of two factors, is the estimated reduction in BP [blood pressure] due to regression.”
Now let us fix terms:
Definition of necessity and sufficiency
Necessity: ~p –> ~q , with “~” denoting negation
So, if r is not smaller than 1 than regression to the mean does not occur.
This is true as can be verified by the formula.
Sufficiency: p –> q
So, if r is smaller than 1 than regression to the mean does occur. This is not true as can be verified by the formula as explained in our reply on https://www.dgps.de/index.php?id=2000735#c2001225 and in Ulrich’s previous email.
Sincerely,
Moritz Heene
I sent another email to Klaus to see whether he is going to respond.
Lieber Dr. Fiedler,
Kann ich noch auf eine Antwort von Ihnen warten oder soll ich annehmen dass Sie sich entschieden haben nicht auf meine Anfrage zu antworten?
LG, Uli Schimmack
Klaus Fiedler does respond.
Dear Ullrich:
Yes, I was indeed very, very busy over two weeks, working for the Humboldt foundation, for two conferences where I had to play leading roles, the Leopoldina Academy, and many other urgent jobs. Sorry but this is simply so. I now received your email reminder to send you my comments to what you and Moritz Heene have written. However, it looks like you have already committed yourself publicly (I was sent this by colleagues who are busy on facebook): Fiedler was quick to criticize the OSF-project and Brian Nosek for making the mistake to ignore the well-known regression to the mean effect. This silly argument ignores that regression to the mean requires that the initial scores are selected, which is exactly the point of the OSF-replication studies.
Look, this passage shows that there is apparently a deep misunderstanding about the “silly argument”. Let me briefly try to explain once more what my critique of the Science article (not Brian Nosek personally – this is not my style) referred to. At the statistical level, I was simply presupposing that there is common ground on the premise that regressiveness is ubiquitous; it is not contingent on selected initial scores. Take a scatter plot of 100 bi-variate points (jointly distributed in X and Y). If r(X,Y) < 1(disregarding sign), regressing Y on X will result in a regression slope less than 1. The variance of predicted Y scores will be reduced. I very much hope we all agree that this holds for every correlation, not just those in which X is selected. If you don’t believe, I can easily demonstrate it with random (i.e., non-selective vectors x and y). Across the entire set of data pairs, large values of X will be underestimated in Y, and small values of X will be overestimated. By analogy, large original findings can be expected to be much smaller in the replication. However, when we regress X on Y, we can also expect to see that large Y scores (i.e., i.e., strong replication effects) have been weaker in the original. The Bayes factors reported by Alexander Etz in his “Bayesian reproducibility project”, although not explicit about reverse regression, strongly suggest that there are indeed quite a few cases in which replication results have been stronger than the original ones. Etz’ analysis, which nicely illustrates how a much more informative and scientifically better analysis than the one provided by Nosek might look like, also reinforces my point that the report published in Science is very weak. By the way, the conclusions are markedly different from Nosek, showing that most replication studies were equivocal. The link (that you have certainly found yourself) is provided below.
We know since Rulon (1941 or so) and even since Galton (1986 or so) that regression is a tricky thing, and here I get to the normative (as opposed to the statistical, tautological) point of my critique, which is based on the recommendation of such people as Don Campbell, Daniel Kahneman & Amos Tversky, Ido Erev, Tom Wallsten & David Budescu and many others, who have made it clear that the interpretation of retesting or replication studies will be premature and often mistaken, if one does not take the vicissitudes of regression into account. A very nice historical example is Erev, Wallsten & Budescu’s 1994 Psych. Review article on overconfidence. They make it clear you find very strong evidence for both overconfidence and underconfidence in the same data array, when you regress either accuracy on confidence or confidence on accuracy, respectively. Another wonderful demonstration is Moore and Small’s 2008 Psych. Review analysis of several types of self-serving biases.
So, while my statistical point is analytically true (because regression slope with a single predictor is always < 1; I know there can be suppressor effects with slopes > 1 in multiple regression), my normative point is also well motivated. I wonder if the audience of your Internet allusion to my “silly argument” has a sufficient understanding of the “regression trap” so that, as you write:
Everybody can make up their own mind and decide where they want to stand, but the choices are pretty clear. You can follow Fiedler, Strack, Baumeister, Gilbert, Bargh and continue with business as usual or you can change. History will tell what the right choice will be.
By the way, why you put me in the same pigeon hole as Fritz, Roy, Dan, and John. The role I am playing is completely different and it definitely not aims at business as usual. My very comment on the Nosek article is driven my deep concerns about the lack of scientific scrutiny in such a prominent journal, in which there is apparently no state-of-the-art quality control. A replication project is the canonical case of a scientific interpretation that strongly calls for awareness of the regression trap. That is, the results are only informative if one takes into account what shrinkage of strong effects could be expected by regression alone. Regressiveness imposes an upper limit on the possible replication success, which ought to be considered as a baseline for the presentation of the replication results.
To do that, it is essential to control for reliability. (I know that the reliability of individual scores within a study is not the same as the reliability of the aggregate study results, but they are of course related). I also continue to believe, strongly, that a good replication project ought to control for the successful induction of the independent variable, as evident in a manipulation check (maybe in an extra group), and that the sampling of the 100 studies itself was suboptimal. If Brian Nosek (or others) come up with a convincing interpretation of this replication project, then it is fine. However, the present analysis is definitely not convincing. It is rather a symptom of shallow science.
So, as you can see, the comments that you and Moritz Heene have sent me do not really affect these considerations. And, because there is obviously no common ground between the two of us, not even about the simplest statistical constraints, I have decided not to engage in a public debate with you. I’m afraid hardly anybody in this Facebook cycle will really invest time and work to read the literature necessary to judge the consequences of the regression trap, in order to make an informed judgment. And I do not want to nourish the malicious joy of an audience that apparently likes personal insults and attacks, detached from scientific arguments.
Kind regards, Klaus
P.S. As you can see, I CC this email to myself and to Joachim Krueger, who spontaneously sent me a similar note on the Nosek article and the regression trap.
Am 9/18/2015 um 3:21 PM schrieb Ulrich Schimmack: Lieber Dr. Fiedler,
Kann ich noch auf eine Antwort von Ihnen warten oder soll ich annehmen dass Sie sich entschieden haben nicht auf meine Anfrage zu antworten?
LG, Uli Schimmack
Klaus Fiedler responds
Dear Ullrich:
Yes, I was indeed very, very busy over two weeks, working for the Humboldt foundation, for two conferences where I had to play leading roles, the Leopoldina Academy, and many other urgent jobs. Sorry but this is simply so.
I now received your email reminder to send you my comments to what you and Moritz Heene have written. However, it looks like you have already committed yourself publicly (I was sent this by colleagues who are busy on facebook):
Fiedler was quick to criticize the OSF-project and Brian Nosek for making the mistake to ignore the well-known regression to the mean effect. This silly argument ignores that regression to the mean requires that the initial scores are selected, which is exactly the point of the OSF-replication studies.
Look, this passage shows that there is apparently a deep misunderstanding about the “silly argument”. Let me briefly try to explain once more what my critique of the Science article (not Brian Nosek personally – this is not my style) referred to.
At the statistical level, I was simply presupposing that there is common ground on the premise that regressiveness is ubiquitous; it is not contingent on selected initial scores. Take a scatter plot of 100 bi-variate points (jointly distributed in X and Y). If r(X,Y) < 1(disregarding sign), regressing Y on X will result in a regression slope less than 1. The variance of predicted Y scores will be reduced. I very much hope we all agree that this holds for every correlation, not just those in which X is selected. If you don’t believe, I can easily demonstrate it with random (i.e., non-selective vectors x and y).
Across the entire set of data pairs, large values of X will be underestimated in Y, and small values of X will be overestimated. By analogy, large original findings can be expected to be much smaller in the replication. However, when we regress X on Y, we can also expect to see that large Y scores (i.e., i.e., strong replication effects) have been weaker in the original. The Bayes factors reported by Alexander Etz in his “Bayesian reproducibility project”, although not explicit about reverse regression, strongly suggest that there are indeed quite a few cases in which replication results have been stronger than the original ones. Etz’ analysis, which nicely illustrates how a much more informative and scientifically better analysis than the one provided by Nosek might look like, also reinforces my point that the report published in Science is very weak. By the way, the conclusions are markedly different from Nosek, showing that most replication studies were equivocal. The link (that you have certainly found yourself) is provided below.
We know since Rulon (1941 or so) and even since Galton (1986 or so) that regression is a tricky thing, and here I get to the normative (as opposed to the statistical, tautological) point of my critique, which is based on the recommendation of such people as Don Campbell, Daniel Kahneman & Amos Tversky, Ido Erev, Tom Wallsten & David Budescu and many others, who have made it clear that the interpretation of retesting or replication studies will be premature and often mistaken, if one does not take the vicissitudes of regression into account. A very nice historical example is Erev, Wallsten & Budescu’s 1994 Psych. Review article on overconfidence. They make it clear you find very strong evidence for both overconfidence and underconfidence in the same data array, when you regress either accuracy on confidence or confidence on accuracy, respectively. Another wonderful demonstration is Moore and Small’s 2008 Psych. Review analysis of several types of self-serving biases.
So, while my statistical point is analytically true (because regression slope with a single predictor is always < 1; I know there can be suppressor effects with slopes > 1 in multiple regression), my normative point is also well motivated. I wonder if the audience of your Internet allusion to my “silly argument” has a sufficient understanding of the “regression trap” so that, as you write:
Everybody can make up their own mind and decide where they want to stand, but the choices are pretty clear. You can follow Fiedler, Strack, Baumeister, Gilbert, Bargh and continue with business as usual or you can change. History will tell what the right choice will be.
By the way, why you put me in the same pigeon hole as Fritz, Roy, Dan, and John. The role I am playing is completely different and it definitely not aims at business as usual. My very comment on the Nosek article is driven my deep concerns about the lack of scientific scrutiny in such a prominent journal, in which there is apparently no state-of-the-art quality control. A replication project is the canonical case of a scientific interpretation that strongly calls for awareness of the regression trap. That is, the results are only informative if one takes into account what shrinkage of strong effects could be expected by regression alone. Regressiveness imposes an upper limit on the possible replication success, which ought to be considered as a baseline for the presentation of the replication results.
To do that, it is essential to control for reliability. (I know that the reliability of individual scores within a study is not the same as the reliability of the aggregate study results, but they are of course related). I also continue to believe, strongly, that a good replication project ought to control for the successful induction of the independent variable, as evident in a manipulation check (maybe in an extra group), and that the sampling of the 100 studies itself was suboptimal. If Brian Nosek (or others) come up with a convincing interpretation of this replication project, then it is fine. However, the present analysis is definitely not convincing. It is rather a symptom of shallow science.
So, as you can see, the comments that you and Moritz Heene have sent me do not really affect these considerations. And, because there is obviously no common ground between the two of us, not even about the simplest statistical constraints, I have decided not to engage in a public debate with you. I’m afraid hardly anybody in this Facebook cycle will really invest time and work to read the literature necessary to judge the consequences of the regression trap, in order to make an informed judgment. And I do not want to nourish the malicious joy of an audience that apparently likes personal insults and attacks, detached from scientific arguments.
Kind regards, Klaus
P.S. As you can see, I CC this email to myself and to Joachim Krueger, who spontaneously sent me a similar note on the Nosek article and the regression trap.
I made another attempt to talk about selection bias and ended pretty much with a simple yes/no question as a prosecutor asking a hostile witness.
Dear Klaus,
I don’t understand why we cannot even agree about the question that regression to the mean is supposed to answer.
Moritz Heene and I are talking about the mean difference in effect sizes (the intercept, not the slope, in a regression). According to the Science article, the effect sizes in the replication studies were, on average, 50% lower than the effect sizes in the original studies. My own analysis for social psychology show a difference of d = .6 and d = .2, which suggests results published in original articles are inflated by 200%. Do you believe that regression to the mean can explain this finding? Again, this is not a question about the slope, so please try to provide an explanation that can account for mean differences in effect sizes.
Of course, you can just say that we know that a published significant result is inflated by publication bias. After all, power is never 100% so if you select 100% significant results for publication, you cannot expect 100% successful replications. The percentage that you can expect is determined by the true power of the set of studies (this has nothing to do with regression to the mean, it is simply power + publication bias. However, the OSF-reproducibility project did take power into account and increased sample sizes to account for the problem. They are also aware that the replication studies will not produce 100% successes if the replication studies were planned with 90% power.
The problem that I see with the OSF-project is that they were naïve to use the observed effect sizes to conduct their power analyses. As these effect sizes were strongly inflated by publication bias, the true power was much lower than they thought it would be. For social psychology, I calculated the true power of the original studies to be only 35%. Increasing sample sizes from 90 to 120 does not make much of a difference with power this low. If your point is simply to say that the replication studies were underpowered to reject the null-hypothesis, I agree with you. But the reason for the low power is that reported results in the literature are not credible and strongly influenced by bias. Published effect sizes in social psychology are, on average, 1/3 real and 2/3 bias. Good luck finding the false positive results with evidence like this.
Do you disagree with any of my arguments about power, publication bias, and the implication that social psychological results lack credibility?
Best regards,
Uli
Klaus Fiedler’s response continues to evade the topic of selection bias that undermines the credibility of published results with a replication rate of 25%, but he acknowledges for the first time that regression works in both directions and cannot explain mean changes without selection bias..
Dear Uli, Moritz and Krueger:
I’m afraid it’s getting very basic now … we are talking about problems which are not really there … very briefly, just for the sake of politeness
First, as already clarified in my letter to Uli yesterday, nobody will come to doubt that every correlation < 1 will produce regression in both directions. The scatter plot does not have to be somehow selected. Let’s talk about (or simulate) a bi-variate random sample. Given r < 1, if you plot Y as a function of X (i.e., “given” X values), the regression curve will have a slope < 1, that is, Y values corresponding to high X values will be smaller and Y values corresponding to low X values will be higher. In one word, the variance in Y predictions (in what can be expected in Y) will shrink. If you regress X on Y, the opposite will be the case in the same data set. That’s the truism that I am referring to.
Of course, regression is always a conditional phenomenon. Assuming a regression of Y on X: If X is (very) high, the predicted Y analogue is (much) lower. If X is (very) low, the predicted Y analogue is (much) higher. But this conditional IF phrase does not imply any selectivity. The entire sample is drawn randomly. By plotting Y as a function of given X levels (contaminated with error and unreliability), you conditionalize Y values on (too) high or (too) low X values. But this is always the case with regression.
If I correctly understand the point, you simply equate the term “selective” with “conditional on” or “given”. But all this is common sense, or isn’t it. If you believe you have found a mathematical or Monte-Carlo proof that a correlation (in a bivariate distribution) is 1 and there is no regression (in the scatter plot), then you can probably make a very surprising contribution to statistics and numerical mathematics.
Of course, regression a multiplicative function of unreliability and extremity. So points have to be extreme to be regressive. But I am talking about the entire distribution …
Best, Klaus
… who is now going back to work, sorry.
At this point, Moritz Heene is willing to let it go. There is really no point in arguing with a dickhead – a slightly wrong translation of the German term “Dickkopf” (bull-headed, stubborn).
Lieber Uli,
Sorry, schnell auf Deutsch: Angesichts der Email unten von Fiedler sehe ich es als “fruitless endeavour” an, da noch weiter zu diskutieren. Er geht auf unsere -formal korrekten!- Argumente überhaupt nicht ein und mittlerweile ist er schon bei “Ihr seid es gar nicht wert, dass ich mit Euch diskutiere” angekommen. Auch, dass er Ferby (1973) nachweislich falsch zitiert, ist ihm keine Erwähnung wert. Ich diskutiere das nun nicht mehr mit ihm, weil er es einfach nicht einsehen will und daher unsere mathematisch korrekten Argumente einfach nicht mehr erwähnt (tactical ignorance).
Eines der großen Probleme der Psychologie ist, dass die Probleme grauenhaft basal zu widerlegen sind. Bspw. ist das “hidden-moderatorArgument” am Stammtisch mit 1.3 Promille noch zu widerlegen. Taucht aber leider in Artikeln von Strack und Stroebe und anderen immer wieder auf.
I agreed with him and decided to write a blog post about this fruitless discussion. I didn’t until now, when the PoPS scandal reminded me of Fiedler’s “I am never wrong” attitude.
Hallo Moritz,
Ja Diskussion ist zu Ende. Nun werde ich ein blog mit den emails schreiben um zu zeigen mit welchen schadenfeinigen (? Ist das wirklich ein Wort) Argumenten gearbeitet wird.
Null Respekt fuer Klaus Fiedler.
LG, Uli
I communicated our decision to end the discussion to Klaus Fiedler in a final email.
Dear Klaus,
Last email from me to you.
It is sad that you are not even trying to answer my questions about the results of the reproducibility project.
I also going back to work now, where my work is to save psychology from psychologists like you who continue to deny that psychology has been facing a crisis for 50 years, make some quick bogus statistical arguments to undermine the credibility of the OSF-reproducibility project, and then go back to work as usual.
History will decide who wins this argument.
Disappointed (which implies that I had expected more for you when I started this attempt at a scientific discussion), Uli
Klaus Fiedler replied with his last email.
Dear Uli:
no, sorry that is not my intention … and not my position. I would like to share with you my thoughts about reproducibility … and I am not at all happy with the (kernel of truth) of the Nosek report. However, I believe the problems are quite different from those focused in the current debate, and in the premature consequences drawn by Nosek, Simonsohn, an others. You may have noticed that I have published a number of relevant articles, arguing that what we are lacking is not better statistics and larger subject samples but a better methodology more broader. Why should we two (including Moritz and Joachim and others) not share our thoughts, and I would also be willing to read your papers. Sure. For the moment, we have been only debating about my critique of the Nosek report. My point was that in such a report of replications plotted against originals,
an informed interpretation is not possible unless one takes regression into acount
one has to control for reliability as a crucial moderator
one has to consider manipulation checks
one has to contemplate sampling of studies
Our “debate” about 2+2=4 (I agree that’s what it was) does not affect this critique. I do not believe that I am at variance with your mathematical sketch, but it does not undo the fact that in a bivariate distribution of 100 bivariate points, the devil is lurking in the regression trap.
So please distinguish between the two points: (a) Nosek’s report does not live up to appropriate standards; but (b) I am not unwilling to share with you my thoughts about replicability. (By the way, I met Ioannidis some weeks ago and I never saw as clearly as now that he, like Fanelli, whom I also met, believe that all behavioral science is unreliable and invalid)
Kind regards, Klaus
More Gaslighting about the Replication Crisis by Klaus Fiedler
Klaus Fiedler and Norbert Schwarz are both German-born influential social psychologists. Norbert Schwarz migrated to the United States but continued to collaborate with German social psychologists like Fritz Strack. Klaus Fiedler and Norbert Schwarz have only one peer-reviewed joined publication titled “Questionable Research Practices Revisited” This article is based on John, Loewenstein, & Prelec’s (2012) influential article that coined the term “questionable research practices” In the original article, John et al. (2012) conducted a survey and found that many researchers admit that they used QRPs and also found these practices were acceptable (i.e., not a violation of ethical norms about scientific integrity). John et al.’s (2012) results provide a simple explanation for the outcome of the reproducibility project. Researchers use QRPs to get statistically significant results in studies with low statistical power. This leads to an inflation of effect sizes. When these studies are replicated WITHOUT QRPs, effect sizes are closer to the real effect sizes and lower than the inflated estimates in replications. As a result, the average effect size shrinks and the percentage of significant results decreases. All of this was clear, when Moritz Heene and I debated with Fiedler.
Fiedler and Schwarz’s article had one purpose, namely to argue that John et al.’s (2012) article did not provide credible evidence for the use of QRPs. The article does not make any connection between the use of QRPs and the outcome of the reproducibility project.
The resulting prevalence estimates are lower by order of magnitudes. We conclude that inflated prevalence estimates, due to problematic interpretation of survey data, can create a descriptive norm (QRP is normal) that can counteract the injunctive norm to minimize QRPs and unwantedly damage the image of behavioral sciences, which are essential to dealing with many societal problems” (Fiedler & Schwarz, 2016, p. 45).
Indeed, the article has been cited to claim that “questionable research practices” are not always questionable and that “QRPs may be perfectly acceptable given a suitable context and verifiable justification (Fiedler & Schwarz, 2016; …) (Rubin & Dunkin, 2022).
To be clear what this means. Rubin and Dunkin claim that it is perfectly acceptable to run multiple studies and publish only those that worked, drop observations to increase effect sizes, and to switch outcome variables after looking at the results. No student will agree that these practices are scientific or trust results based on such practices. However, Fiedler and other social psychologists want to believe that they did nothing wrong when they engaged in these practices to publish.
Fiedler triples down on Immaculate Regression
I assumed everybody had moved on from the heated debates in the wake of the reproducibility project, but I was wrong. Only a week ago, I discovered an article by Klaus Fiedler – with a co-author with one of his students that repeats the regression trap claims in an English-language peer-reviewed journal with the title “The Regression Trap and Other Pitfalls of Replication Science—Illustrated by the Report of the Open Science Collaboration” (Fiedler & Prager, 2018).
ABSTRACT The Open Science Collaboration’s 2015 report suggests that replication effect sizes in psychology are modest. However, closer inspection reveals serious problems.
A more general aim of our critical note, beyond the evaluation of the OSC report, is to emphasize the need to enhance the methodology of the current wave of simplistic replication science.
Moreover, there is little evidence for an interpretation in terms of insufficient statistical power.
Again, it is sufficient to assume a random variable of positive and negative deviations (from the overall mean) in different study domains or ecologies, analogous to deviations of high and low individual IQ scores. One need not attribute such deviations to “biased” or unfair measurement procedures, questionable practices, or researcher expectancies.
Yet, when concentrating on a domain with positive deviation scores (like gifted students), it is permissible—though misleading and unfortunate—to refer to a “positive bias” in a technical sense, to denote the domain-specific enhancement.
Depending on the selectivity and one- sided distribution of deviation scores in all these domains, domain-specific regression effects can be expected.
How about the domain of replication science? Just as psychopathology research produces overall upward regression, such that patients starting in a crisis or a period of severe suffering (typically a necessity for psychiatric diagnoses) are better off in a retest, even without therapy (Campbell, 1996), research on scientific findings must be subject to an opposite, downward regression effect. Unlike patients representing negative deviations from normality, scientific studies published in highly selective journals constitute a domain of positive deviations, of well-done empirical demonstrations that have undergone multiple checkson validity and a very strict review process. In other words, the domain of replication science, major empirical findings, is inherently selective. It represents a selection of the most convincing demonstrations of obtained effect sizes that should exceed most everyday empirical observations. Note once more that the emphasis here is not on invalid effects or outliers but on valid and impressive effects, which are, however, naturally contaminated with overestimation error (cf. Figure 2).
The domain-specific overestimation that characterizes all science is by no means caused by publication bias alone. [!!!!! the addition of alone here is the first implicit acknowledgement that publication bias contributes to the regression effect!!!!]
To summarize, it is a moot point to speculate about the reasons for more or less successful replications as long as no evidence is available about the reliability of measures and the effectiveness of manipulations.
In the absence of any information about the internal and external validity (Campbell, 1957) of both studies, there is no logical justification to attribute failed replications to the weakness of scientific hypotheses or to engage in speculations about predictors of replication success.
A recent simulation study by Stanley and Spence (2014) highlights this point, showing that measurement error and sampling error alone (Schmidt, 2010) can greatly reduce the replication success of empirical tests of correct hypotheses in studies that are not underpowered.
Our critical comments on the OSC report highlight the conclusion that the development of such a methodology is sorely needed.
Final Conclusion
Fiedler’s illusory regression account of the replication crisis was known to me since 2015. It was not part of the official record. However, his articles with Schwarz in 2016 and Prager in 2018 are part of his official CV. The articles show a clear motivated bias against Open Science and the reforms initiated by social psychologists to fix their science. He was fired because he demonstrated the same arrogant dickheadedness in interactions with a Black scholar. Does this mean he is a racist? No, he also treats White colleagues with the same arrogance, yet when he treated Roberts like this he abused his position as gate-keeper at an influential journal. I think APS made the right decision to fire him, but they were wrong to hire him in the first place. The past editors of PoPS have shown that old White eminent psychologists are unable to navigate the paradigm shift in psychology towards credibility, transparency, and inclusivity. I hope APS will learn a lesson from the reputational damage caused by Fiedler’s actions and search for a better editor that represents the values of contemporary psychologists.
P.S. This blog post is about Klaus Fiedler, the public figure and his role in psychological science. It has nothing to do with the human being.
P.P.S I also share the experience of being forced from an editorial position with Klaus. I was co-founding editor of Meta-Psychology and made some controversial comments about another journal that led to a negative response. To save the new journal, I resigned. It was for the better and Rickard Carlsson is doing a much better job alone than we could have done together. It hurt a little, but live goes on. Reputations are not made by a single incidence, especially if you can admit to mistakes.
Since 2011, it is an open secret that many published results in psychology journals do not replicate. The replicability of published results is particularly low in social psychology (Open Science Collaboration, 2015).
A key reason for low replicability is that researchers are rewarded for publishing as many articles as possible without concerns about the replicability of the published findings. This incentive structure is maintained by journal editors, review panels of granting agencies, and hiring and promotion committees at universities.
To change the incentive structure, I developed the Replicability Index, a blog that critically examined the replicability, credibility, and integrity of psychological science. In 2016, I created the first replicability rankings of psychology departments (Schimmack, 2016). Based on scientific criticisms of these methods, I have improved the selection process of articles to be used in departmental reviews.
1. I am using Web of Science to obtain lists of published articles from individual authors (Schimmack, 2022). This method minimizes the chance that articles that do not belong to an author are included in a replicability analysis. It also allows me to classify researchers into areas based on the frequency of publications in specialized journals. Currently, I cannot evaluate neuroscience research. So, the rankings are limited to cognitive, social, developmental, clinical, and applied psychologists.
2. I am using department’s websites to identify researchers that belong to the psychology department. This eliminates articles that are from other departments.
3. I am only using tenured, active professors. This eliminates emeritus professors from the evaluation of departments. I am not including assistant professors because the published results might negatively impact their chances to get tenure. Another reason is that they often do not have enough publications at their current university to produce meaningful results.
Like all empirical research, the present results rely on a number of assumptions and have some limitations. The main limitations are that (a) only results that were found in an automatic search are included (b) only results published in 120 journals are included (see list of journals) (c) published significant results (p < .05) may not be a representative sample of all significant results (d) point estimates are imprecise and can vary based on sampling error alone.
These limitations do not invalidate the results. Large difference in replicability estimates are likely to predict real differences in success rates of actual replication studies (Schimmack, 2022).
New York University
I used the department website to find core members of the psychology department. I found 13 professors and 6 associate professors. Figure 1 shows the z-curve for all 12,365 tests statistics in articles published by these 19 faculty members. I use the Figure to explain how a z-curve analysis provides information about replicability and other useful meta-statistics.
1. All test-statistics are converted into absolute z-scores as a common metric of the strength of evidence (effect size over sampling error) against the null-hypothesis (typically H0 = no effect). A z-curve plot is a histogram of absolute z-scores in the range from 0 to 6. The 1,239 (~ 10%) of z-scores greater than 6 are not shown because z-scores of this magnitude are extremely unlikely to occur when the null-hypothesis is true (particle physics uses z > 5 for significance). Although they are not shown, they are included in the meta-statistics.
2. Visual inspection of the histogram shows a steep drop in frequencies at z = 1.96 (dashed blue/red line) that corresponds to the standard criterion for statistical significance, p = .05 (two-tailed). This shows that published results are selected for significance. The dashed red/white line shows significance for p < .10, which is often used for marginal significance. There is another drop around this level of significance.
3. To quantify the amount of selection bias, z-curve fits a statistical model to the distribution of statistically significant results (z > 1.96). The grey curve shows the predicted values for the observed significant results and the unobserved non-significant results. The full grey curve is not shown to present a clear picture of the observed distribution. The statistically significant results (including z > 6) make up 20% of the total area under the grey curve. This is called the expected discovery rate because the results provide an estimate of the percentage of significant results that researchers actually obtain in their statistical analyses. In comparison, the percentage of significant results (including z > 6) includes 70% of the published results. This percentage is called the observed discovery rate, which is the rate of significant results in published journal articles. The difference between a 70% ODR and a 20% EDR provides an estimate of the extent of selection for significance. The difference of 50 percentage points is large. The upper level of the 95% confidence interval for the EDR is 28%. Thus, the discrepancy is not just random. To put this result in context, it is possible to compare it to the average for 120 psychology journals in 2010 (Schimmack, 2022). The ODR is similar (70 vs. 72%), but the EDR is a bit lower (20% vs. 28%), although the difference might be largely due to chance.
4. The EDR can be used to estimate the risk that published results are false positives (i.e., a statistically significant result when H0 is true), using Soric’s (1989) formula for the maximum false discovery rate. An EDR of 20% implies that no more than 20% of the significant results are false positives, however the upper limit of the 95%CI of the EDR, 28%, allows for 36% false positive results. Most readers are likely to agree that this is an unacceptably high risk that published results are false positives. One solution to this problem is to lower the conventional criterion for statistical significance (Benjamin et al., 2017). Figure 2 shows that alpha = .005 reduces the point estimate of the FDR to 3% with an upper limit of the 95% confidence interval of XX%. Thus, without any further information readers could use this criterion to interpret results published by NYU faculty members.
5. The estimated replication rate is based on the mean power of significant studies (Brunner & Schimmack, 2020). Under ideal condition, mean power is a predictor of the success rate in exact replication studies with the same sample sizes as the original studies. However, as NYU professor van Bavel pointed out in an article, replication studies are never exact, especially in social psychology (van Bavel et al., 2016). This implies that actual replication studies have a lower probability of producing a significant result, especially if selection for significance is large. In the worst case scenario, replication studies are not more powerful than original studies before selection for significance. Thus, the EDR provides an estimate of the worst possible success rate in actual replication studies. In the absence of further information, I have proposed to use the average of the EDR and ERR as a predictor of actual replication outcomes. With an ERR of 62% and an EDR of 20%, this implies an actual replication prediction of 41%. This is close to the actual replication rate in the Open Science Reproducibility Project (Open Science Collaboration, 2015). The prediction for results published in 120 journals in 2010 was (ERR = 67% + ERR = 28%)/ 2 = 48%. This suggests that results published by NYU faculty are slightly less replicable than the average result published in psychology journals, but the difference is relatively small and might be mostly due to chance.
6. There are two reasons for low replication rates in psychology. One possibility is that psychologists test many false hypotheses (i.e., H0 is true) and many false positive results are published. False positive results have a very low chance of replicating in actual replication studies (i.e. 5% when .05 is used to reject H0), and will lower the rate of actual replications a lot. Alternative, it is possible that psychologists tests true hypotheses (H0 is false), but with low statistical power (Cohen, 1961). It is difficult to distinguish between these two explanations because the actual rate of false positive results is unknown. However, it is possible to estimate the typical power of true hypotheses tests using Soric’s FDR. If 20% of the significant results are false positives, the power of the 80% true positives has to be (.62 – .2*.05)/.8 = 76%. This would be close to Cohen’s recommended level of 80%, but with a high level of false positive results. Alternatively, the null-hypothesis may never be really true. In this case, the ERR is an estimate of the average power to get a significant result for a true hypothesis. Thus, power is estimated to be between 62% and 76%. The main problem is that this is an average and that many studies have less power. This can be seen in Figure 1 by examining the local power estimates for different levels of z-scores. For z-scores between 2 and 2.5, the ERR is only 47%. Thus, many studies are underpowered and have a low probability of a successful replication with the same sample size even if they showed a true effect.
Area
The results in Figure 1 provide highly aggregated information about replicability of research published by NYU faculty. The following analyses examine potential moderators. First, I examined social and cognitive research. Other areas were too small to be analyzed individually.
The z-curve for the 11 social psychologists was similar to the z-curve in Figure 1 because they provided more test statistics and had a stronger influence on the overall result.
The z-curve for the 6 cognitive psychologists looks different. The EDR and ERR are higher for cognitive psychology, and the 95%CI for social and cognitive psychology do not overlap. This suggests systematic differences between the two fields. These results are consistent with other comparisons of the two fields, including actual replication outcomes (OSC, 2015). With an EDR of 44%, the false discovery risk for cognitive psychology is only 7% with an upper limit of the 95%CI at 12%. This suggests that the conventional criterion of .05 does keep the false positive risk at a reasonably low level or that an adjustment to alpha = .01 is sufficient. In sum, the results show that results published by cognitive researchers at NYU are more replicable than those published by social psychologists.
Position
Since 2015 research practices in some areas of psychology, especially social psychology, have changed to increase replicability. This would imply that research by younger researchers is more replicable than research by more senior researchers that have more publications before 2015. A generation effect would also imply that a department’s replicability increases when older faculty members retire. On the other hand, associate professors are relatively young and likely to influence the reputation of a department for a long time.
The figure above shows that most test statistics come from the (k = 13) professors. As a result, the z-curve looks similar to the z-curve for all test values in Figure 1. The results for the 6 associate professors (below) are more interesting. Although five of the six associate professors are in the social area, the z-curve results show a higher EDR and less selection bias than the plot for all social psychologists. This suggests that the department will improve when full professors in social psychology retire.
Some researchers have changed research practices in response to the replication crisis. It is therefore interesting to examine whether replicability of newer research has improved. To examine this question, I performed a z-curve analysis for articles published in the past five year (2016-2021).
The results show very little signs of improvement. The EDR increased from 20% to 26%, but the confidence intervals are too wide to infer that this is a systematic change. In contrast, Stanford University improved from 22% to 50%, a significant increase. For now, NYU results should be interpreted with alpha = .005 as threshold for significance to maintain a reasonable false positive risk.
The table below shows the meta-statistics of all 19 faculty members. You can see the z-curve for each faculty member by clicking on their name.
It was relatively quiet on academic twitter when most academics were enjoying the last weeks of summer before the start of a new, new-normal semester. This changed on August 17, when the datacolada crew published a new blog post that revealed fraud in a study of dishonesty (http://datacolada.org/98). Suddenly, the integrity of social psychology was once again discussed on twitter, in several newspaper articles, and an article in Science magazine (O’Grady, 2021). The discovery of fraud in one dataset raises questions about other studies in articles published by the same researcher as well as in social psychology in general (“some researchers are calling Ariely’s large body of work into question”; O’Grady, 2021).
The brouhaha about the discovery of fraud is understandable because fraud is widely considered an unethical behavior that violates standards of academic integrity that may end a career (e.g., Stapel). However, there are many other reasons to be suspect of the credibility of Dan Ariely’s published results and those by many other social psychologists. Over the past decade, strong scientific evidence has accumulated that social psychologists’ research practices were inadequate and often failed to produce solid empirical findings that can inform theories of human behavior, including dishonest ones.
Arguably, the most damaging finding for social psychology was the finding that only 25% of published results could be replicated in a direct attempt to reproduce original findings (Open Science Collaboration, 2015). With such a low base-rate of successful replications, all published results in social psychology journals are likely to fail to replicate. The rational response to this discovery is to not trust anything that is published in social psychology journals unless there is evidence that a finding is replicable. Based on this logic, the discovery of fraud in a study published in 2012 is of little significance. Even without fraud, many findings are questionable.
Questionable Research Practices
The idealistic model of a scientist assumes that scientists test predictions by collecting data and then let the data decide whether the prediction was true or false. Articles are written to follow this script with an introduction that makes predictions, a results section that tests these predictions, and a conclusion that takes the results into account. This format makes articles look like they follow the ideal model of science, but it only covers up the fact that actual science is produced in a very different way; at least in social psychology before 2012. Either predictions are made after the results are known (Kerr, 1998) or the results are selected to fit the predictions (Simmons, Nelson, & Simonsohn, 2011).
This explains why most articles in social psychology support authors’ predictions (Sterling, 1959; Sterling et al., 1995; Motyl et al., 2017). This high success rate is not the result of brilliant scientists and deep insights into human behaviors. Instead, it is explained by selection for (statistical) significance. That is, when a result produces a statistically significant result that can be used to claim support for a prediction, researchers write a manuscript and submit it for publication. However, when the result is not significant, they do not write a manuscript. In addition, researchers will analyze their data in multiple ways. If they find one way that supports their predictions, they will report this analysis, and not mention that other ways failed to show the effect. Selection for significance has many names such as publication bias, questionable research practices, or p-hacking. Excessive use of these practices makes it easy to provide evidence for false predictions (Simmons, Nelson, & Simonsohn, 2011). Thus, the end-result of using questionable practices and fraud can be the same; published results are falsely used to support claims as scientifically proven or validated, when they actually have not been subjected to a real empirical test.
Although questionable practices and fraud have the same effect, scientists make a hard distinction between fraud and QRPs. While fraud is generally considered to be dishonest and punished with retractions of articles or even job losses, QRPs are tolerated. This leads to the false impression that articles that have not been retracted provide credible evidence and can be used to make scientific arguments (studies show ….). However, QRPs are much more prevalent than outright fraud and account for the majority of replication failures, but do not result in retractions (John, Loewenstein, & Prelec, 2012; Schimmack, 2021).
The good news is that the use of QRPs is detectable even when original data are not available, whereas fraud typically requires access to the original data to reveal unusual patterns. Over the past decade, my collaborators and I have worked on developing statistical tools that can reveal selection for significance (Bartos & Schimmack, 2021; Brunner & Schimmack, 2020; Schimmack, 2012). I used the most advanced version of these methods, z-curve.2.0, to examine the credibility of results published in Dan Ariely’s articles.
Data
To examine the credibility of results published in Dan Ariely’s articles I followed the same approach that I used for other social psychologists (Replicability Audits). I selected articles based on authors’ H-Index in WebOfKnowledge. At the time of coding, Dan Ariely had an H-Index of 47; that is, he published 47 articles that were cited at least 47 times. I also included the 48th article that was cited 47 times. I focus on the highly cited articles because dishonest reporting of results is more harmful, if the work is highly cited. Just like a falling tree may not make a sound if nobody is around, untrustworthy results in an article that is not cited have no real effect.
For all empirical articles, I picked the most important statistical test per study. The coding of focal results is important because authors may publish non-significant results when they made no prediction. They may also publish a non-significant result when they predict no effect. However, most claims are based on demonstrating a statistically significant result. The focus on a single result is needed to ensure statistical independence which is an assumption made by the statistical model. When multiple focal tests are available, I pick the first one unless another one is theoretically more important (e.g., featured in the abstract). Although this coding is subjective, other researchers including Dan Ariely can do their own coding and verify my results.
Thirty-one of the 48 articles reported at least one empirical study. As some articles reported more than one study, the total number of studies was k = 97. Most of the results were reported with test-statistics like t, F, or chi-square values. These values were first converted into two-sided p-values and then into absolute z-scores. 92 of these z-scores were statistically significant and used for a z-curve analysis.
Z-Curve Results
The key results of the z-curve analysis are captured in Figure 1.
Figure 1
Visual inspection of the z-curve plot shows clear evidence of selection for significance. While a large number of z-scores are just statistically significant (z > 1.96 equals p < .05), there are very few z-scores that are just shy of significance (z < 1.96). Moreover, the few z-scores that do not meet the standard of significance were all interpreted as sufficient evidence for a prediction. Thus, Dan Ariely’s observed success rate is 100% or 95% if only p-values below .05 are counted. As pointed out in the introduction, this is not a unique feature of Dan Ariely’s articles, but a general finding in social psychology.
A formal test of selection for significance compares the observed discovery rate (95% z-scores greater than 1.96) to the expected discovery rate that is predicted by the statistical model. The prediction of the z-curve model is illustrated by the blue curve. Based on the distribution of significant z-scores, the model expected a lot more non-significant results. The estimated expected discovery rate is only 15%. Even though this is just an estimate, the 95% confidence interval around this estimate ranges from 5% to only 31%. Thus, the observed discovery rate is clearly much much higher than one could expect. In short, we have strong evidence that Dan Ariely and his co-authors used questionable practices to report more successes than their actual studies produced.
Although these results cast a shadow over Dan Ariely’s articles, there is a silver lining. It is unlikely that the large pile of just significant results was obtained by outright fraud; not impossible, but unlikely. The reason is that QRPs are bound to produce just significant results, but fraud can produce extremely high z-scores. The fraudulent study that was flagged by datacolada has a z-score of 11, which is virtually impossible to produce with QRPs (Simmons et al., 2001). Thus, while we can disregard many of the results in Ariely’s articles, he does not have to fear to lose his job (unless more fraud is uncovered by data detectives). Ariely is also in good company. The expected discovery rate for John A. Bargh is 15% (Bargh Audit) and the one for Roy F. Baumester is 11% (Baumeister Audit).
The z-curve plot also shows some z-scores greater than 3 or even greater than 4. These z-scores are more likely to reveal true findings (unless they were obtained with fraud) because (a) it gets harder to produce high z-scores with QRPs and replication studies show higher success rates for original studies with strong evidence (Schimmack, 2021). The problem is to find a reasonable criterion to distinguish between questionable results and credible results.
Z-curve make it possible to do so because the EDR estimates can be used to estimate the false discovery risk (Schimmack & Bartos, 2021). As shown in Figure 1, with an EDR of 15% and a significance criterion of alpha = .05, the false discovery risk is 30%. That is, up to 30% of results with p-values below .05 could be false positive results. The false discovery risk can be reduced by lowering alpha. Figure 2 shows the results for alpha = .01. The estimated false discovery risk is now below 5%. This large reduction in the FDR was achieved by treating the pile of just significant results as no longer significant (i.e., it is now on the left side of the vertical red line that reflects significance with alpha = .01, z = 2.58).
With the new significance criterion only 51 of the 97 tests are significant (53%). Thus, it is not necessary to throw away all of Ariely’s published results. About half of his published results might have produced some real evidence. Of course, this assumes that z-scores greater than 2.58 are based on real data. Any investigation should therefore focus on results with p-values below .01.
The final information that is provided by a z-curve analysis is the probability that a replication study with the same sample size produces a statistically significant result. This probability is called the expected replication rate (ERR). Figure 1 shows an ERR of 52% with alpha = 5%, but it includes all of the just significant results. Figure 2 excludes these studies, but uses alpha = 1%. Figure 3 estimates the ERR only for studies that had a p-value below .01 but using alpha = .05 to evaluate the outcome of a replication study.
Figur e3
In Figure 3 only z-scores greater than 2.58 (p = .01; on the right side of the dotted blue line) are used to fit the model using alpha = .05 (the red vertical line at 1.96) as criterion for significance. The estimated replication rate is 85%. Thus, we would predict mostly successful replication outcomes with alpha = .05, if these original studies were replicated and if the original studies were based on real data.
Conclusion
The discovery of a fraudulent dataset in a study on dishonesty has raised new questions about the credibility of social psychology. Meanwhile, the much bigger problem of selection for significance is neglected. Rather than treating studies as credible unless they are retracted, it is time to distrust studies unless there is evidence to trust them. Z-curve provides one way to assure readers that findings can be trusted by keeping the false discovery risk at a reasonably low level, say below 5%. Applying this methods to Ariely’s most cited articles showed that nearly half of Ariely’s published results can be discarded because they entail a high false positive risk. This is also true for many other findings in social psychology, but social psychologists try to pretend that the use of questionable practices was harmless and can be ignored. Instead, undergraduate students, readers of popular psychology books, and policy makers may be better off by ignoring social psychology until social psychologists report all of their results honestly and subject their theories to real empirical tests that may fail. That is, if social psychology wants to be a science, social psychologists have to act like scientists.
Social psychologists have failed to clean up their act and their literature. Here I show unusually high effect sizes in non-retracted articles by Sanna, who retracted several articles. I point out that non-retraction does not equal credibility and I show that co-authors like Norbert Schwarz lack any motivation to correct the published record. The inability of social psychologists to acknowledge and correct their mistakes renders social psychology a para-science that lacks credibility. Even meta-analyses cannot be trusted because they do not correct properly for the use of questionable research practices.
Introduction
When I grew up, a popular German Schlager was the song “Aber bitte mit Sahne.” The song is about Germans love of deserts with whipped cream. So, when I saw articles by Sanna, I had to think about whipped cream, which is delicious. Unfortunately, articles by Sanna are the exact opposite. In the early 2010s, it became apparent that Sanna had fabricated data. However, unlike the thorough investigation of a similar case in the Netherlands, the extent of Sanna’s fraud remains unclear (Retraction Watch, 2012). The latest count of Sanna’s retracted articles was 8 (Retraction Watch, 2013).
WebOfScience shows 5 retraction notices for 67 articles, which means 62 articles have not been retracted. The question is whether these article can be trusted to provide valid scientific information? The answer to this question matters because Sanna’s articles are still being cited at a rate of over 100 citations per year.
Meta-Analysis of Ease of Retrieval
The data are also being used in meta-analyses (Weingarten & Hutchinson, 2018). Fraudulent data are particularly problematic for meta-analysis because fraud can produce large effect size estimates that may inflate effect size estimates. Here I report the results of my own investigation that focusses on the ease-of-retrieval paradigm that was developed by Norbert Schwarz and colleagues (Schwarz et al., 1991).
The meta-analysis included 7 studies from 6 articles. Two studies produced independent effect size estimates for 2 conditions for a total of 9 effect sizes.
Sanna, L. J., Schwarz, N., & Small, E. M. (2002). Accessibility experiences and the hindsight bias: I knew it all along versus it could never have happened. Memory & Cognition, 30(8), 1288–1296. https://doi.org/10.3758/BF03213410 [Study 1a, 1b]
Sanna, L. J., Schwarz, N., & Stocker, S. L. (2002). When debiasing backfires: Accessible content and accessibility experiences in debiasing hindsight. Journal of Experimental Psychology: Learning, Memory, and Cognition, 28(3), 497–502. https://doi.org/10.1037/0278-7393.28.3.497 [Study 1 & 2]
Sanna, L. J., & Schwarz, N. (2003). Debiasing the hindsight bias: The role of accessibility experiences and (mis)attributions. Journal of Experimental Social Psychology, 39(3), 287–295. https://doi.org/10.1016/S0022-1031(02)00528-0 [Study 1]
Sanna, L. J., Chang, E. C., & Carter, S. E. (2004). All Our Troubles Seem So Far Away: Temporal Pattern to Accessible Alternatives and Retrospective Team Appraisals. Personality and Social Psychology Bulletin, 30(10), 1359–1371. https://doi.org/10.1177/0146167204263784 [Study 3a]
Sanna, L. J., Parks, C. D., Chang, E. C., & Carter, S. E. (2005). The Hourglass Is Half Full or Half Empty: Temporal Framing and the Group Planning Fallacy. Group Dynamics: Theory, Research, and Practice, 9(3), 173–188. https://doi.org/10.1037/1089-2699.9.3.173 [Study 3a, 3b]
Carter, S. E., & Sanna, L. J. (2008). It’s not just what you say but when you say it: Self-presentation and temporal construal. Journal of Experimental Social Psychology, 44(5), 1339–1345. https://doi.org/10.1016/j.jesp.2008.03.017 [Study 2]
When I examined Sanna’s results, I found that all 9 of these 9 effect sizes were extremely large with effect size estimates being larger than one standard deviation. A logistic regression analysis that predicted authorship (With Sanna vs. Without Sanna) showed that the large effect sizes in Sanna’s articles were unlikely to be due to sampling error alone, b = 4.6, se = 1.1, t(184) = 4.1, p = .00004 (1 / 24,642).
These results show that Sanna’s effect sizes are not typical for the ease-of-retrieval literature. As one of his retracted articles used the ease-of retrieval paradigm, it is possible that these articles are equally untrustworthy. As many other studies have investigated ease-of-retrieval effects, it seems prudent to exclude articles by Sanna from future meta-analysis.
These articles should also not be cited as evidence for specific claims about ease-of-retrieval effects for the specific conditions that were used in these studies. As the meta-analysis shows, there have been no credible replications of these studies and it remains unknown how much ease of retrieval may play a role under the specified conditions in Sanna’s articles.
Discussion
The blog post is also a warning for young scientists and students of social psychology that they cannot trust researchers who became famous with the help of questionable research practices that produced too many significant results. As the reference list shows, several articles by Sanna were co-authored by Norbert Schwarz, the inventor of the ease-of-retrieval paradigm. It is most likely that he was unaware of Sanna’s fraudulent practices. However, he seemed to lack any concerns that the results might be too good to be true. After all, he encountered replicaiton failures in his own lab.
“of course, we had studies that remained unpublished. Early on we experimented with different manipulations. The main lesson was: if you make the task too blatantly difficult, people correctly conclude the task is too difficult and draw no inference about themselves. We also had a couple of studies with unexpected gender differences” (Schwarz, email communication, 5/18,21).
So, why was he not suspicious when Sanna only produced successful results? I was wondering whether Schwarz had some doubts about these studies with the help of hindsight bias. After all, a decade or more later, we know that he committed fraud for some articles on this topic, we know about replication failures in larger samples (Yeager et al., 2019), and we know that the true effect sizes are much smaller than Sanna’s reported effect sizes (Weingarten & Hutchinson, 2018).
Hi Norbert, thank you for your response. I am doing my own meta-analysis of the literature as I have some issues with the published one by Evan. More about that later. For now, I have a question about some articles that I came across, specifically Sanna, Schwarz, and Small (2002). The results in this study are very strong (d ~ 1). Do you think a replication study powered for 95% power with d = .4 (based on meta-analysis) would produce a significant result? Or do you have concerns about this particular paradigm and do not predict a replication failure? Best, Uli (email
His response shows that he is unwilling or unable to even consider the possibility that Sanna used fraud to produce the results in this article that he co-authored.
Uli, that paper has 2 experiments, one with a few vs many manipulation and one with a facial manipulation. I have no reason to assume that the patterns won’t replicate. They are consistent with numerous earlier few vs many studies and other facial manipulation studies (introduced by Stepper & Strack, JPSP, 1993). The effect sizes always depend on idiosyncracies of topic, population, and context, which influence accessible content and accessibility experience. The theory does not make point predictions and the belief that effect sizes should be identical across decades and populations is silly — we’re dealing with judgments based on accessible content, not with immutable objects.
This response is symptomatic of social psychologists response to decades of research that has produced questionable results that often fail to replicate (see Schimmack, 2020, for a review). Even when there is clear evidence of questionable practices, journals are reluctant to retract articles that make false claims based on invalid data (Kitayama, 2020). And social psychologist Daryl Bem wants rather be remembered as loony para-psychologists than as real scientists (Bem, 2021).
The problem with these social psychologists is not that they made mistakes in the way they conducted their studies. The problem is their inability to acknowledge and correct their mistakes. While they are clinging to their CVs and H-Indices to protect their self-esteem, they are further eroding trust in psychology as a science and force junior scientists who want to improve things out of academia (Hilgard, 2021). After all, the key feature of science that distinguishes it from ideologies is the ability to correct itself. A science that shows no signs of self-correction is a para-science and not a real science. Thus, social psychology is currently para-science (i.e., “Parascience is a broad category of academic disciplines, that are outside the scope of scientific study, Wikipedia).
The only hope for social psychology is that young researchers are unwilling to play by the old rules and start a credibility revolution. However, the incentives still favor conformists who suck up to the old guard. Thus, it is unclear if social psychology will ever become a real science. A first sign of improvement would be to retract articles that make false claims based on results that were produced with questionable research practices. Instead, social psychologists continue to write review articles that ignore the replication crisis (Schwarz & Strack, 2016) as if repression can bend reality.
Klaus Fiedler is a prominent experimental social psychologist. Aside from his empirical articles, Klaus Fiedler has contributed to meta-psychological articles. He is one of several authors of a highly cited article that suggested numerous improvements in response to the replication crisis; Recommendations for Increasing Replicability in Psychology (Asendorpf, Conner, deFruyt, deHower, Denissen, K. Fiedler, S. Fiedler, Funder, Kliegel, Nosek, Perugini, Roberts, Schmitt, vanAken, Weber, & Wicherts, 2013).
The article makes several important contributions. First, it recognizes that success rates (p < .05) in psychology journals are too high (although a reference to Sterling, 1959, is missing). Second, it carefully distinguishes reproducibilty, replicabilty, and generalizability. Third, it recognizes that future studies need to decrease sampling error to increase replicability. Fourth, it points out that reducing sampling error increases replicabilty because studies with less sampling error have more statistical power and reduce the risk of false negative results that often remain unpublished. The article also points out problems with articles that present results from multiple underpowered studies.
“It is commonly believed that one way to increase replicability is to present multiple studies. If an effect can be shown in different studies, even though each one may be underpowered, many readers, reviewers, and editors conclude that it is robust and replicable. Schimmack (2012), however, has noted that the opposite can be true. A study with low power is, by definition, unlikely to obtain a significant result with a given effect size.” (p. 111)
If we assume that co-authorship implies knowledge of the content of an article, we can infer that Klaus Fiedler was aware of the problem of multiple-study articles in 2013. It is therefore disconcerting to see that Klaus Fiedler is the senior author of an article published in 2014 that illustrates the problem of multiple study articles (T. Krüger, K. Fiedler, Koch, & Alves, 2014).
I came across this article in a response by Jens Forster to a failed replication of Study 1 in Forster, Liberman, and Kuschel, 2008). Forster cites the Krüger et al. (2014) article as evidence that their findings have been replicated to discredit the failed replication in the Open Science Collaboration replication project (Science, 2015). However, a bias-analysis suggests that Krüger et al.’s five studies had low power and a surprisingly high success rate of 100%.
No
N
Test
p.val
z
OP
Study 1
44
t(41)=2.79
0.009
2.61
0.74
Study 2
80
t(78)=2.81
0.006
2.73
0.78
Study 3
65
t(63)=2.06
0.044
2.02
0.52
Study 4
66
t(64)=2.30
0.025
2.25
0.61
Study 5
170
t(168)=2.23
0.027
2.21
0.60
z = -qnorm(p.val/2); OP = observed power pnorm(z,1.96)
Median observed power is only 61%, but the success rate (p < .05) is 100%. Using the incredibility index from Schimmack (2012), we find that the binomial probability of obtaining at least one non-significant result with median power of 61% is 92%. Thus, the absence of non-significant results in the set of five studies is unlikely.
As Klaus Fiedler was aware of the incredibility index by the time this article was published, the authors could have computed the incredibility of their results before they published the results (as Micky Inzlicht blogged “check yourself, before you wreck yourself“).
Meanwhile other bias tests have been developed. The Test of Insufficient Variance (TIVA) compares the observed variance of p-values converted into z-scores to the expected variance of independent z-scores (1). The observed variance is much smaller, var(z) = 0.089 and the probability of obtaining such small variation or less by chance is p = .014. Thus, TIVA corroberates the results based on the incredibility index that the reported results are too good to be true.
Another new method is z-curve. Z-curve fits a model to the density distribution of significant z-scores. The aim is not to show bias, but to estimate the true average power after correcting for bias. The figure shows that the point estimate of 53% is high, but the 95%CI ranges from 5% (all 5 significant results are false positives) to 100% (all 5 results are perfectly replicable). In other words, the data provide no empirical evidence despite five significant results. The reason is that selection bias introduces uncertainty about the true values and the data are too weak to reduce this uncertainty.
The plot also shows visually how unlikely the pile of z-scores between 2 and 2.8 is. Given normal sampling error there should be some non-significant results and some highly significant (p < .005, z > 2.8) results.
In conclusion, Krüger et al.’s multiple-study article cannot be used by Forster et al. as evidence that their findings have been replicated with credible evidence by independent researchers because the article contains no empirical evidence.
The evidence of low power in a multiple study article also shows a dissociation between Klaus Fiedler’s verbal endorsement of the need to improve replicability as co-author of the Asendorpf et al. article and his actions as author of an incredible multiple-study article.
There is little excuse for the use of small samples in Krüger et al.’s set of five studies. Participants in all five studies were recruited from Mturk and it would have been easy to conduct more powerful and credible tests of the key hypotheses in the article. Whether these tests would have supported the predictions or not remains an open question.
Automated Analysis of Time Trends
It is very time consuming to carefully analyze individual articles. However, it is possible to use automated extraction of test statistics to examine time trends. I extracted test statistics from social psychology articles that included Klaus Fiedler as an author. All test statistics were converted into absolute z-scores as a common metric of the strength of evidence against the null-hypothesis. Because only significant results can be used as empirical support for predictions of an effect, I limited the analysis to significant results (z > 1.96). I computed the median z-score and plotted them as a function of publication year.
The plot shows a slight increase in strength of evidence (annual increase = 0.009 standard deviations), which is not statistically significant, t(16) = 0.30. Visual inspection shows no notable increase after 2011 when the replication crisis started or 2013 when Klaus Fiedler co-authored the article on ways to improve psychological science.
Given the lack of evidence for improvement, I collapsed the data across years to examine the general replicability of Klaus Fiedler’s work.
The estimate of 73% replicability suggests that randomly drawing a published result from one of Klaus Fiedler’s articles has a 73% chance of being replicated if the study and analysis was repeated exactly. The 95%CI ranges from 68% to 77% showing relatively high precision in this estimate. This is a respectable estimate that is consistent with the overall average of psychology and higher than the average of social psychology (Replicability Rankings). The average for some social psychologists can be below 50%.
Despite this somewhat positive result, the graph also shows clear evidence of publication bias. The vertical red line at 1.96 indicates the boundary for significant results on the right and non-significant results on the left. Values between 1.65 and 1.96 are often published as marginally significant (p < .10) and interpreted as weak support for a hypothesis. Thus, the reporting of these results is not an indication of honest reporting of non-significant results. Given the distribution of significant results, we would expect more (grey line) non-significant results than are actually reported. The aim of reforms such as those recommended by Fiedler himself in the 2013 article is to reduce the bias in favor of significant results.
There is also clear evidence of heterogeneity in strength of evidence across studies. This is reflected in the average power estimates for different segments of z-scores. Average power for z-scores between 2 and 2.5 is estimated to be only 45%, which also implies that after bias-correction the corresponding p-values are no longer significant because 50% power corresponds to p = .05. Even z-scores between 2.5 and 3 average only 53% power. All of the z-scores from the 2014 article are in the range between 2 and 2.8 (p < .05 & p > .005). These results are unlikely to replicate. However, other results show strong evidence and are likely to replicate. In fact, a study by Klaus Fiedler was successfully replicated in the OSC replication project. This was a cognitive study with a within-subject design and a z-score of 3.54.
The next Figure shows the model fit for models with a fixed percentage of false positive results.
Model fit starts to deteriorate notably with false positive rates of 40% or more. This suggests that the majority of published results by Klaus Fiedler are true positives. However, selection for significance can inflate effect size estimates. Thus, observed effect sizes estimates should be adjusted.
Conclusion
In conclusion, it is easier to talk about improving replicability in psychological science, particularly experimental social psychology, than to actually implement good practices. Even prominent researchers like Klaus Fiedler have responsibilities to their students to publish as much as possible. As long as reputation is measured in terms of number of publications and citations, this will not change.
Fortunately, it is now possible to quantify replicability and to use these measures to reward research that require more resources to provide replicable and credible evidence without the use of questionable research practices. Based on these metrics, the article by Krüger et al. is not the norm for publications by Klaus Fiedler and Klaus Fiedler’s replicability index of 73 is higher than the index of other prominent experimental social psychologists.
An easy way to improve it further would be to retract the weak T. Krüger et al. article. This would not be a costly retraction because the article has not been cited in Web of Science so far (no harm, no foul). In contrast, the Asendorph et al. (2013) article has been cited 245 times and is Klaus Fiedler’s second most cited article in WebofScience.
The message is clear. Psychology is not in the year 2010 anymore. The replicability revolution is changing psychology as we speak. Before 2010, the norm was to treat all published significant results as credible evidence and nobody asked how stars were able to report predicted results in hundreds of studies. Those days are over. Nobody can look at a series of p-values of .02, .03, .049, .01, and .05 and be impressed by this string of statistically significant results. Time to change the saying “publish or perish” to “publish real results or perish.”
Please see the new post on rankings of psychology departments that is based on all areas of psychology and covers the years from 2010 to 2015 with separate information for the years 2012-2015.
Old post on rankings of social psychology research at 100 Psychology Departments
This post provides the first analysis of replicability for individual departments. The table focuses on social psychology and the results cannot be generalized to other research areas in the same department. An explanation of the rational and methodology of replicability rankings follows in the text below the table.
Replicability scores of 50% and less are considered inadequate (grade F). The reason is that less than 50% of the published results are expected to produce a significant result in a replication study, and with less than 50% successful replications, the most rational approach is to treat all results as false because it is unclear which results would replicate and which results would not replicate.
RATIONALE AND METHODOLOGY
University rankings have become increasingly important in science. Top ranking universities use these rankings to advertise their status. The availability of a single number of quality and distinction creates pressures on scientists to meet criteria that are being used for these rankings. One key criterion is the number of scientific articles that are being published in top ranking scientific journals under the assumption that these impact factors of scientific journals track the quality of scientific research. However, top ranking journals place a heavy premium on novelty without ensuring that novel findings are actually true discoveries. Many of these high-profile discoveries fail to replicate in actual replication studies. The reason for the high rate of replication failures is that scientists are rewarded for successful studies, while there is no incentive to publish failures. The problem is that many of these successful studies are obtained with the help of luck or questionable research methods. For example, scientists do not report studies that fail to support their theories. The problem of bias in published results has been known for a long time (Sterling, 1959). However, few researchers were aware of the extent of the problem. New evidence suggests that more than half of published results provide false or extremely biased evidence. When more than half of published results are not credible, a science loses its credibility because it is not clear which results can be trusted and which results provide false information.
The credibility and replicability of published findings varies across scientific disciplines (Fanelli, 2010). More credible sciences are more willing to conduct replication studies and to revise original evidence. Thus, it is inappropriate to make generalized claims about the credibility of science. Even within a scientific discipline credibility and replicability can vary across sub-disciplines. For example, results from cognitive psychology are more replicable than results from social psychology. The replicability of social psychological findings is extremely low. Despite an increase in sample size, which makes it easier to obtain a significant result in a replication study, only 5 out of 38 replication studies produced a significant result. If the replication studies had used the same sample sizes as the original studies, only 3 out of 38 results would have replicated, that is, produced a significant result in the replication study. Thus, most published results in social psychology are not trustworthy.
There have been mixed reactions by social psychologists to the replication crisis in social psychology. On the one hand, prominent leaders of the field have defended the status quo with the following arguments.
1 – The experiments who conducted the replication studies are incompetent (Bargh, Schnall, Gilbert).
2 – A mysterious force makes effects disappear over time (Schooler).
3 – A statistical artifact (regression to the mean) will always make it harder to find significant results in a replication study (Fiedler).
4 – It is impossible to repeat social psychological studies exactly and a replication study is likely to produce different results than an original study (the hidden moderator) (Schwarz, Strack).
These arguments can be easily dismissed because they do not explain why cognitive psychologists and other scientific disciplines have more successful replications and more failed results. The real reason for the low replicability of social psychology is that social psychologists conduct many, relatively cheap studies that often fail to produce the expected results. They then conduct exploratory data analyses to find unexpected patterns in the data or they simply discard the study and publish only studies that support a theory that is consistent with the data (Bem). This hazardous approach to science can produce false positive results. For example, it allowed Bem (2011) to publish 9 significant results that seemed to show that humans can foresee unpredictable outcomes in the future. Some prominent social psychologists defend this approach to science.
“We did run multiple studies, some of which did not work, and some of which worked better than others. You may think that not reporting the less successful studies is wrong, but that is how the field works.” (Roy Baumeister,)
The lack of rigorous scientific standards also allowed Diederik Stapel, a prominent social psychologist to fabricate data, which led to over 50 retractions of scientific articles. The commission that investigated Stapel came to the conclusion that he was only able to publish so many fake articles because social psychology is a “sloppy science,” where cute findings and sexy stories count more than empirical facts.
Social psychology faces a crisis of confidence. While social psychology tried hard to convince the general public that it is a real science, it actually failed to follow standard norms of science to ensure that social psychological theories are based on objective replicable findings. Social psychology therefore needs to reform its practices if it wants to be taken serious as a scientific field that can provide valuable insights into important question about human nature and human behavior.
There are many social psychologists who want to improve scientific standards. For example, the head of the OSF-reproducibility project, Brian Nosek, is a trained social psychologist. Mickey Inzlicht published a courageous self-analysis that revealed problems in some of his most highly cited articles and changed the way his lab is conducting studies to improve social psychology. Incoming editors of social psychology journals are implementing policies to increase the credibility of results published in their journals (Simine Vazire; Roger Giner-Sorolla). One problem for social psychologists willing to improve their science is that the current incentive structure does not reward replicability. The reason is that it is possible to count number of articles and number of citations, but it seems difficult to quantify replicability and scientific integrity.
To address this problem, Jerry Brunner and I developed a quantitative measure of replicability. The replicability-score uses published statistical results (p-values) and transforms them into absolute z-scores. The distribution of z-scores provides information about the statistical power of a study given the sample size, design, and observed effect size. Most important, the method takes publication bias into account and can estimate the true typical power of published results. It also reveals the presence of a file-drawer of unpublished failed studies, if the published studies contain more significant results than the actual power of studies allows. The method is illustrated in the following figure that is based on t- and F-tests published in the most important journals that publish social psychology research.
The green curve in the figure illustrates the distribution of z-scores that would be expected if a set of studies had 53% power. That is, random sampling error will sometimes inflate the observed effect size and sometimes deflate the observed effect size in a sample relative to the population effect size. With 54% power, there would be 46% (1 – .54 = .46) non-significant results because the study had insufficient power to demonstrate an effect that actually exists. The graph shows that the green curve fails to describe the distribution of observed z-scores. On the one hand, there are more extremely high z-scores. This reveals that the set of studies is heterogeneous. Some studies had more than 54% power and others had less than 54% power. On the other hand, there are fewer non-significant results than the green curve predicts. This discrepancy reveals that non-significant results are omitted from the published reports.
Given the heterogeneity of true power, the red curve is more appropriate. It provides the best fit to the observed z-scores that are significant (z-scores > 2). It does not model the z-scores below 2 because non-significant z-scores are not reported. The red-curve gives a lower estimate of power and shows a much larger file-drawer.
I limit the power analysis to z-scores in the range from 2 to 4. The reason is that z-scores greater than 4 imply very high power (> 99%). In fact, many of these results tend to replicate well. However, many theoretically important findings are published with z-scores less than 4 as evidence. These z-scores do not replicate well. If social psychology wants to improve its replicability, social psychologists need to conduct fewer studies with more statistical power that yield stronger evidence and they need to publish all studies to reduce the file-drawer.
To provide an incentive to increase the scientific standards in social psychology, I computed the replicability-score (homogeneous model for z-scores between 2 and 4) for different journals. Journal editors can use the replicability rankings to demonstrate that their journal publishes replicable results. Here I report the first rankings of social psychology departments. To rank departments, I searched the database of articles published in social psychology journals for the affiliation of articles’ authors. The rankings are based on the z-scores of these articles published in the years 2010 to 2014. I also conducted an analysis for the year 2015. However, the replicability scores were uncorrelated with those in 2010-2014 (r = .01). This means that the 2015 results are unreliable because the analysis is based on too few observations. As a result, the replicability rankings of social psychology departments cannot reveal recent changes in scientific practices. Nevertheless, they provide a first benchmark to track replicability of psychology departments. This benchmark can be used by departments to monitor improvements in scientific practices and can serve as an incentive for departments to create policies and reward structures that reward scientific integrity over quantitative indicators of publication output and popularity. Replicabilty is only one aspect of high-quality research, but it is a necessary one. Without sound empirical evidence that supports a theoretical claim, discoveries are not real discoveries.
The OSF-Reproducibility-Project examined the replicability of 99 statistical results published in three psychology journals. The journals covered mostly research in cognitive psychology and social psychology. An article in Science, reported that only 35% of the results were successfully replicated (i.e., produced a statistically significant result in the replication study).
I have conducted more detailed analyses of replication studies in social psychology and cognitive psychology. Cognitive psychology had a notably higher success rate (50%, 19 out of 38) than social psychology (8%, 3 out of 38). The main reason for this discrepancy is that social psychologists and cognitive psychologists use different designs. Whereas cognitive psychologists typically use within-subject designs with many repeated measurements of the same individual, social psychologists typically assign participants to different groups and compare behavior on a single measure. This so-called between-subject design makes it difficult to detect small experimental effects because it does not control the influence of other factors that influence participants’ behavior (e.g., personality dispositions, mood, etc.). To detect small effects in these noisy data, between-subject designs require large sample sizes.
It has been known for a long time that sample sizes in between-subject designs in psychology are too small to have a reasonable chance to detect an effect (less than 50% chance to find an effect that is actually there) (Cohen, 1962; Schimmack, 2012; Sedlmeier & Giegerenzer, 1989). As a result, many studies fail to find statistically significant results, but these studies are not submitted for publication. Thus, only studies that achieved statistical significance with the help of chance (the difference between two groups is inflated by uncontrolled factors such as personality) are reported in journals. The selective reporting of lucky results creates a bias in the published literature that gives a false impression of the replicability of published results. The OSF-results for social psychology make it possible to estimate the consequences of publication bias on the replicability of results published in social psychology journals.
A naïve estimate of the replicability of studies would rely on the actual success rate in journals. If journals would publish significant and non-significant results, this would be a reasonable approach. However, journals tend to publish exclusively significant results. As a result, the success rate in journals (over 90% significant results; Sterling, 1959; Sterling et al., 1995) gives a drastically inflated estimate of replicability.
A somewhat better estimate of replicability can be obtained by computing post-hoc power based on the observed effect sizes and sample sizes of published studies. Statistical power is the long-run probability that a series of exact replication studies with the same sample size would produce significant results. Cohen (1962) estimated that the typical power of psychological studies is about 60%. Thus, even for 100 studies that all reported significant results, only 60 are expected to produce a significant result again in the replication attempt.
The problem with Cohen’s (1962) estimate of replicability is that post-hoc-power analysis uses the reported effect sizes as an estimate of the effect size in the population. However, due to the selection bias in journals, the reported effect sizes and power estimates are inflated. In collaboration with Jerry Brunner, I have developed an improved method to estimate typical power of reported results that corrects for the inflation in reported effect sizes. I applied this method to results from 38 social psychology articles included in the OSF-reproducibility project and obtained a replicability estimate of 35%.
The OSF-reproducbility project provides another opportunity to estimate the replicability of results in social psychology. The OSF-project selected a representative set of studies from two journals and tried to reproduce the same experimental conditions as closely as possible. This should produce unbiased results and the success rate provides an estimate of replicability. The advantage of this method is that it does not rely on statistical assumptions. The disadvantage is that the success rate depends on the ability to exactly recreate the conditions of the original studies. Any differences between studies (e.g., recruiting participants from different populations) can change the success rate. The OSF replication studies also often changed the sample size of the replication study, which will also change the success rate. If sample sizes in a replication study are larger, power increases and the success rate no longer can be used as an estimate of the typical replicability of social psychology. To address this problem, it is possible to apply a statistical adjustment and use the success rate that would have occurred with the original sample sizes. I found that 5 out of 38 (13%) produced significant results and after correcting for the increase in sample size, replicability was only 8% (3 out of 38).
One important question is how how representative the 38 results from the OSF-project are for social psychology in general. Unfortunately, it is practically impossible and too expensive to conduct a large number of exact replication studies. In comparison, it is relatively easy to apply post-hoc power analysis to a large number of statistical results reported in social psychology. Thus, I examined the representativeness of the OSF-reproducibility results by comparing the results of my post-hoc power analysis based on the 38 results in the OSF to a post-hoc-power analysis of a much larger number of results reported in major social psychology journals .
I downloaded articles from 12 social psychology journals, which are the primary outlets for publishing experimental social psychology research: Basic and Applied Social Psychology, British Journal of Social Psychology, European Journal of Social Psychology, Journal of Experimental Social Psychology, Journal of Personality and Social Psychology: Attitudes and Social Cognition, Journal of Personality and Social Psychology: Interpersonal Relationships and Group Processes, Journal of Social and Personal Relationships, Personal Relationships, Personality and Social Psychology Bulletin, Social Cognition, Social Psychology and Personality Science, Social Psychology.
I converted pdf files into text files and searched for all reports of t-tests or F-tests and converted the reported test-statistic into exact two-tailed p-values. The two-tailed p-values were then converted into z-scores by finding the z-score corresponding to the probability of 1-p/2, with p equal the two-tailed p-value. The total number of z-scores included in the analysis is 134,929.
I limited my estimate of power to z-scores in the range between 2 and 4. Z-scores below 2 are not statistically significant (z = 1.96, p = .05). Sometimes these results are reported as marginal evidence for an effect, sometimes they are reported as evidence that an effect is not present, and sometimes they are reported without an inference about the population effect. It is more important to determine the replicability of results that are reported as statistically significant support for a prediction. Z-scores greater than 4 were excluded because z-scores greater than 4 imply that this test had high statistical power (> 99%). Many of these results replicated successfully in the OSF-project. Thus, a simple rule is to assign a success rate of 100% to these findings. The Figure below shows the distribution of z-scores in the range form z = 0 to6, but the power estimate is applied to z-scores in the range between 2 and 4 (n = 66,212).
The power estimate based on the post-hoc-power curve for z-scores between 2 and 4 is 46%. It is important to realize that this estimate is based on 70% of all significant results that were reported. As z-scores greater than 4 essentially have a power of 100%, the overall power estimate for all statistical tests that were reported is .46*.70 + .30 = .62. It is also important to keep in mind that this analysis uses all statistical tests that were reported including manipulation checks (e.g., pleasant picture were rated as more pleasant than unpleasant pictures). For this reason, the range of z-scores is limited to values between 2 and 4, which is much more likely to reflect a test of a focal hypothesis.
46% power for z-scores between 2 and 4 of is a higher estimate than the estimate for the 38 studies in the OSF-reproducibility project (35%). This suggests that the estimated replicability based on the OSF-results is an underestimation of the true replicability. The discrepancy between predicted and observed replicability in social psychology (8 vs. 38) and cognitive psychology (50 vs. 75), suggests that the rate of actual successful replications is about 20 to 30% lower than the success rate based on statistical prediction. Thus, the present analysis suggests that actual replication attempts of results in social psychology would produce significant results in about a quarter of all attempts (46% – 20% = 26%).
The large sample of test results makes it possible to make more detailed predictions for results with different strength of evidence. To provide estimates of replicability for different levels of evidence, I conducted post-hoc power analysis for intervals of half a standard deviation (z = .5). The power estimates are:
Strength of Evidence Power
2.0 to 2.5 33%
2.5 to 3.0 46%
3.0 to 3.5 58%
3.5 to 4.0 72%
IMPLICATIONS FOR PLANNING OF REPLICATION STUDIES
These estimates are important for researchers who are aiming to replicate a published study in social psychology. The reported effect sizes are inflated and a replication study with the same sample size has a low chance to produce a significant result even if a smaller effect exists. To conducted a properly powered replication study, researchers would have to increase sample sizes. To illustrate, imagine that a study demonstrate a significant difference between two groups with 40 participants (20 in each cell) with a z-score of 2.3 (p = .02, two-tailed). The observed power for this result is 65% and it would suggest that a slightly larger sample of N = 60 is sufficient to achieve 80% power (80% chance to get a significant result). However, after correcting for bias, the true power is more likely to be just 33% (see table above) and power for a study with N = 60 would still only be 50%. To achieve 80% power, the replication study would need a sample size of 130 participants. Sample sizes would need to be even larger taking into account that the actual probability of a successful replication is even lower than the probability based on post-hoc power analysis. In the OSF-project only 1 out of 30 studies with an original z-score between 2 and 3 was successfully replicated.
IMPLICATIONS FOR THE EVALUATION OF PUBLISHED RESULTS
The results also have implications for the way social psychologists should conduct and evaluate new research. The main reason why z-scores between 2 and 3 provide untrustworthy evidence for an effect is that they are obtained with underpowered studies and publication bias. As a result, it is likely that the strength of evidence is inflated. If, however, the same z-scores were obtained in studies with high power, a z-score of 2.5 would provide more credible evidence for an effect. The strength of evidence in a single study would still be subject to random sampling error, but it would no longer be subject to systematic bias. Therefore, the evidence would be more likely to reveal a true effect and it would be less like to be a false positive. This implies that z-scores should be interpreted in the context of other information about the likelihood of selection bias. For example, a z-score of 2.5 in a pre-registered study provides stronger evidence for an effect than the same z-score in a study where researchers may have had a chance to conduct multiple studies and to select the most favorable results for publication.
The same logic can also be applied to journals and labs. A z-score of 2.5 in a journal with an average z-score of 2.3 is less trustworthy than a z-score of 2.5 in a journal with an average z-score of 3.5. In the former journal, a z-score of 2.5 is likely to be inflated, whereas in the latter journal a z-score of 2.5 is more likely to be negatively biased by sampling error. For example, currently a z-score of 2.5 is more likely to reveal a true effect if it is published in a cognitive journal than a social journal (see ranking of psychology journals).
The same logic applies even more strongly to labs because labs have a distinct research culture (MO). Some labs conduct many underpowered studies and publish only the studies that worked. Other labs may conduct fewer studies with high power. A z-score of 2.5 is more trustworthy if it comes from a lab with high average power than from a lab with low average power. Thus, providing information about the post-hoc-power of individual researchers can help readers to evaluate the strength of evidence of individual studies in the context of the typical strength of evidence that is obtained in a specific lab. This will create an incentive to publish results with strong evidence rather than fishing for significant results because a low replicability index increases the criterion at which results from a lab provide evidence for an effect.
Abstract: I predicted the replicability of 38 social psychology results in the OSF-Reproducibility Project. Based on post-hoc-power analysis I predicted a success rate of 35%. The actual success rate was 8% (3 out of 38) and post-hoc-power was estimated to be 3% for 36 out of 38 studies (5% power = type-I error rate, meaning the null-hypothesis is true).
The OSF-Reproducibility Project aimed to replicate 100 results published in original research articles in three psychology journals in 2008. The selected journals focus on publishing results from experimental psychology. The main paradigm of experimental psychology is to recruit samples of participants and to study their behaviors in controlled laboratory conditions. The results are then generalized to the typical behavior of the average person.
An important methodological distinction in experimental psychology is the research design. In a within-subject design, participants are exposed to several (a minimum of two) situations and the question of interest is whether responses to one situation differ from behavior in other situations. The advantage of this design is that individuals serve as their own controls and variation due to unobserved causes (mood, personality, etc.) does not influence the results. This design can produce high statistical power to study even small effects. The design is often used by cognitive psychologists because the actual behaviors are often simple behaviors (e.g., pressing a button) that can be repeated many times (e.g., to demonstrate interference in the Stroop paradigm).
In a between-subject design, participants are randomly assigned to different conditions. A mean difference between conditions reveals that the experimental manipulation influenced behavior. The advantage of this design is that behavior is not influenced by previous behaviors in the experiment (carry over effects). The disadvantage is that many uncontrolled factors (e..g, mood, personality) also influence behavior. As a result, it can be difficult to detect small effects of an experimental manipulation among all of the other variance that is caused by uncontrolled factors. As a result, between-subject designs require large samples to study small effects or they can only be used to study large effects.
One of the main findings of the OSF-Reproducibility Project was that results from within-subject designs used by cognitive psychology were more likely to replicate than results from between-subject designs used by social psychologists. There were two few between-subject studies by cognitive psychologists or within-subject designs by social psychologists to separate these factors. This result of the OSF-reproducibility project was predicted by PHP-curves of the actual articles as well as PHP-curves of cognitive and social journals (Replicability-Rankings).
Given the reliable difference between disciplines within psychology, it seems problematic to generalize the results of the OSF-reproducibility project to all areas of psychology. The Replicability-Rankings suggest that social psychology has a lower replicability than other areas of psychology. For this reason, I conducted separate analyses for social psychology and for cognitive psychology. Other areas of psychology had two few studies to conduct a meaningful analysis. Thus, the OSF-reproducibility results should not be generalized to all areas of psychology.
The master data file of the OSF-reproducibilty project contained 167 studies with replication results for 99 studies. 57 studies were classified as social studies. However, this classification used a broad definition of social psychology that included personality psychology and developmental psychology. It included six articles published in the personality section of the Journal of Personality and Social Psychology. As each section functions essentially like an independent journal, I excluded all studies from this section. The file also contained two independent replications of two experiments (experiment 5 and 7) in Albarracín et al. (2008; DOI: 10.1037/a0012833). As the main sampling strategy was to select the last study of each article, I only included Study 7 in the analysis (Study 5 did not replicate, p = .77). Thus, my selection did not lower the rate of successful replications. There were also two independent replications of the same result in Bressan and Stranieri (2008). Both replications produced non-significant results (p = .63, p = .75). I selected the replication study with the larger sample (N = 318 vs. 259). I also excluded two studies that were not independent replications. Rule and Ambady (2008) examined the correlation between facial features and success of CEOs. The replication study had new raters to rate the faces, but used the same faces. Heine, Buchtel, and Norenzayan (2008) examined correlates of conscientiousness across nations and the replication study examined the same relationship across the same set of nations. I also excluded replications of non-significant results because non-significant results provide ambiguous information and cannot be interpreted as evidence for the null-hypothesis. For this reason, it is not clear how the results of a replication study should be interpreted. Two underpowered studies could easily produce consistent results that are both type-II errors. For this reason, I excluded Ranganath and Nosek (2008) and Eastwick and Finkel (2008). The final sample consisted of 38 articles.
I first conducted a post-hoc-power analysis of the reported original results. Test statistics were first converted into two-tailed p-values and two-tailed p-values were converted into absolute z-scores using the formula (1 – norm.inverse(1-p/2). Post-hoc power was estimated by fitting the observed z-scores to predicted z-scores with a mixed-power model with three parameters (Brunner & Schimmack, in preparation).
Estimated power was 35%. This finding reflects the typical finding that reported results are a biased sample of studies that produced significant results, whereas non-significant results are not submitted for publication. Based on this estimate, one would expect that only 35% of the 38 findings (k = 13) would produce a significant result in an exact replication study with the same design and sample size.
The Figure visualizes the discrepancy between observed z-scores and the success rate in the original studies. Evidently, the distribution is truncated and the mode of the curve (it’s highest point) is projected to be on the left side of the significance criterion (z = 1.96, p = .05 (two-tailed)). Given the absence of reliable data in the range from 0 to 1.96, the data make it impossible to estimate the exact distribution in this region, but the step decline of z-scores on the right side of the significance criterion suggests that many of the significant results achieved significance only with the help of inflated observed effect sizes. As sampling error is random, these results will not replicate again in a replication study.
The replication studies had different sample sizes than the original studies. This makes it difficult to compare the prediction to the actual success rate because the actual success rate could be much higher if the replication studies had much larger samples and more power to replicate effects. For example, if all replication studies had sample sizes of N = 1,000, we would expect a much higher replication rate than 35%. The median sample size of the original studies was N = 86. This is representative of studies in social psychology. The median sample size of the replication studies was N = 120. Given this increase in power, the predicted success rate would increase to 50%. However, the increase in power was not uniform across studies. Therefore, I used the p-values and sample size of the replication study to compute the z-score that would have been obtained with the original sample size and I used these results to compare the predicted success rate to the actual success rate in the OSF-reproducibility project.
The depressing finding was that the actual success rate was much lower than the predicted success rate. Only 3 out of 38 results (8%) produced a significant result (without the correction of sample size 5 findings would have been significant). Even more depressing is the fact that a 5% criterion, implies that every 20 studies are expected to produce a significant result just by chance. Thus, the actual success rate is close to the success rate that would be expected if all of the original results were false positives. A success rate of 8% would imply that the actual power of the replication studies was only 8%, compared to the predicted power of 35%.
The next figure shows the post-hoc-power curve for the sample-size corrected z-scores.
The PHP-Curve estimate of power for z-scores in the range from 0 to 4 is 3% for the homogeneous case. This finding means that the distribution of z-scores for 36 of the 38 results is consistent with the null-hypothesis that the true effect size for these effects is zero. Only two z-scores greater than 4 (one shown, the other greater than 6 not shown) appear to be replicable and robust effects.
One replicable finding was obtained in a study by Halevy, Bornstein, and Sagiv. The authors demonstrated that allocation of money to in-group and out-group members is influenced much more by favoring the in-group than by punishing the out-group. Given the strong effect in the original study (z > 4), I had predicted that this finding would replicate.
The other successful replication was a study by Lemay and Clark (DOI: 10.1037/0022-3514.94.4.647). The replicated finding was that participants’ projected their own responsiveness in a romantic relationship onto their partners’ responsiveness while controlling for partners’ actual responsiveness. Given the strong effect in the original study (z > 4), I had predicted that this finding would replicate.
Based on weak statistical evidence in the original studies, I had predicted failures of replication for 25 studies. Given the low success rate, it is not surprising that my success rate was 100.
I made the wrong prediction for 11 results. In all cases, I predicted a successful replication when the outcome was a failed replication. Thus, my overall success rate was 27/38 = 71%. Unfortunately, this success rate is easily beaten by a simple prediction rule that nothing in social psychology replicates, which is wrong in only 3 out of 38 predictions (89% success rate).
Below I briefly comment on the 11 failed predictions.
1 Based on strong statistics (z > 4), I had predicted a successful replication for Förster, Liberman, and Kuschel (DOI: 10.1037/0022-3514.94.4.579). However, even when I made this predictions based on the reported statistics, I had my doubts about this study because statisticians had discovered anomalies in Jens Förster’s studies that cast doubt on the validity of these reported results. Post-hoc power analysis can correct for publication bias, but it cannot correct for other sources of bias that lead to vastly inflated effect sizes.
2 I predicted a successful replication of Payne, MA Burkley, MB Stokes. The replication study actually produced a significant result, but it was no longer significant after correcting for the larger sample size in the replication study (180 vs. 70, p = .045 vs. .21). Although the p-value in the replication study is not very reassuring, it is possible that this is a real effect. However, the original result was probably still inflated by sampling error to produce a z-score of 2.97.
3 I predicted a successful replication of McCrae (DOI: 10.1037/0022-3514.95.2.274). This prediction was based on a transcription error. Whereas the z-score for the target effect was 1.80, I posted a z-score of 3.5. Ironically, the study did successfully replicate with a larger sample size, but the effect was no longer significant after adjusting the result for sample size (N = 61 vs. N = 28). This study demonstrates that marginally significant effects can reveal real effects, but it also shows that larger samples are needed in replication studies to demonstrate this.
4 I predicted a successful replication for EP Lemay, MS Clark (DOI: 10.1037/0022-3514.95.2.420). This prediction was based on a transcription error because EP Lemay and MS Clark had another study in the project. With the correct z-score of the original result (z = 2.27), I would have predicted correctly that the result would not replicate.
5 I predicted a successful replication of Monin, Sawyer, and Marquez (DOI: 10.1037/0022-3514.95.1.76) based on a strong result for the target effect (z = 3.8). The replication study produced a z-score of 1.45 with a sample size that was not much larger than the original study (N = 75 vs. 67).
6 I predicted a successful replication for Shnabel and Nadler (DOI: 10.1037/0022-3514.94.1.116). The replication study increased sample size by 50% (Ns = 141 vs. 94), but the effect in the replication study was modest (z = 1.19).
7 I predicted a successful replication for van Dijk, van Kleef, Steinel, van Beest (DOI: 10.1037/0022-3514.94.4.600). The sample size in the replication study was slightly smaller than in the original study (N = 83 vs. 103), but even with adjustment the effect was close to zero (z = 0.28).
8 I predicted a successful replication of V Purdie-Vaughns, CM Steele, PG Davies, R Ditlmann, JR Crosby (DOI: 10.1037/0022-3514.94.4.615). The original study had rather strong evidence (z = 3.35). In this case, the replication study had a much larger sample than the original study (N = 1,490 vs. 90) and still did not produce a significant result.
9 I predicted a successful replication of C Farris, TA Treat, RJ Viken, RM McFall (doi:10.1111/j.1467-9280.2008.02092.x). The replication study had a somewhat smaller sample (N = 144 vs. 280), but even with adjustment of sample size the effect in the replication study was close to zero (z = 0.03).
10 I predicted a successful replication of KD Vohs and JW Schooler (doi:10.1111/j.1467-9280.2008.02045.x)). I made this prediction of generally strong statistics, although the strength of the target effect was below 3 (z = 2.8) and the sample size was small (N = 30). The replication study doubled the sample size (N = 58), but produced weak evidence (z = 1.08). However, even the sample size of the replication study is modest and does not allow strong conclusions about the existence of the effect.
11 I predicted a successful replication of Blankenship and Wegener (DOI: 10.1037/0022-3514.94.2.94.2.196). The article reported strong statistics and the z-score for the target effect was greater than 3 (z = 3.36). The study also had a large sample size (N = 261). The replication study also had a similarly large sample size (N = 251), but the effect was much smaller than in the original study (z = 3.36 vs. 0.70).
In some of these failed predictions it is possible that the replication study failed to reproduce the same experimental conditions or that the population of the replication study differs from the population of the original study. However, there are twice as many studies where the failure of replication was predicted based on weak statistical evidence and the presence of publication bias in social psychology journals.
In conclusion, this set of results from a representative sample of articles in social psychology reported a 100% success rate. It is well known that this success rate can only be achieved with selective reporting of significant results. Even the inflated estimate of median observed power is only 71%, which shows that the success rate of 100% is inflated. A power estimate that corrects for inflation suggested that only 35% of results would replicate, and the actual success rate is only 8%. While mistakes by the replication experimenters may contribute to the discrepancy between the prediction of 35% and the actual success rate of 8%, it was predictable based on the results in the original studies that the majority of results would not replicate in replication studies with the same sample size as the original studies.
This low success rate is not characteristic of other sciences and other disciplines in psychology. As mentioned earlier, the success rate for cognitive psychology is higher and comparisons of psychological journals show that social psychology journals have lower replicability than other journals. Moreover, an analysis of time trends shows that replicability of social psychology journals has been low for decades and some journals even show a negative trend in the past decade.
The low replicability of social psychology has been known for over 50 years, when Cohen examined the replicability of results published in the Journal of Social and Abnormal Psychology (now Journal of Personality and Social Psychology), the flagship journal of social psychology. Cohen estimated a replicability of 60%. Social psychologists would rejoice if the reproducibility project had shown a replication rate of 60%. The depressing result is that the actual replication rate was 8%.
The main implication of this finding is that it is virtually impossible to trust any results that are being published in social psychology journals. Yes, two articles that posted strong statistics (z > 4) replicated, but several results with equally strong statistics did not replicate. Thus, it is reasonable to distrust all results with z-scores below 4 (4 sigma rule), but not all results with z-scores greater than 4 will replicate.
Given the low credibility of original research findings, it will be important to raise the quality of social psychology by increasing statistical power. It will also be important to allow publication of non-significant results to reduce the distortion that is created by a file-drawer filled with failed studies. Finally, it will be important to use stronger methods of bias-correction in meta-analysis because traditional meta-analysis seemed to show strong evidence even for incredible effects like premonition for erotic stimuli (Bem, 2011).
In conclusion, the OSF-project demonstrated convincingly that many published results in social psychology cannot be replicated. If social psychology wants to be taken seriously as a science, it has to change the way data are collected, analyzed, and reported and demonstrate replicability in a new test of reproducibility.
The silver lining is that a replication rate of 8% is likely to be an underestimation and that regression to the mean alone might lead to some improvement in the next evaluation of social psychology.
Neyman & Pearson (1933) developed the theory of type-I and type-II errors in statistical hypothesis testing.
A type-I error is defined as the probability of rejecting the null-hypothesis (i.e., the effect size is zero) when the null-hypothesis is true.
A type-II error is defined as the probability of failing to reject the null-hypothesis when the null-hypothesis is false (i.e., there is an effect).
A common application of statistics is to provide empirical evidence for a theoretically predicted relationship between two variables (cause-effect or covariation). The results of an empirical study can produce two outcomes. Either the result is statistically significant or it is not statistically significant. Statistically significant results are interpreted as support for a theoretically predicted effect.
Statistically non-significant results are difficult to interpret because the prediction may be false (the null-hypothesis is true) or a type-II error occurred (the theoretical prediction is correct, but the results fail to provide sufficient evidence for it).
To avoid type-II errors, researchers can design studies that reduce the type-II error probability. The probability of avoiding a type-II error when a predicted effect exists is called power. It could also be called the probability of success because a significant result can be used to provide empirical support for a hypothesis.
Ideally researchers would want to maximize power to avoid type-II errors. However, powerful studies require more resources. Thus, researchers face a trade-off between the allocation of resources and their probability to obtain a statistically significant result.
Jacob Cohen dedicated a large portion of his career to help researchers with the task of planning studies that can produce a successful result, if the theoretical prediction is true. He suggested that researchers should plan studies to have 80% power. With 80% power, the type-II error rate is still 20%, which means that 1 out of 5 studies in which a theoretical prediction is true would fail to produce a statistically significant result.
Cohen (1962) examined the typical effect sizes in psychology and found that the typical effect size for the mean difference between two groups (e.g., men and women or experimental vs. control group) is about half-of a standard deviation. The standardized effect size measure is called Cohen’s d in his honor. Based on his review of the literature, Cohen suggested that an effect size of d = .2 is small, d = .5 moderate, and d = .8. Importantly, a statistically small effect size can have huge practical importance. Thus, these labels should not be used to make claims about the practical importance of effects. The main purpose of these labels is that researchers can better plan their studies. If researchers expect a large effect (d = .8), they need a relatively small sample to have high power. If researchers expect a small effect (d = .2), they need a large sample to have high power. Cohen (1992) provided information about effect sizes and sample sizes for different statistical tests (chi-square, correlation, ANOVA, etc.).
Cohen (1962) conducted a meta-analysis of studies published in a prominent psychology journal. Based on the typical effect size and sample size in these studies, Cohen estimated that the average power in studies is about 60%. Importantly, this also means that the typical power to detect small effects is less than 60%. Thus, many studies in psychology have low power and a high type-II error probability. As a result, one would expect that journals often report that studies failed to support theoretical predictions. However, the success rate in psychological journals is over 90% (Sterling, 1959; Sterling, Rosenbaum, & Weinkam, 1995). There are two explanations for discrepancies between the reported success rate and the success probability (power) in psychology. One explanation is that researchers conduct multiple studies and only report successful studies. The other studies remain unreported in a proverbial file-drawer (Rosenthal, 1979). The other explanation is that researchers use questionable research practices to produce significant results in a study (John, Loewenstein, & Prelec, 2012). Both practices have undesirable consequences for the credibility and replicability of published results in psychological journals.
A simple solution to the problem would be to increase the statistical power of studies. If the power of psychological studies in psychology were over 90%, a success rate of 90% would be justified by the actual probability of obtaining significant results. However, meta-analysis and method articles have repeatedly pointed out that psychologists do not consider statistical power in the planning of their studies and that studies continue to be underpowered (Maxwell, 2004; Schimmack, 2012; Sedlmeier & Giegerenzer, 1989).
One reason for the persistent neglect of power could be that researchers have no awareness of the typical power of their studies. This could happen because observed power in a single study is an imperfect indicator of true power (Yuan & Maxwell, 2005). If a study produced a significant result, the observed power is at least 50%, even if the true power is only 30%. Even if the null-hypothesis is true, and researchers publish only type-I errors, observed power is dramatically inflated to 62%, when the true power is only 5% (the type-I error rate). Thus, Cohen’s estimate of 60% power is not very reassuring.
Over the past years, Schimmack and Brunner have developed a method to estimate power for sets of studies with heterogeneous designs, sample sizes, and effect sizes. A technical report is in preparation. The basic logic of this approach is to convert results of all statistical tests into z-scores using the one-tailed p-value of a statistical test. The z-scores provide a common metric for observed statistical results. The standard normal distribution predicts the distribution of observed z-scores for a fixed value of true power. However, for heterogeneous sets of studies the distribution of z-scores is a mixture of standard normal distributions with different weights attached to various power values. To illustrate this method, the histograms of z-scores below show simulated data with 10,000 observations with varying levels of true power: 20% null-hypotheses being true (5% power), 20% of studies with 33% power, 20% of studies with 50% power, 20% of studies with 66% power, and 20% of studies with 80% power.
The plot shows the distribution of absolute z-scores (there are no negative effect sizes). The plot is limited to z-scores below 6 (N = 99,985 out of 10,000). Z-scores above 6 standard deviations from zero are extremely unlikely to occur by chance. Even with a conservative estimate of effect size (lower bound of 95% confidence interval), observed power is well above 99%. Moreover, quantum physics uses Z = 5 as a criterion to claim success (e.g., discovery of Higgs-Boson Particle). Thus, Z-scores above 6 can be expected to be highly replicable effects.
Z-scores below 1.96 (the vertical dotted red line) are not significant for the standard criterion of (p < .05, two-tailed). These values are excluded from the calculation of power because these results are either not reported or not interpreted as evidence for an effect. It is still important to realize that true power of all experiments would be lower if these studies were included because many of the non-significant results are produced by studies with 33% power. These non-significant results create two problems. Researchers wasted resources on studies with inconclusive results and readers may be tempted to misinterpret these results as evidence that an effect does not exist (e.g., a drug does not have side effects) when an effect is actually present. In practice, it is difficult to estimate power for non-significant results because the size of the file-drawer is difficult to estimate.
It is possible to estimate power for any range of z-scores, but I prefer the range of z-scores from 2 (just significant) to 4. A z-score of 4 has a 95% confidence interval that ranges from 2 to 6. Thus, even if the observed effect size is inflated, there is still a high chance that a replication study would produce a significant result (Z > 2). Thus, all z-scores greater than 4 can be treated as cases with 100% power. The plot also shows that conclusions are unlikely to change by using a wider range of z-scores because most of the significant results correspond to z-scores between 2 and 4 (89%).
The typical power of studies is estimated based on the distribution of z-scores between 2 and 4. A steep decrease from left to right suggests low power. A steep increase suggests high power. If the peak (mode) of the distribution were centered over Z = 2.8, the data would conform to Cohen’s recommendation to have 80% power.
Using the known distribution of power to estimate power in the critical range gives a power estimate of 61%. A simpler model that assumes a fixed power value for all studies produces a slightly inflated estimate of 63%. Although the heterogeneous model is correct, the plot shows that the homogeneous model provides a reasonable approximation when estimates are limited to a narrow range of Z-scores. Thus, I used the homogeneous model to estimate the typical power of significant results reported in psychological journals.
DATA
The results presented below are based on an ongoing project that examines power in psychological journals (see results section for the list of journals included so far). The set of journals does not include journals that primarily publish reviews and meta-analysis or clinical and applied journals. The data analysis is limited to the years from 2009 to 2015 to provide information about the typical power in contemporary research. Results regarding historic trends will be reported in a forthcoming article.
I downloaded pdf files of all articles published in the selected journals and converted the pdf files to text files. I then extracted all t-tests and F-tests that were reported in the text of the results section searching for t(df) or F(df1,df2). All t and F statistics were converted into one-tailed p-values and then converted into z-scores.
The plot above shows the results based on 218,698 t and F tests reported between 2009 and 2015 in the selected psychology journals. Unlike the simulated data, the plot shows a steep drop for z-scores just below the threshold of significance (z = 1.96). This drop is due to the tendency not to publish or report non-significant results. The heterogeneous model uses the distribution of non-significant results to estimate the size of the file-drawer (unpublished non-significant results). However, for the present purpose the size of the file-drawer is irrelevant because power is estimated only for significant results for Z-scores between 2 and 4.
The green line shows the best fitting estimate for the homogeneous model. The red curve shows fit of the heterogeneous model. The heterogeneous model is doing a much better job at fitting the long tail of highly significant results, but for the critical interval of z-scores between 2 and 4, the two models provide similar estimates of power (55% homogeneous & 53% heterogeneous model). If the range is extended to z-scores between 2 and 6, power estimates diverge (82% homogenous, 61% heterogeneous). The plot indicates that the heterogeneous model fits the data better and that the 61% estimate is a better estimate of true power for significant results in this range. Thus, the results are in line with Cohen (1962) estimate that psychological studies average 60% power.
REPLICABILITY RANKING
The distribution of z-scores between 2 and 4 was used to estimate the average power separately for each journal. As power is the probability to obtain a significant result, this measure estimates the replicability of results published in a particular journal if researchers would reproduce the studies under identical conditions with the same sample size (exact replication). Thus, even though the selection criterion ensured that all tests produced a significant result (100% success rate), the replication rate is expected to be only about 50%, even if the replication studies successfully reproduce the conditions of the published studies. The table below shows the replicability ranking of the journals, the replicability score, and a grade. Journals are graded based on a scheme that is similar to grading schemes for undergraduate students (below 50 = F, 50-59 = E, 60-69 = D, 70-79 = C, 80-89 = B, 90+ = A).
The average value in 2000-2014 is 57 (D+). The average value in 2015 is 58 (D+). The correlation for the values in 2010-2014 and those in 2015 is r = .66. These findings show that the replicability scores are reliable and that journals differ systematically in the power of published studies.
LIMITATIONS
The main limitation of the method is that focuses on t and F-tests. The results might change when other statistics are included in the analysis. The next goal is to incorporate correlations and regression coefficients.
The second limitation is that the analysis does not discriminate between primary hypothesis tests and secondary analyses. For example, an article may find a significant main effect for gender, but the critical test is whether gender interacts with an experimental manipulation. It is possible that some journals have lower scores because they report more secondary analyses with lower power. To address this issue, it will be necessary to code articles in terms of the importance of statistical test.
The ranking for 2015 is based on the currently available data and may change when more data become available. Readers should also avoid interpreting small differences in replicability scores as these scores are likely to fluctuate. However, the strong correlation over time suggests that there are meaningful differences in the replicability and credibility of published results across journals.
CONCLUSION
This article provides objective information about the replicability of published findings in psychology journals. None of the journals reaches Cohen’s recommended level of 80% replicability. Average replicability is just about 50%. This finding is largely consistent with Cohen’s analysis of power over 50 years ago. The publication of the first replicability analysis by journal should provide an incentive to editors to increase the reputation of their journal by paying more attention to the quality of the published data. In this regard, it is noteworthy that replicability scores diverge from traditional indicators of journal prestige such as impact factors. Ideally, the impact of an empirical article should be aligned with the replicability of the empirical results. Thus, the replicability index may also help researchers to base their own research on credible results that are published in journals with a high replicability score and to avoid incredible results that are published in journals with a low replicability score. Ultimately, I can only hope that journals will start competing with each other for a top spot in the replicability rankings and as a by-product increase the replicability of published findings and the credibility of psychological science.
Cookie Consent
We use cookies to improve your experience on our site. By using our site, you consent to cookies.