Tag Archives: Post-Hoc-Power

Open Discussion Forum: [67] P-curve Handles Heterogeneity Just Fine

[67] P-curve Handles Heterogeneity Just Fine

UPDATE 3/27/2018:  Here is R-code to see how z-curve and p-curve work and to run the simulations used by Datacolada and to try other ones.  (R-Code download)

Introduction

The blog Datacolada is a joint blog by Uri Simonsohn, Leif Nelson, and Joe Simmons.  Like this blog, Datacolada blogs about statistics and research methods in the social sciences with a focus on controversial issues in psychology.  Unlike this blog, Datacolada does not have a comments section.  However, this shouldn’t stop researchers to critically examine the content of Datacolada.  As I have a comments section, I will first voice my concerns about blog post [67] and then open the discussion to anybody who cares about estimating the average power of studies that reported a “discovery” in a psychology journal.

Background: 

Estimating power is easy when all studies are honestly reported.  In this ideal world, average power can be estimated by the percentage of significant results  and with the median observed power (Schimmack, 2015).  However, in reality not all studies are published and researchers use questionable research practices that inflate success rates and observed power.  Currently two methods promise to correct for these problems and to provide estimates of the average power of studies that yielded a significant result.

Uri Simonsohn’s P-Curve has been in the public domain in the form of an app since January 2015.  Z-Curve has been used to critique published studies and individual authors for low power in their published studies on blog posts since June 2015. Neither method has the stamp of approval of peer-review.  P-Curve has been developed from Version 3.0 to Version 4.6 without presenting any simulations that the method works. It is simply assumed that the method works because it is built on a peer-reviewed method for the estimation of effect sizes.  Jerry Brunner and I have developed four methods for the estimation of average power in a set of studies selected for significance,  including z-curve and our own version of p-curve that estimates power and not effect sizes .

We have carried out extensive simulation studies and asked numerous journals to examine the validity of our simulation results.  We also posted our results in a blog post and asked for comments.  The fact that our work is still not published in 2018 does not reflect problems with out results. The reasons for rejection were mostly that it is not relevant to estimate average power of studies that have been published.

Respondents to an informal poll in the Psychological Methods Discussion Group mostly disagree and so do we.

Power.Estimation.Poll.png

There are numerous examples on this blog that show how this method can be used to predict that major replication efforts will fail (ego-depletion replicability report) or that claims about the way people (that is you and I) think in a popular book (Thinking: Fast and Slow) for a general audience (again that is you and me) by a Nobel Laureate are based on studies that were obtained with deceptive research practices.

The author, Daniel Kahneman, was as dismayed as I am by the realization that many published findings that are supposed to enlighten us have provided false facts and he graciously acknowledged this.

“I accept the basic conclusions of this blog. To be clear, I do so (1) without expressing an opinion about the statistical techniques it employed and (2) without stating an opinion about the validity and replicability of the individual studies I cited. What the blog gets absolutely right is that I placed too much faith in underpowered studies.” (Daniel Kahneman).

It is time to ensure that methods like p-curve and z-curve are vetted by independent statistical experts.  The traditional way of closed peer review in journals that need to reject good work because for-profit publishers and organizations like APS need to earn money from selling print-copies of their journals has failed.

Therefore we ask statisticians and methodologists from any discipline that uses significance testing to draw inferences from empirical studies to examine the claims in our manuscript and to help us to correct any errors.  If p-curve is the better tool for the job, so be it.

It is unfortunate that the comparison of p-curve and z-curve has become a public battle. In an idealistic world, scientists would not be attached to their ideas and would resolve conflicts in a calm exchange of arguments.  What better field to reach consensus than math or statistics where a true answer exists and can be revealed by means of mathematical proof or simulation studies.

However, the real world does not match the ideal world of science.  Just like Uri-Simonsohn is proud of p-curve, I am proud of z-curve and I want z-curve to do better.  This explains why my attempt to resolve this conflict in private failed (see email exchange).

The main outcome of the failed attempt to find agreement in private was that Uri Simonsohn posted a blog on Datacolada with the bold claim “P-Curve Handles Heterogeneity Just Fine,” which contradicts the claims that Jerry and I made in the manuscript that I sent him before we submitted it for publication. So, not only did the private communication fail.  Our attempt to resolve disagreement resulted in an open blog post that contradicted our claims.  A few months later, this blog post was cited by the editor of our manuscript as a minor reason for rejecting our comparison of p-curve and z-curve.

Just to be clear, I know that the datacolada post that Nelson cites was posted after your paper was submitted and I’m not factoring your paper’s failure to anticipate it into my decision (after all, Bem was wrong (Dan Simons, Editor of AMMPS)

Please remember,  I shared a document and R-Code with simulations that document the behavior of p-curve.  I had a very long email exchange with Uri Simonsohn in which I asked him to comment on our simulation results, which he never did.   Instead, he wrote his own simulations to convince himself that p-curve works.

The tweet below shows that Uri is aware of the problem that statisticians can use statistical tricks, p-hacking, to make their method look better than they are.

Uri.Tweet.Phacking

I will now demonstrate that Uri p-hacked his simulations to make p-curve look better than it is and to hide the fact that z-curve is the better tool for the job.

Critical Examination of Uri Simonsohn’s Simulation Studies

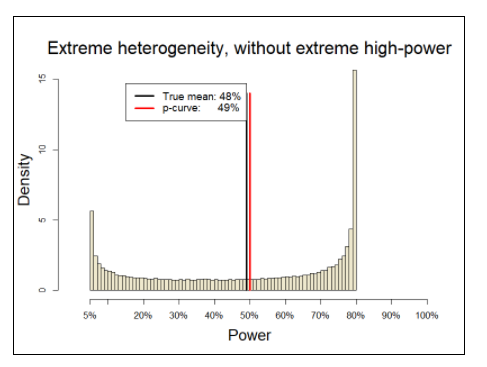
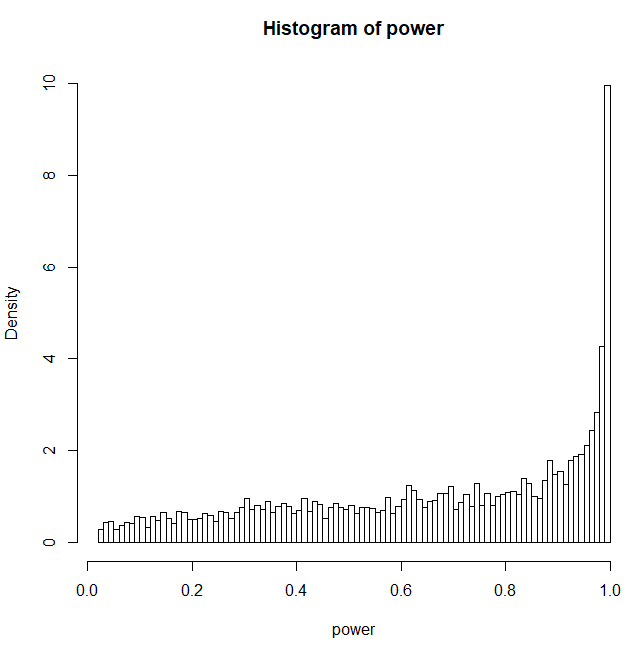
On the blog, Uri Simonsohn shows the Figure below which was based on an example that I provided during our email exchange.   The Figure shows the simulated distribution of true power.  It also shows the the mean true power is 61%, whereas the p-curve estimate is 79%.  Uri Simonssohn does not show the z-curve estimate.  He also does not show what the distribution of observed t-values looks like. This is important because few readers are familiar with histograms of power and the fact that it is normal for power to pile up at 1 because 1 is the upper limit for power.


datacolada67.png

I used the R-Code posted on the Datacolada website to provide additional information about this example. Before I show the results it is important to point out that Uri Simonshon works with a different selection model than Jerry and I.   We verified that this has no implications for the performance of p-curve or z-curve, but it does have implications for the distribution of true power that we would expect in real data.

Selection for Significance 1:   Jerry and I work with a simple model where researchers conduct studies, test for significance, and then publish the significant results.  They may also publish the non-significant results, but they cannot be used to claim a discovery (of course, we can debate whether a significant result implies a discovery, but that is irrelevant here).   We use z-curve to estimate the average power of those studies that produced a significant result.  As power is the probabilty of obtaining a significant result, the average true power of significant results predicts the success rate in a set of exact replication studies. Therefore, we call this estimate an estimate of replicability.

Selection for Significance 2:   The Datacolada team famously coined the term p-hacking.  p-hacking refers to massive use of questionable research practices in order to produce statistically significant results.   In an influential article, they created the impression that p-hacking allows researchers to get statistical significance in pretty much every study without a real effect (i.e., a false positive).  If this were the case, researchers would not have failed studies hidden away like our selection model implies.

No File Drawers: Another Unsupported Claim by Datacolada

In the 2018 volume of Annual Review of Psychology (edited by Susan Fiske), the Datacolada team explicitly claims that psychology researchers do not have file drawers of failed studies.

There is an old, popular, and simple explanation for this paradox. Experiments that work are sent to a journal, whereas experiments that fail are sent to the file drawer (Rosenthal 1979). We believe that this “file-drawer explanation” is incorrect. Most failed studies are not missing. They are published in our journals, masquerading as successes. 

They provide no evidence for this claim and ignore evidence to the contrary.  For example,  Bem (2011) pointed out that it is a common practice in experimental social psychology to conduct small studies so that failed studies can be dismissed as “pilot studies.”    In addition, some famous social psychologists have stated explicitly that they have a file drawer of studies that did not work.

“We did run multiple studies, some of which did not work, and some of which worked better than others. You may think that not reporting the less successful studies is wrong, but that is how the field works.” (Roy Baumeister, personal email communication)

In response to replication failures,  Kathleen Vohs acknowledged that a couple of studies with non-significant results were excluded from the manuscript submitted for publication that was published with only significant results.

(2) With regard to unreported studies, the authors conducted two additional money priming studies that showed no effects, the details of which were shared with us.
(quote from Rohrer et al., 2015, who failed to replicate Vohs’s findings; see also Vadillo et al., 2016.)

Dan Gilbert and Timothy Wilson acknowledged that they did not publish non-significant results that they considered to be uninformative.

“First, it’s important to be clear about what “publication bias” means. It doesn’t mean that anyone did anything wrong, improper, misleading, unethical, inappropriate, or illegal. Rather it refers to the wellknown fact that scientists in every field publish studies whose results tell them something interesting about the world, and don’t publish studies whose results tell them nothing.  Let us be clear: We did not run the same study over and over again until it yielded significant results and then report only the study that “worked.” Doing so would be clearly unethical. Instead, like most researchers who are developing new methods, we did some preliminary studies that used different stimuli and different procedures and that showed no interesting effects. Why didn’t these studies show interesting effects? We’ll never know. Failed studies are often (though not always) inconclusive, which is why they are often (but not always) unpublishable. So yes, we had to mess around for a while to establish a paradigm that was sensitive and powerful enough to observe the effects that we had hypothesized.”  (Gilbert and Wilson).

Bias analyses show some problems with the evidence for stereotype threat effects.  In a radio interview, Michael Inzlicht reported that he had several failed studies that were not submitted for publication and he is now skeptical about the entirely stereotype threat literature (conflict of interest: Mickey Inzlicht is a friend and colleague of mine who remains the only social psychologists who has published a critical self-analysis of his work before 2011 and is actively involved in reforming research practices in social psychology). 

Steve Spencer also acknowledged that he has a file drawer with unsuccessful studies.  In 2016, he promised to open his file-drawer and  make the results available. 

By the end of the year, I will certainly make my whole file drawer available for any one who wants to see it. Despite disagreeing with some of the specifics of what Uli says and certainly with his tone I would welcome everyone else who studies stereotype threat to make their whole file drawer available as well.

Nearly two years later, he hasn’t followed through on this promise (how big can it be? LOL). 

Although this anecdotal evidence makes it clear that researchers have file drawers with non-significant results,  it remains unclear how large file-drawers are and how often researchers p-hacked null-effects to significance (creating false positive results).

The Influence of Z-Curve on the Distribution of True Power and Observed Test-Statistics

Z-Curve, but not p-curve, can address this question to some extent because p-hacking influences the probability that a low-powered study will be published.  A simple selection model with alpha = .05 implies that only 1 out of 20 false positive results produces a significant result and will be included in the set of studies with significant results.  In contrast, extreme p-hacking implies that every false positive result (20 out of 20) will be included in the set of studies with significant results.

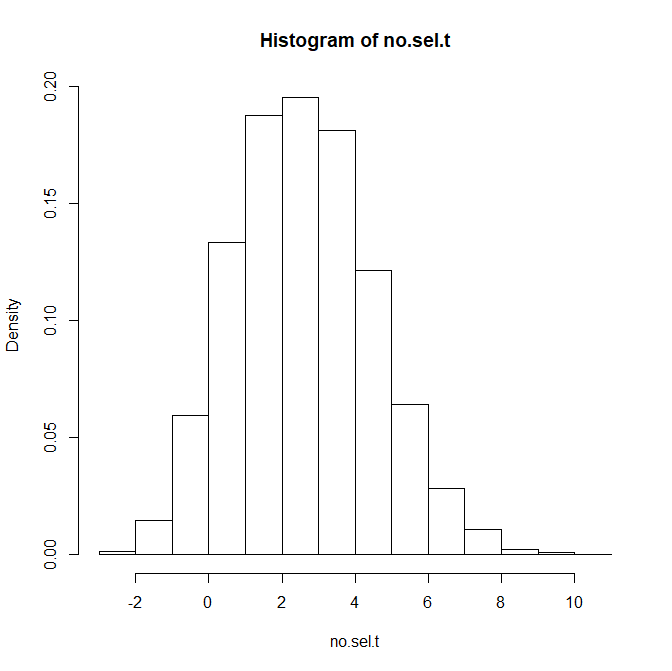
To illustrate the implications of selection for significance versus p-hacking, it is instructive to examine the distribution of observed significant results based on the simulated distribution of true power in Figure 1.

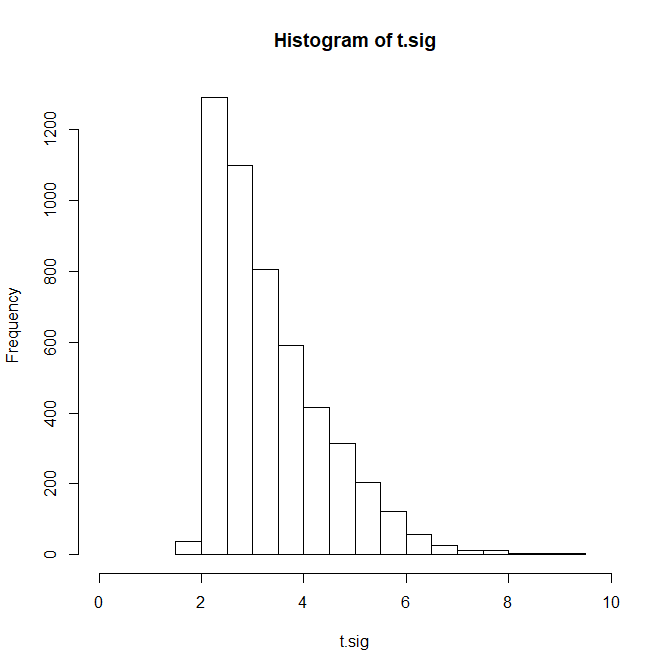
Figure 2 shows the distribution assuming that all studies will be p-hacked to significance. P-hacking can influence the observed distribution, but I am assuming a simple p-hacking model that is statistically equivalent to optional stopping with small samples. Just keep repeating the experiment (with minor variations that do not influence power  to deceive yourself that you are not p-hacking) and stop when you have a significant result.

t.sig


The histogram of t-values looks very similar to a z-score because t-values with df = 98 are approximately normally distributed.  As all studies were p-hacked, all studies are significant with qt(.975,98) = 1.98 as criterion value.  However, some studies have strong evidence against the null-hypothesis with t-values greater than 6.  The huge pile of t-values just above the criterion value of 1.98 occurs because all low powered studies became significant.

The distribution in Figure 3 looks different than the distribution in Figure 2.

no.sel.t.png

Now there are numerous non-significant results and even a few significant results with the opposite sign of the true effect (t < -1.98).   For the estimation of replicability only the results that reached significance are relevant, if only for the reason that they are the only results that are published (success rates in psychology are above 90%; Sterling, 1959, see also real data later on).   To compare the distributions it is more instructive to select only the significant results in Figure 3 and to compare the densities in Figures 2 and 3.

phack.vs.pubBias

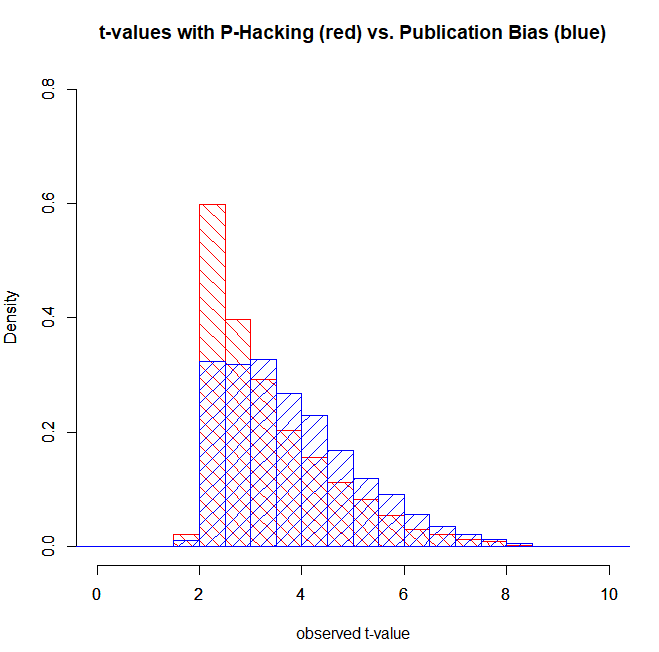
The graph in Figure 4 shows that p-hacking results in more just significant results with t-values between 2 and 2.5 than mere publication bias does. The reason is that the significance filter of alpha = .05 eliminates false positives and low powered true effects. As a result the true power of studies that produced significant results is higher in the set of studies that were selected for significance.  The average true power of the honest significant results without p-hacking is 80% (as seen in Figure 1, the average power for the p-hacked studies in red is 61%).

With real data, the distribution of true power is unknown. Thus, it is unknown how much p-hacking occurred.  For the reader of a journal that reports only significant it is also irrelevant whether p-hacking occurred.  A result may be reported because 10 similar studies tested a single hypothesis or 10 conceptual replication studies produced 1 significant result.  In either scenario, the reported significant result provides weak evidence for an effect if the significant result occurred with low power.

It is also important to realize (and it took Jerry and I some time to convince ourselves with simulations that this is actually true) that p-curve and z-curve estimates do not depend on the selection mechanism. The only information that matters is the true power of studies and not how studies were selected.  To illustrate this fact, I also used p-curve and z-curve to estimate the average power of the t-values without p-hacking (blue distribution in Figure 4).   P-Curve again overestimates true power.  While average true power is 80%,  the p-curve estimate is 94%.

In conclusion,  the datacolada blog post did present one out of several examples that I provided and that were included in the manuscript that I shared with Uri.  The Datacolada post correctly showed that z-curve provides good estimates of the average true power and that p-curve produces inflated estimates.

I elaborated on this example by pointing out the distinction between p-hacking (all studies are significant) and selection for significance (e.g., due to publication bias or in assessing replicability of published results).  I showed that z-curve produces the correct estimates with and without p-hacking because the selection process does not matter.  The only consequence of p-hacking is that more low-powered studies become significant because it undermines the function of the significance filter to prevent studies with weak evidence from entering the literature.

In conclusion, the actual blog post shows that p-curve can be severely biased when data are heterogeneous, which contradicts the title that P-Curve handles heterogeneity just fine.

When The Shoe Doesn’t Fit, Cut of Your Toes

To rescue p-curve and to justify the title, Uri Simonsohn suggests that the example that I provided is unrealistic and that p-curve performs as well or better in simulations that are more realistic.  He does not mention that I also provided real world examples in my article that showed better performance of z-curve with real data.

So, the real issue is not whether p-curve handles heterogeneity well (it does not). The real issue is now how much heterogeneity we should expect.

Figure 5 shows that Uri Simonsohn considers to be realistic data. The distribution of true power uses the same beta distribution as the distribution in Figure 1, but instead of scaling it from the lowest possible value (alpha = 5%) to the highest possible value 1-1/infinity), it scales power from alpha to a maximum of 80%.  For readers less familiar with power, a value of 80% implies that researches plan studies deliberately with the risk of a 20% probability to end up with a false negative result (i.e., the effect exists, but the evidence is not strong enough, p > .05).

datacolada67.fig2.png

The labeling in the graph implies that studies with more than recommended 80% power, including 81% power are considered to have extremely high power (again, with a 20% risk of a false positive result).   The graph also shows that p-curve provided an unbiased estimate of true average power despite (extreme) heterogeneity in true power between 5% and 80%.

t.sig.2

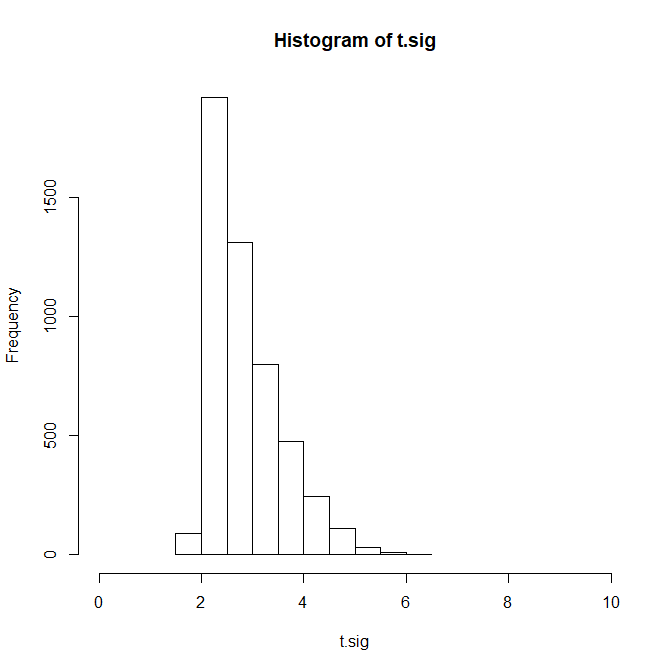
Figure 6 shows the histogram of observed t-values based on a simulation in which all studies in Figure 5 are p-hacked to get significance.  As p-hacking inflates all t-values to meet the minimum value of 1.98, and truncation of power to values below 80% removes high t-values, 92% of t-values are within the limited range from 1.98 to 4.  A crud measure of heterogeneity is the variance of t-values, which is 0.51.  With N = 100, a t-distribution is just a little bit wider than the standard normal distribution, which has a standard deviation of 1. Thus, the small variance of 0.51 indicates that these data have low variability.

The histogram of observed t-values and the variance in these observed t-values makes it possible to quantify heterogeneity in true power.  In Figure 2, heterogeneity was high (Var(t) = 1.56) and p-curve overestimated average true power.  In Figure 6, heterogeneity is low (Var(t) = 0.51) and p-curve provided accurate estimates.  This finding suggests that estimation bias in p-curve is linked to the distribution and variance in observed t-values, which reflects the distribution and variance in true power.

When the data are not simulated, test statistics can come from different tests with different degrees of freedom.  In this case, it is necessary to convert all test statistics into z-scores so that strength of evidence is measured in a common metric.  In our manuscript, we used the variance of z-scores to quantify heterogeneity and showed that p-curve overestimates when heterogeneity is high.

In conclusion, Uri Simonsohn demonstrated that p-curve can produce accurate estimates when the range of true power is arbitrarily limited to values below 80% power.  He suggests that this is reasonable because having more than 80% power is extremely high power and rare.

Thus, there is no disagreement between Uri Simonsohn and us when it comes to the statistical performance of p-curve and z-curve.  P-curve overestimates when power is not truncated at 80%.  The only disagreement concerns the amount of actual variability in real data.

What is realistic?

Jerry and I are both big fans of Jacob Cohen who has made invaluable contributions to psychology as a science, including his attempt to introduce psychologists to Neyman-Pearson’s approach to statistical inferences that avoids many of the problems of Fishers’ approach that dominates statistics training in psychology to this day.

The concept of statistical power requires that researchers formulate an alternative hypothesis, which requires specifying an expected effect size.  To facilitate this task, Cohen developed standardized effect sizes. For example, Cohen’s standardizes a mean difference (e.g., height difference between men and women in centimeters) by the standard deviation.  As a result, the effect size is independent of the unit of measurement and is expressed in terms of percentages of a standard deviation.  Cohen provided rough guidelines about the size of effect sizes that one could expect in psychology.

It is now widely accepted that most effect sizes are in the range between 0 and 1 standard deviation.  It is common to refer to effect sizes of d = .2 (20% of a standard deviation) as small, d = .5 as medium, and d = .8 as large.

True power is a function of effect size and sampling error.  In a between subject study sampling error is a function of sample size and most sample sizes in between-subject designs fall into a range from 40 to 200 participants, although sample sizes have been increasing somewhat in response to the replication crisis.  With N = 40 to 200, sampling error ranges from 0.14 (2/sqrt(200) to .32 (2/sqrt(40).

The non-central t-values are simply the ratio of standardized effect sizes and sampling error of standardized measures.  At the lowest end, effect sizes of 0 have a non-central t-value of 0 (0/.14 = 0; 0/.32 = 0).  At the upper end, a large effect size of .8 obtained in the largest sample (N = 200) yields a t-value of .8/.14 = 5.71.   While smaller non-central t-values than 0 are not possible, larger non-central t-values can occur in some studies. Either the effect size is very large or sampling error is smaller.  Smaller sampling errors are especially likely when studies use covariates, within-subject designs or one-sample t-tests.  For example, a moderate effect size (d = .5) in a within-subject design with 90% fixed error variance (r = .9), yields a non-central t-value of 11.

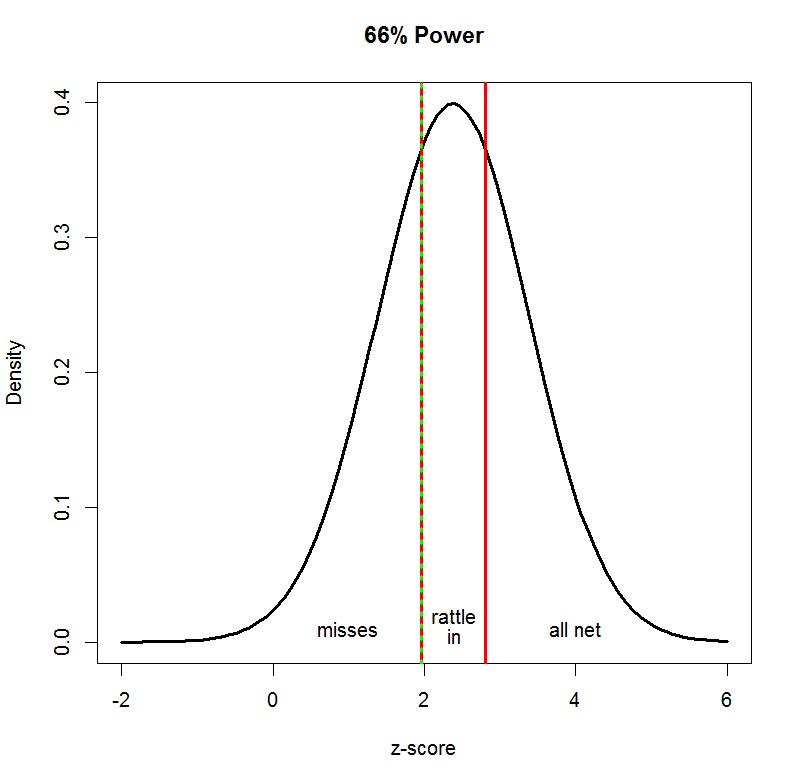
A simple way to simulate data that are consistent with these well-known properties of results in psychology is to assume that the average effect size is half a standard deviation (d = .5) and to model variability in true effect sizes with a normal distribution with a standard deviation of SD = .2.  Accordingly, 95% of effect sizes would fall into the range from d = .1 to d = .9.  Sample sizes can be modeled with a simple uniform distribution (equal probability) from N = 40 to 200.

ncp.png

Converting the non-centrality parameters to power with p < .05 shows that many values fall into the region from .80 to 1 that Uri Simonsohn called extremely high power.  The graph shows that it does not require extremely large effect sizes (d > 1) or large samples (N > 200) to conduct studies with 80% power or more.   Of course, the percentage of studies with 80% power or more depends on the distribution of effect sizes, but it seems questionable to assume that studies rarely have 80% power.

power.d.png

The mean true power is 66% (I guess you see where this is going).


t.sig.d.png

This is the distribution of the observed t-values.  The variance is 1.21 and 23% of the t-values are greater than 4.   The z-curve estimate is 66% and the p-curve estimate is 83%.

In conclusion, a simulation that starts with knowledge about effect sizes and sample sizes in psychological research shows that it is misleading to call 80% power or more extremely high power that is rarely achieved in actual studies.  It is likely that real datasets will include studies with more than 80% power and that this will lead p-curve to overestimate average power.

A comparison of P-Curve and Z-Curve with Real Data

The point of fitting p-curve and z-curve to real data is not to validate the methods.  The methods have been validated in simulation studies that show good performance of z-curve and poor performance of p-curve when hterogeneity is high.

The only question remains how biased p-curve is with real data.  Of course, this depends on the nature of the data.  It is therefore important to remember that the Datacolada team proposed p-curve as an alternative to Cohen’s (1962) seminal study of power in the 1960 issue of the Journal of Abnormal and Social Psychology.

“Estimating the publication-bias corrected estimate of the average power of a set of studies can be useful for at least two purposes. First, many scientists are intrinsically
interested in assessing the statistical power of published research (see e.g., Button et al., 2013; Cohen, 1962; Rossi, 1990; Sedlmeier & Gigerenzer, 1989). 

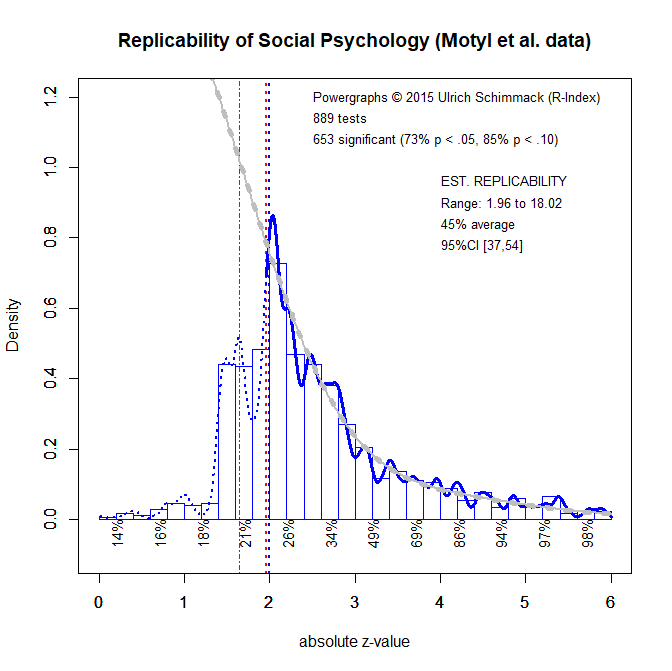
There have been two recent attempts at estimating the replicability of results in psychology.   One project conducted 100 actual replication studies (Open Science Collaboration, 2015).  A more recent project examined the replicability of social psychology using a larger set of studies and statistical methods to assess replicability (Motyl et al., 2017).

The authors sampled articles from four journals, the Journal of Personality and Social Psychology, Personality and Social Psychology Bulletin, Journal of Experimental Psychology, and Psychological Science and four years, 2003, 2004, 2013, and 2014.  They randomly sampled 543 articles that contained 1,505 studies. For each study, a coding team picked one statistical test that tested the main hypothesis.  The authors converted test-statistics into z-scores and showed histograms for the years 2003-2004 and 2013-2014 to examine changes over time.  The results were similar.

Motyl.zcurve

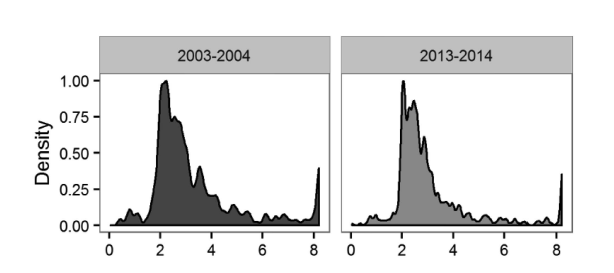
The histograms show clear evidence that non-significant results are missing either due to p-hacking or publication bias.  The authors did not use p-curve or z-curve to estimate the average true power.  I used these data to examine the performance of z-curve and p-curve.  I selected only tests that were coded as ANOVAs (k = 751) or t-tests (k = 232).  Furthermore, I excluded cases with very large test statistics (> 100) and experimenter degrees of freedom (10 or more). For participant degrees of freedom, I excluded values below 10 and above 1000.  This left 889 test statistics.  The test statistics were converted into z-scores.  The variance of the significant z-scores was 2.56.  However, this is due to a long tail of z-scores with a maximum value of 18.02.  The variance of z-scores between 1.96 and 6 was 0.83.

Motyl.zcurve.png

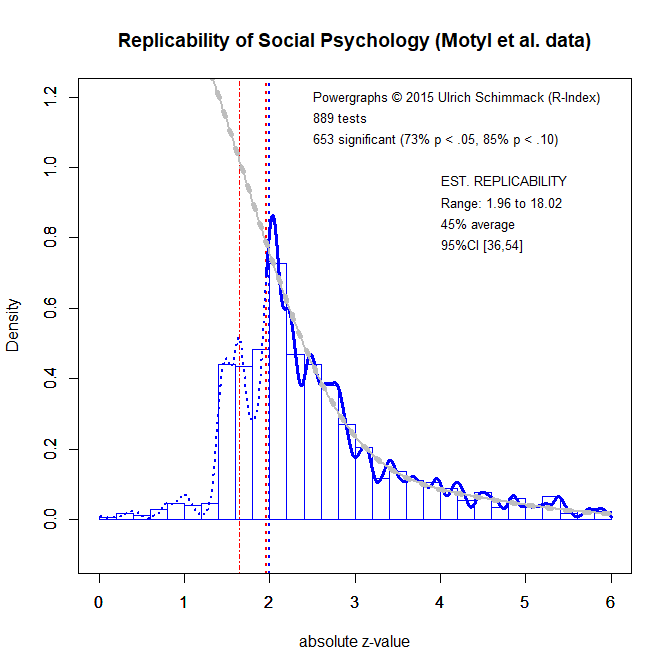
Fitting z-curve to all significant z-scores yielded an estimate of 45% average true power.  The p-curve estimate was 78% (90%CI = 75;81).  This finding is not surprising given the simulation results and the variance in the Motyl et al. data.

One possible solution to this problem could be to modify p-curve in the same way that z-curve only models z-scores between 1.96 and 6 and treats all z-scores of 6 as having power = 1.   The z-curve estimate is then adjusted by the proportion of extreme z-scores

average.true.power = z-curve.estimate * (1 – extreme) + extreme

Using the same approach with p-curve does help to reduce the bias in p-curve estimates, but p-curve still produces a much higher estimate than z-curve,  namely 63% (90%CI = .58;67.  This is still nearly 20% higher than the z-curve estimate.

In response to these results, Leif Nelson argued that the problem is not with p-curve, but with the Motyl et al. data.

They attempt to demonstrate the validity of the Z-curve with three sets of clearly invalid data.

One of these “clearly invalid” data are the data from Motyl et al.’s study.  Nelson claim is based on another datacolada blog post about the Motyl et al. study with the title

[60] Forthcoming in JPSP: A Non-Diagnostic Audit of Psychological Research

A detailed examination of datacolada 60 will be the subject of another open discussion about Datacolada.  Here it is sufficient to point that Nelson’s strong claim that Motyl et al.’s data are “clearly invalid” is not based on empirical evidence. It is based on disagreement about the coding of 10 out of over 1,500 tests (0.67%).  Moreover, it is wrong to label these disagreements mistakes because there is no right or wrong way to pick one test from a set of tests.

In conclusion, the Datacolada team has provided no evidence to support their claim that my simulations are unrealistic.  In contrast, I have demonstrated that their truncated simulation does not match reality.  Their only defense is now that I cheery-picked data that make z-curve look good.  However, a simulation with realistic assumptions about effect sizes and sample sizes also shows large heterogeneity and p-curve fails to provide reasonable estimates.

The fact that sometimes p-curve is not biased is not particularly important because z-curve provides practically useful estimates in these scenarios as well. So, the choice is between one method that gets it right sometimes and another method that gets it right all the time. Which method would you choose?

It is important to point out that z-curve shows some small systematic bias in some situations. The bias is typically about 2% points.  We developed a conservative 95%CI to address this problem and demonstrated that his 95% confidence interval has good coverage under these conditions and is conservative in situations when z-curve is unbiased.  The good performance of z-curve is the result of several years of development.  Not surprisingly, it works better than a method that has never been subjected to stress-tests by the developers.

Future Directions

Z-curve has many additional advantages over p-curve.  First, z-curve is a model for heterogeneous data.  As a result, it is possible to develop methods that can quantify the amount of variability in power while correcting for selection bias.  Second, heterogeneity implies that power varies across studies. As studies with higher power tend to produce larger z-scores, it is possible to provide corrected power estimates for sets of z-values. For example, the average power of just significant results (z < 2.5) could be very low.

Although these new features are still under development, first tests show promising results.  For example, the local power estimates for Motyl et al. suggest that test statistics with z-scores below 2.5 (p = .012) have only 26% power and even those between 2.5 and 3.0 (p = .0026) have only 34% power. Moreover, test statistics between 1.96 and 3 account for two-thirds of all test statistics. This suggests that many published results in social psychology will be difficult to replicate.

The problem with fixed-effect models like p-curve is that the average may be falsely generalized to individual studies. Accordingly, an average estimate of 45% might be misinterpreted as evidence that most findings are replicable and that replication studies with a little bit power would be able to replicate most findings. However, this is not the case (OSC, 2015).  In reality, there are many studies with low power that are difficult to replicate and relatively few studies with very high power that are easy to replicate.  Averaging across these studies gives the wrong impression that all studies have moderate power.  Thus, p-curve estimates may be misinterpreted easily because p-curve ignores heterogeneity in true power.

Motyl.zcurve.with.png

Final Conclusion

In the datacolada 67 blog post, the Datacolada team tried to defend p-curve against evidence that p-curve fails when data are heterogeneous.  It is understandable that authors are defensive about their methods.  In this comment on the blog post, I tried to reveal flaws in Uri’s arguments and to show that z-curve is indeed a better tool for the job.  However, I am just as motivated to promote z-curve as the Datacolada team is to promote p-curve.

To address this problem of conflict of interest and motivated reasoning, it is time for third parties to weigh in.  Neither method has been vetted by traditional peer-review because editors didn’t see any merit in p-curve or z-curve, but these methods are already being used to make claims about replicability.  It is time to make sure that they are used properly.  So, please contribute to the discussion about p-curve and z-curve in the comments section.  Even if you simply have a clarification question, please post it.

Dr. R’s comment on the Official Statement by the Board of the German Psychological Association (DGPs) about the Results of the OSF-Reproducibility Project published in Science.

Thanks to social media, geography is no longer a barrier for scientific discourse. However, language is still a barrier. Fortunately, I understand German and I can respond to the official statement of the board of the German Psychological Association (DGPs), which was posted on the DGPs website (in German).

BACKGROUND

On September 1, 2015, Prof. Dr. Andrea Abele-Brehm, Prof. Dr. Mario Gollwitzer, and Prof. Dr. Fritz Strack published an official response to the results of the OSF-Replication Project – Psychology (in German) that was distributed to public media in order to correct potentially negative impressions about psychology as a science.

Numerous members of DGPs felt that this official statement did not express their views and noticed that members were not consulted about the official response of their organization. In response to this criticism, DGfP opened a moderated discussion page, where members could post their personal views (mostly in German).

On October 6, 2015, the board closed the discussion page and posted some final words (Schlussbeitrag). In this blog, I provide a critical commentary on these final words.

BOARD’S RESPONSE TO COMMENTS

The board members provide a summary of the core insights and arguments of the discussion from their (personal/official) perspective.

„Wir möchten nun die aus unserer Sicht zentralen Erkenntnisse und Argumente der unterschiedlichen Forumsbeiträge im Folgenden zusammenfassen und deutlich machen, welche vorläufigen Erkenntnisse wir im Vorstand aus ihnen ziehen.“

1. 68% success rate?

The first official statement suggested that the replication project showed that 68% of studies. This number is based on significance in a meta-analysis of the original and replication study. Critics pointed out that this approach is problematic because the replication project showed clearly that the original effect sizes were inflated (on average by 100%). Thus, the meta-analysis is biased and the 68% number is inflated.

In response to this criticism, the DGPs board states that “68% is the maximum [größtmöglich] optimistic estimate.” I think the term “biased and statistically flawed estimate” is a more accurate description of this estimate.   It is common practice to consider fail-safe-N or to correct meta-analysis for publication bias. When there is clear evidence of bias, it is unscientific to report the biased estimate. This would be like saying that the maximum optimistic estimate of global warming is that global warming does not exist. This is probably a true statement about the most optimistic estimate, but not a scientific estimate of the actual global warming that has been taking place. There is no place for optimism in science. Optimism is a bias and the aim of science is to remove bias. If DGPs wants to represent scientific psychology, the board should post what they consider the most accurate estimate of replicability in the OSF-project.

2. The widely cited 36% estimate is negative.

The board members then justify the publication of the maximally optimistic estimate as a strategy to counteract negative perceptions of psychology as a science in response to the finding that only 36% of results were replicated. The board members felt that these negative responses misrepresent the OSF-project and psychology as a scientific discipline.

„Dies wird weder dem Projekt der Open Science Collaboration noch unserer Disziplin insgesamt gerecht. Wir sollten jedoch bei der konstruktiven Bewältigung der Krise Vorreiter innerhalb der betroffenen Wissenschaften sein.“

However, reporting the dismal 36% replication rate of the OSF-replication project is not a criticism of the OSF-project. Rather, it assumes that the OSF-replication project was a rigorous and successful attempt to provide an estimate of the typical replicability of results published in top psychology journals. The outcome could have been 70% or 35%. The quality of the project does not depend on the result. The result is also not a negatively biased perception of psychology as a science. It is an objective scientific estimate of the probability that a reported significant result in a journal would produce a significant result again in a replication study.   Whether 36% is acceptable or not can be debated, but it seems problematic to post a maximally optimistic estimate to counteract negative implications of an objective estimate.

3. Is 36% replicability good or bad?

Next, the board ponders the implications of the 36% success rate. “How should we evaluate this number?” The board members do not know.  According to their official conclusion, this question is complex as divergent contributions on the discussion page suggest.

„Im Science-Artikel wurde die relative Häufigkeit der in den Replikationsstudien statistisch bedeutsamen Effekte mit 36% angegeben. Wie ist diese Zahl zu bewerten? Wie komplex die Antwort auf diese Frage ist, machen die Forumsbeiträge von Roland Deutsch, Klaus Fiedler, Moritz Heene (s.a. Heene & Schimmack) und Frank Renkewitz deutlich.“

To help the board members to understand the number, I can give a brief explanation of replicability. Although there are several ways to define replicability, one plausible definition of replicability is to equate it with statistical power. Statistical power is the probability that a study will produce a significant result. A study with 80% power has an 80% probability to produce a significant result. For a set of 100 studies, one would expect roughly 80 significant results and 20 non-significant results. For 100 studies with 36% power, one would expect roughly 36 significant results and 64 non-significant results. If researchers would publish all studies, the percentage of published significant results would provide an unbiased estimate of the typical power of studies.   However, it is well known that significant results are more likely to be written up, submitted for publication, and accepted for publication. These reporting biases explain why psychology journals report over 90% significant results, although the actual power of studies is less than 90%.

In 1962, Jacob Cohen provided the first attempt to estimate replicability of psychological results. His analysis suggested that psychological studies have approximately 50% power. He suggested that psychologists should increase power to 80% to provide robust evidence for effects and to avoid wasting resources on studies that cannot detect small, but practically important effects. For the next 50 years, psychologists have ignored Cohen’s warning that most studies are underpowered, despite repeated reminders that there are no signs of improvement, including reminders by prominent German psychologists like Gerg Giegerenzer, director of a Max Planck Institute (Sedlmeier & Giegerenzer, 1989; Maxwell, 2004; Schimmack, 2012).

The 36% success rate for an unbiased set of 100 replication studies, suggest that the actual power of published studies in psychology journals is 36%.  The power of all studies conducted is even lower because the p < .05 selection criterion favors studies with higher power.  Does the board think 36% power is an acceptable amount of power?

4. Psychologists should improve replicability in the future

On a positive note, the board members suggest that, after careful deliberation, psychologists need to improve replicability so that it can be demonstrated in a few years that replicability has increased.

„Wir müssen nach sorgfältiger Diskussion unter unseren Mitgliedern Maßnahmen ergreifen (bei Zeitschriften, in den Instituten, bei Förderorganisationen, etc.), die die Replikationsquote im temporalen Vergleich erhöhen können.“

The board members do not mention a simple solution to the replicabilty problem that was advocated over 50 years ago by Jacob Cohen. To increase replicability, psychologists have to think about the strength of the effects that they are investigating and they have to conduct studies that have a realistic chance to distinguish these effects from variation due to random error.   This often means investing more resources (larger samples, repeated trials, etc.) in a single study.   Unfortunately, the leaders of German psychologists appear to be unaware of this important and simple solution to the replication crisis. They neither mention power as a cause of the problem, nor do they recommend increasing power to increase replicability in the future.

5. Do the Results Reveal Fraud?

The DGPs board members then discuss the possibility that the OSF-reproducibilty results reveal fraud, like the fraud committed by Stapel. The board points out that the OSF-results do not imply that psychologists commit fraud because failed replications can occur for various reasons.

„Viele Medien (und auch einige Kolleginnen und Kollegen aus unserem Fach) nennen die Befunde der Science-Studie im gleichen Atemzug mit den Betrugsskandalen, die unser Fach in den letzten Jahren erschüttert haben. Diese Assoziation ist unserer Meinung nach problematisch: sie suggeriert, die geringe Replikationsrate sei auf methodisch fragwürdiges Verhalten der Autor(inn)en der Originalstudien zurückzuführen.“

It is true that the OSF-results do not reveal fraud. However, the board members confuse fraud with questionable research practices. Fraud is defined as fabricating data that were never collected. Only one of the 100 studies in the OSF-replication project (by Jens Förster, a former student of Fritz Strack, one of the board members) is currently being investigated for fraud by the University of Amsterdam.  Despite very strong results in the original study, it failed to replicate.

The more relevant question is how much questionable research practices contributed to the results. Questionable research practices are practices where data are being collected, but statistical results are only being reported if they produce a significant result (studies, conditions, dependent variables, data points that do not produce significant results are excluded from the results that are being submitted for publication. It has been known for over 50 years that these practices produce a discrepancy between the actual power of studies and the rate of significant results that are published in psychology journals (Sterling, 1959).

Recent statistical developments have made it possible to estimate the true power of studies after correcting for publication bias.   Based on these calculations, the true power of the original studies in the OSF-project was only 50%.   Thus a large portion of the discrepancy between nearly 100% reported significant results and a replication success rate of 36% is explained by publication bias (see R-Index blogs for social psychology and cognitive psychology).

Other factors may contribute to the discrepancy between the statistical prediction that the replication success rate would be 50% and the actual success rate of 36%. Nevertheless, the lion share of the discrepancy can be explained by the questionable practice to report only evidence that supports a hypothesis that a researcher wants to support. This motivated bias undermines the very foundations of science. Unfortunately, the board ignores this implication of the OSF results.

6. What can we do?

The board members have no answer to this important question. In the past four years, numerous articles have been published that have made suggestions how psychology can improve its credibility as a science. Yet, the DPfP board seems to be unaware of these suggestions or unable to comment on these proposals.

„Damit wären wir bei der Frage, die uns als Fachgesellschaft am stärksten beschäftigt und weiter beschäftigen wird. Zum einen brauchen wir eine sorgfältige Selbstreflexion über die Bedeutung von Replikationen in unserem Fach, über die Bedeutung der neuesten Science-Studie sowie der weiteren, zurzeit noch im Druck oder in der Phase der Auswertung befindlichen Projekte des Center for Open Science (wie etwa die Many Labs-Studien) und über die Grenzen unserer Methoden und Paradigmen“

The time for more discussion has passed. After 50 years of ignoring Jacob Cohen’s recommendation to increase statistical power it is time for action. If psychologists are serious about replicability, they have to increase the power of their studies.

The board then discusses the possibility of measuring and publishing replication rates at the level of departments or individual scientists. They are not in favor of such initiatives, but they provide no argument for their position.

„Datenbanken über erfolgreiche und gescheiterte Replikationen lassen sich natürlich auch auf der Ebene von Instituten oder sogar Personen auswerten (wer hat die höchste Replikationsrate, wer die niedrigste?). Sinnvoller als solche Auswertungen sind Initiativen, wie sie zurzeit (unter anderem) an der LMU an der LMU München implementiert wurden (siehe den Beitrag von Schönbrodt und Kollegen).“

The question is why replicability should not be measured and used to evaluate researchers. If the board really valued replicability and wanted to increase replicability in a few years, wouldn’t it be helpful to have a measure of replicability and to reward departments or researchers who invest more resources in high powered studies that can produce significant results without the need to hide disconfirming evidence in file-drawers?   A measure of replicability is also needed because current quantitative measures of scientific success are one of the reasons for the replicability crisis. The most successful researchers are those who publish the most significant results, no matter how these results were obtained (with the exception of fraud). To change this unscientific practice of significance chasing, it is necessary to have an alternative indicator of scientific quality that reflects how significant results were obtained.

Conclusion

The board makes some vague concluding remarks that are not worthwhile repeating here. So let me conclude with my own remarks.

The response of the DGPs board is superficial and does not engage with the actual arguments that were exchanged on the discussion page. Moreover, it ignores some solid scientific insights into the causes of the replicability crisis and it makes no concrete suggestions how German psychologists should change their behaviors to improve the credibility of psychology as a science. Not once do they point out that the results of the OSF-project were predictable based on the well-known fact that psychological studies are underpowered and that failed studies are hidden in file-drawers.

I received my education in Germany all the way to the Ph.D at the Free University in Berlin. I had several important professors and mentors that educated me about philosophy of science and research methods (Rainer Reisenzein, Hubert Feger, Hans Westmeyer, Wolfgang Schönpflug). I was a member of DGPs for many years. I do not believe that the opinion of the board members represent a general consensus among German psychologists. I hope that many German psychologists recognize the importance of replicability and are motivated to make changes to the way psychologists conduct research.  As I am no longer a member of DGfP, I have no direct influence on it, but I hope that the next election will elect a candidate that will promote open science, transparency, and above all scientific integrity.

Replicability-Ranking of 100 Social Psychology Departments

Please see the new post on rankings of psychology departments that is based on all areas of psychology and covers the years from 2010 to 2015 with separate information for the years 2012-2015.

===========================================================================

Old post on rankings of social psychology research at 100 Psychology Departments

This post provides the first analysis of replicability for individual departments. The table focuses on social psychology and the results cannot be generalized to other research areas in the same department. An explanation of the rational and methodology of replicability rankings follows in the text below the table.

Department 2010-2014
Macquarie University 91
New Mexico State University 82
The Australian National University 81
University of Western Australia 74
Maastricht University 70
Erasmus University Rotterdam 70
Boston University 69
KU Leuven 67
Brown University 67
University of Western Ontario 67
Carnegie Mellon 67
Ghent University 66
University of Tokyo 64
University of Zurich 64
Purdue University 64
University College London 63
Peking University 63
Tilburg University 63
University of California, Irvine 63
University of Birmingham 62
University of Leeds 62
Victoria University of Wellington 62
University of Kent 62
Princeton 61
University of Queensland 61
Pennsylvania State University 61
Cornell University 59
University of California at Los Angeles 59
University of Pennsylvania 59
University of New South Wales (UNSW) 59
Ohio State University 58
National University of Singapore 58
Vanderbilt University 58
Humboldt Universit„ät Berlin 58
Radboud University 58
University of Oregon 58
Harvard University 56
University of California, San Diego 56
University of Washington 56
Stanford University 55
Dartmouth College 55
SUNY Albany 55
University of Amsterdam 54
University of Texas, Austin 54
University of Hong Kong 54
Chinese University of Hong Kong 54
Simone Fraser University 54
Ruprecht-Karls-Universitaet Heidelberg 53
University of Florida 53
Yale University 52
University of California, Berkeley 52
University of Wisconsin 52
University of Minnesota 52
Indiana University 52
University of Maryland 52
University of Toronto 51
Northwestern University 51
University of Illinois at Urbana-Champaign 51
Nanyang Technological University 51
University of Konstanz 51
Oxford University 50
York University 50
Freie Universit„ät Berlin 50
University of Virginia 50
University of Melbourne 49
Leiden University 49
University of Colorado, Boulder 49
Univeritä„t Würzburg 49
New York University 48
McGill University 48
University of Kansas 48
University of Exeter 47
Cardiff University 46
University of California, Davis 46
University of Groningen 46
University of Michigan 45
University of Kentucky 44
Columbia University 44
University of Chicago 44
Michigan State University 44
University of British Columbia 43
Arizona State University 43
University of Southern California 41
Utrecht University 41
University of Iowa 41
Northeastern University 41
University of Waterloo 40
University of Sydney 40
University of Bristol 40
University of North Carolina, Chapel Hill 40
University of California, Santa Barbara 40
University of Arizona 40
Cambridge University 38
SUNY Buffalo 38
Duke University 37
Florida State University 37
Washington University, St. Louis 37
Ludwig-Maximilians-Universit„ät München 36
University of Missouri 34
London School of Economics 33

Replicability scores of 50% and less are considered inadequate (grade F). The reason is that less than 50% of the published results are expected to produce a significant result in a replication study, and with less than 50% successful replications, the most rational approach is to treat all results as false because it is unclear which results would replicate and which results would not replicate.

RATIONALE AND METHODOLOGY

University rankings have become increasingly important in science. Top ranking universities use these rankings to advertise their status. The availability of a single number of quality and distinction creates pressures on scientists to meet criteria that are being used for these rankings. One key criterion is the number of scientific articles that are being published in top ranking scientific journals under the assumption that these impact factors of scientific journals track the quality of scientific research. However, top ranking journals place a heavy premium on novelty without ensuring that novel findings are actually true discoveries. Many of these high-profile discoveries fail to replicate in actual replication studies. The reason for the high rate of replication failures is that scientists are rewarded for successful studies, while there is no incentive to publish failures. The problem is that many of these successful studies are obtained with the help of luck or questionable research methods. For example, scientists do not report studies that fail to support their theories. The problem of bias in published results has been known for a long time (Sterling, 1959). However, few researchers were aware of the extent of the problem.   New evidence suggests that more than half of published results provide false or extremely biased evidence. When more than half of published results are not credible, a science loses its credibility because it is not clear which results can be trusted and which results provide false information.

The credibility and replicability of published findings varies across scientific disciplines (Fanelli, 2010). More credible sciences are more willing to conduct replication studies and to revise original evidence. Thus, it is inappropriate to make generalized claims about the credibility of science. Even within a scientific discipline credibility and replicability can vary across sub-disciplines. For example, results from cognitive psychology are more replicable than results from social psychology. The replicability of social psychological findings is extremely low. Despite an increase in sample size, which makes it easier to obtain a significant result in a replication study, only 5 out of 38 replication studies produced a significant result. If the replication studies had used the same sample sizes as the original studies, only 3 out of 38 results would have replicated, that is, produced a significant result in the replication study. Thus, most published results in social psychology are not trustworthy.

There have been mixed reactions by social psychologists to the replication crisis in social psychology. On the one hand, prominent leaders of the field have defended the status quo with the following arguments.

1 – The experiments who conducted the replication studies are incompetent (Bargh, Schnall, Gilbert).

2 – A mysterious force makes effects disappear over time (Schooler).

3 – A statistical artifact (regression to the mean) will always make it harder to find significant results in a replication study (Fiedler).

4 – It is impossible to repeat social psychological studies exactly and a replication study is likely to produce different results than an original study (the hidden moderator) (Schwarz, Strack).

These arguments can be easily dismissed because they do not explain why cognitive psychologists and other scientific disciplines have more successful replications and more failed results.   The real reason for the low replicability of social psychology is that social psychologists conduct many, relatively cheap studies that often fail to produce the expected results. They then conduct exploratory data analyses to find unexpected patterns in the data or they simply discard the study and publish only studies that support a theory that is consistent with the data (Bem). This hazardous approach to science can produce false positive results. For example, it allowed Bem (2011) to publish 9 significant results that seemed to show that humans can foresee unpredictable outcomes in the future. Some prominent social psychologists defend this approach to science.

“We did run multiple studies, some of which did not work, and some of which worked better than others. You may think that not reporting the less successful studies is wrong, but that is how the field works.” (Roy Baumeister,)

The lack of rigorous scientific standards also allowed Diederik Stapel, a prominent social psychologist to fabricate data, which led to over 50 retractions of scientific articles. The commission that investigated Stapel came to the conclusion that he was only able to publish so many fake articles because social psychology is a “sloppy science,” where cute findings and sexy stories count more than empirical facts.

Social psychology faces a crisis of confidence. While social psychology tried hard to convince the general public that it is a real science, it actually failed to follow standard norms of science to ensure that social psychological theories are based on objective replicable findings. Social psychology therefore needs to reform its practices if it wants to be taken serious as a scientific field that can provide valuable insights into important question about human nature and human behavior.

There are many social psychologists who want to improve scientific standards. For example, the head of the OSF-reproducibility project, Brian Nosek, is a trained social psychologist. Mickey Inzlicht published a courageous self-analysis that revealed problems in some of his most highly cited articles and changed the way his lab is conducting studies to improve social psychology. Incoming editors of social psychology journals are implementing policies to increase the credibility of results published in their journals (Simine Vazire; Roger Giner-Sorolla). One problem for social psychologists willing to improve their science is that the current incentive structure does not reward replicability. The reason is that it is possible to count number of articles and number of citations, but it seems difficult to quantify replicability and scientific integrity.

To address this problem, Jerry Brunner and I developed a quantitative measure of replicability. The replicability-score uses published statistical results (p-values) and transforms them into absolute z-scores. The distribution of z-scores provides information about the statistical power of a study given the sample size, design, and observed effect size. Most important, the method takes publication bias into account and can estimate the true typical power of published results. It also reveals the presence of a file-drawer of unpublished failed studies, if the published studies contain more significant results than the actual power of studies allows. The method is illustrated in the following figure that is based on t- and F-tests published in the most important journals that publish social psychology research.

PHP-Curve Social Journals

The green curve in the figure illustrates the distribution of z-scores that would be expected if a set of studies had 53% power. That is, random sampling error will sometimes inflate the observed effect size and sometimes deflate the observed effect size in a sample relative to the population effect size. With 54% power, there would be 46% (1 – .54 = .46) non-significant results because the study had insufficient power to demonstrate an effect that actually exists. The graph shows that the green curve fails to describe the distribution of observed z-scores. On the one hand, there are more extremely high z-scores. This reveals that the set of studies is heterogeneous. Some studies had more than 54% power and others had less than 54% power. On the other hand, there are fewer non-significant results than the green curve predicts. This discrepancy reveals that non-significant results are omitted from the published reports.

Given the heterogeneity of true power, the red curve is more appropriate. It provides the best fit to the observed z-scores that are significant (z-scores > 2). It does not model the z-scores below 2 because non-significant z-scores are not reported.   The red-curve gives a lower estimate of power and shows a much larger file-drawer.

I limit the power analysis to z-scores in the range from 2 to 4. The reason is that z-scores greater than 4 imply very high power (> 99%). In fact, many of these results tend to replicate well. However, many theoretically important findings are published with z-scores less than 4 as evidence. These z-scores do not replicate well. If social psychology wants to improve its replicability, social psychologists need to conduct fewer studies with more statistical power that yield stronger evidence and they need to publish all studies to reduce the file-drawer.

To provide an incentive to increase the scientific standards in social psychology, I computed the replicability-score (homogeneous model for z-scores between 2 and 4) for different journals. Journal editors can use the replicability rankings to demonstrate that their journal publishes replicable results. Here I report the first rankings of social psychology departments.   To rank departments, I searched the database of articles published in social psychology journals for the affiliation of articles’ authors. The rankings are based on the z-scores of these articles published in the years 2010 to 2014. I also conducted an analysis for the year 2015. However, the replicability scores were uncorrelated with those in 2010-2014 (r = .01). This means that the 2015 results are unreliable because the analysis is based on too few observations. As a result, the replicability rankings of social psychology departments cannot reveal recent changes in scientific practices. Nevertheless, they provide a first benchmark to track replicability of psychology departments. This benchmark can be used by departments to monitor improvements in scientific practices and can serve as an incentive for departments to create policies and reward structures that reward scientific integrity over quantitative indicators of publication output and popularity. Replicabilty is only one aspect of high-quality research, but it is a necessary one. Without sound empirical evidence that supports a theoretical claim, discoveries are not real discoveries.

Examining the Replicability of 66,212 Published Results in Social Psychology: A Post-Hoc-Power Analysis Informed by the Actual Success Rate in the OSF-Reproducibilty Project

The OSF-Reproducibility-Project examined the replicability of 99 statistical results published in three psychology journals. The journals covered mostly research in cognitive psychology and social psychology. An article in Science, reported that only 35% of the results were successfully replicated (i.e., produced a statistically significant result in the replication study).

I have conducted more detailed analyses of replication studies in social psychology and cognitive psychology. Cognitive psychology had a notably higher success rate (50%, 19 out of 38) than social psychology (8%, 3 out of 38). The main reason for this discrepancy is that social psychologists and cognitive psychologists use different designs. Whereas cognitive psychologists typically use within-subject designs with many repeated measurements of the same individual, social psychologists typically assign participants to different groups and compare behavior on a single measure. This so-called between-subject design makes it difficult to detect small experimental effects because it does not control the influence of other factors that influence participants’ behavior (e.g., personality dispositions, mood, etc.). To detect small effects in these noisy data, between-subject designs require large sample sizes.

It has been known for a long time that sample sizes in between-subject designs in psychology are too small to have a reasonable chance to detect an effect (less than 50% chance to find an effect that is actually there) (Cohen, 1962; Schimmack, 2012; Sedlmeier & Giegerenzer, 1989). As a result, many studies fail to find statistically significant results, but these studies are not submitted for publication. Thus, only studies that achieved statistical significance with the help of chance (the difference between two groups is inflated by uncontrolled factors such as personality) are reported in journals. The selective reporting of lucky results creates a bias in the published literature that gives a false impression of the replicability of published results. The OSF-results for social psychology make it possible to estimate the consequences of publication bias on the replicability of results published in social psychology journals.

A naïve estimate of the replicability of studies would rely on the actual success rate in journals. If journals would publish significant and non-significant results, this would be a reasonable approach. However, journals tend to publish exclusively significant results. As a result, the success rate in journals (over 90% significant results; Sterling, 1959; Sterling et al., 1995) gives a drastically inflated estimate of replicability.

A somewhat better estimate of replicability can be obtained by computing post-hoc power based on the observed effect sizes and sample sizes of published studies. Statistical power is the long-run probability that a series of exact replication studies with the same sample size would produce significant results. Cohen (1962) estimated that the typical power of psychological studies is about 60%. Thus, even for 100 studies that all reported significant results, only 60 are expected to produce a significant result again in the replication attempt.

The problem with Cohen’s (1962) estimate of replicability is that post-hoc-power analysis uses the reported effect sizes as an estimate of the effect size in the population. However, due to the selection bias in journals, the reported effect sizes and power estimates are inflated. In collaboration with Jerry Brunner, I have developed an improved method to estimate typical power of reported results that corrects for the inflation in reported effect sizes. I applied this method to results from 38 social psychology articles included in the OSF-reproducibility project and obtained a replicability estimate of 35%.

The OSF-reproducbility project provides another opportunity to estimate the replicability of results in social psychology. The OSF-project selected a representative set of studies from two journals and tried to reproduce the same experimental conditions as closely as possible. This should produce unbiased results and the success rate provides an estimate of replicability. The advantage of this method is that it does not rely on statistical assumptions. The disadvantage is that the success rate depends on the ability to exactly recreate the conditions of the original studies. Any differences between studies (e.g., recruiting participants from different populations) can change the success rate. The OSF replication studies also often changed the sample size of the replication study, which will also change the success rate. If sample sizes in a replication study are larger, power increases and the success rate no longer can be used as an estimate of the typical replicability of social psychology. To address this problem, it is possible to apply a statistical adjustment and use the success rate that would have occurred with the original sample sizes. I found that 5 out of 38 (13%) produced significant results and after correcting for the increase in sample size, replicability was only 8% (3 out of 38).

One important question is how how representative the 38 results from the OSF-project are for social psychology in general. Unfortunately, it is practically impossible and too expensive to conduct a large number of exact replication studies. In comparison, it is relatively easy to apply post-hoc power analysis to a large number of statistical results reported in social psychology. Thus, I examined the representativeness of the OSF-reproducibility results by comparing the results of my post-hoc power analysis based on the 38 results in the OSF to a post-hoc-power analysis of a much larger number of results reported in major social psychology journals .

I downloaded articles from 12 social psychology journals, which are the primary outlets for publishing experimental social psychology research: Basic and Applied Social Psychology, British Journal of Social Psychology, European Journal of Social Psychology, Journal of Experimental Social Psychology, Journal of Personality and Social Psychology: Attitudes and Social Cognition, Journal of Personality and Social Psychology: Interpersonal Relationships and Group Processes, Journal of Social and Personal Relationships, Personal Relationships, Personality and Social Psychology Bulletin, Social Cognition, Social Psychology and Personality Science, Social Psychology.

I converted pdf files into text files and searched for all reports of t-tests or F-tests and converted the reported test-statistic into exact two-tailed p-values. The two-tailed p-values were then converted into z-scores by finding the z-score corresponding to the probability of 1-p/2, with p equal the two-tailed p-value. The total number of z-scores included in the analysis is 134,929.

I limited my estimate of power to z-scores in the range between 2 and 4. Z-scores below 2 are not statistically significant (z = 1.96, p = .05). Sometimes these results are reported as marginal evidence for an effect, sometimes they are reported as evidence that an effect is not present, and sometimes they are reported without an inference about the population effect. It is more important to determine the replicability of results that are reported as statistically significant support for a prediction. Z-scores greater than 4 were excluded because z-scores greater than 4 imply that this test had high statistical power (> 99%). Many of these results replicated successfully in the OSF-project. Thus, a simple rule is to assign a success rate of 100% to these findings. The Figure below shows the distribution of z-scores in the range form z = 0 to6, but the power estimate is applied to z-scores in the range between 2 and 4 (n = 66,212).

PHP-Curve Social Journals

The power estimate based on the post-hoc-power curve for z-scores between 2 and 4 is 46%. It is important to realize that this estimate is based on 70% of all significant results that were reported. As z-scores greater than 4 essentially have a power of 100%, the overall power estimate for all statistical tests that were reported is .46*.70 + .30 = .62. It is also important to keep in mind that this analysis uses all statistical tests that were reported including manipulation checks (e.g., pleasant picture were rated as more pleasant than unpleasant pictures). For this reason, the range of z-scores is limited to values between 2 and 4, which is much more likely to reflect a test of a focal hypothesis.

46% power for z-scores between 2 and 4 of is a higher estimate than the estimate for the 38 studies in the OSF-reproducibility project (35%). This suggests that the estimated replicability based on the OSF-results is an underestimation of the true replicability. The discrepancy between predicted and observed replicability in social psychology (8 vs. 38) and cognitive psychology (50 vs. 75), suggests that the rate of actual successful replications is about 20 to 30% lower than the success rate based on statistical prediction. Thus, the present analysis suggests that actual replication attempts of results in social psychology would produce significant results in about a quarter of all attempts (46% – 20% = 26%).

The large sample of test results makes it possible to make more detailed predictions for results with different strength of evidence. To provide estimates of replicability for different levels of evidence, I conducted post-hoc power analysis for intervals of half a standard deviation (z = .5). The power estimates are:

Strength of Evidence      Power    

2.0 to 2.5                            33%

2.5 to 3.0                            46%

3.0 to 3.5                            58%

3.5 to 4.0                            72%

IMPLICATIONS FOR PLANNING OF REPLICATION STUDIES

These estimates are important for researchers who are aiming to replicate a published study in social psychology. The reported effect sizes are inflated and a replication study with the same sample size has a low chance to produce a significant result even if a smaller effect exists.   To conducted a properly powered replication study, researchers would have to increase sample sizes. To illustrate, imagine that a study demonstrate a significant difference between two groups with 40 participants (20 in each cell) with a z-score of 2.3 (p = .02, two-tailed). The observed power for this result is 65% and it would suggest that a slightly larger sample of N = 60 is sufficient to achieve 80% power (80% chance to get a significant result). However, after correcting for bias, the true power is more likely to be just 33% (see table above) and power for a study with N = 60 would still only be 50%. To achieve 80% power, the replication study would need a sample size of 130 participants. Sample sizes would need to be even larger taking into account that the actual probability of a successful replication is even lower than the probability based on post-hoc power analysis. In the OSF-project only 1 out of 30 studies with an original z-score between 2 and 3 was successfully replicated.

IMPLICATIONS FOR THE EVALUATION OF PUBLISHED RESULTS

The results also have implications for the way social psychologists should conduct and evaluate new research. The main reason why z-scores between 2 and 3 provide untrustworthy evidence for an effect is that they are obtained with underpowered studies and publication bias. As a result, it is likely that the strength of evidence is inflated. If, however, the same z-scores were obtained in studies with high power, a z-score of 2.5 would provide more credible evidence for an effect. The strength of evidence in a single study would still be subject to random sampling error, but it would no longer be subject to systematic bias. Therefore, the evidence would be more likely to reveal a true effect and it would be less like to be a false positive.   This implies that z-scores should be interpreted in the context of other information about the likelihood of selection bias. For example, a z-score of 2.5 in a pre-registered study provides stronger evidence for an effect than the same z-score in a study where researchers may have had a chance to conduct multiple studies and to select the most favorable results for publication.

The same logic can also be applied to journals and labs. A z-score of 2.5 in a journal with an average z-score of 2.3 is less trustworthy than a z-score of 2.5 in a journal with an average z-score of 3.5. In the former journal, a z-score of 2.5 is likely to be inflated, whereas in the latter journal a z-score of 2.5 is more likely to be negatively biased by sampling error. For example, currently a z-score of 2.5 is more likely to reveal a true effect if it is published in a cognitive journal than a social journal (see ranking of psychology journals).

The same logic applies even more strongly to labs because labs have a distinct research culture (MO). Some labs conduct many underpowered studies and publish only the studies that worked. Other labs may conduct fewer studies with high power. A z-score of 2.5 is more trustworthy if it comes from a lab with high average power than from a lab with low average power. Thus, providing information about the post-hoc-power of individual researchers can help readers to evaluate the strength of evidence of individual studies in the context of the typical strength of evidence that is obtained in a specific lab. This will create an incentive to publish results with strong evidence rather than fishing for significant results because a low replicability index increases the criterion at which results from a lab provide evidence for an effect.

The Replicability of Cognitive Psychology in the OSF-Reproducibility-Project

The OSF-Reproducibility Project (Psychology) aimed to replicate 100 results published in original research articles in three psychology journals in 2008. The selected journals focus on publishing results from experimental psychology. The main paradigm of experimental psychology is to recruit samples of participants and to study their behaviors in controlled laboratory conditions. The results are then generalized to the typical behavior of the average person.

An important methodological distinction in experimental psychology is the research design. In a within-subject design, participants are exposed to several (a minimum of two) situations and the question of interest is whether responses to one situation differ from behavior in other situations. The advantage of this design is that individuals serve as their own controls and variation due to unobserved causes (mood, personality, etc.) does not influence the results. This design can produce high statistical power to study even small effects. The design is often used by cognitive psychologists because the actual behaviors are often simple behaviors (e.g., pressing a button) that can be repeated many times (e.g., to demonstrate interference in the Stroop paradigm).

In a between-subject design, participants are randomly assigned to different conditions. A mean difference between conditions reveals that the experimental manipulation influenced behavior. The advantage of this design is that behavior is not influenced by previous behaviors in the experiment (carry over effects). The disadvantage is that many uncontrolled factors (e..g, mood, personality) also influence behavior. As a result, it can be difficult to detect small effects of an experimental manipulation among all of the other variance that is caused by uncontrolled factors. As a result, between-subject designs require large samples to study small effects or they can only be used to study large effects.

One of the main findings of the OSF-Reproducibility Project was that results from within-subject designs used by cognitive psychology were more likely to replicate than results from between-subject designs used by social psychologists. There were two few between-subject studies by cognitive psychologists or within-subject designs by social psychologists to separate these factors.   This result of the OSF-reproducibility project was predicted by PHP-curves of the actual articles as well as PHP-curves of cognitive and social journals (Replicability-Rankings).

Given the reliable difference between disciplines within psychology, it seems problematic to generalize the results of the OSF-reproducibility project across all areas of psychology. For this reason, I conducted separate analyses for social psychology and for cognitive psychology. This post examines the replicability of results in cognitive psychology. The results for social psychology are posted here.

The master data file of the OSF-reproducibilty project contained 167 studies with replication results for 99 studies. 42 replications were classified as cognitive studies. I excluded Reynolds and Bresner was excluded because the original finding was not significant. I excluded C Janiszewski, D Uy (doi:10.1111/j.1467-9280.2008.02057.x) because it examined the anchor effect, which I consider to be social psychology. Finally, I excluded two studies with children as participants because this research falls into developmental psychology (E Nurmsoo, P Bloom; V Lobue, JS DeLoache).

I first conducted a post-hoc-power analysis of the reported original results. Test statistics were first converted into two-tailed p-values and two-tailed p-values were converted into absolute z-scores using the formula (1 – norm.inverse(1-p/2). Post-hoc power was estimated by fitting the observed z-scores to predicted z-scores with a mixed-power model with three parameters (Brunner & Schimmack, in preparation).

Estimated power was 75%. This finding reveals the typical presence of publication bias because the actual success rate of 100% is too high given the power of the studies.  Based on this estimate, one would expect that only 75% of the 38 findings (k = 29) would produce a significant result in a set of 38 exact replication studies with the same design and sample size.

PHP-Curve OSF-REP Cognitive Original Data

The Figure visualizes the discrepancy between observed z-scores and the success rate in the original studies. Evidently, the distribution is truncated and suggests a file-drawer of missing studies with non-significant results. However, the mode of the curve (it’s highest point) is projected to be on the right side of the significance criterion (z = 1.96, p = .05 (two-tailed)), which suggests that more than 50% of results should replicate. Given the absence of reliable data in the range from 0 to 1.96, the data make it impossible to estimate the exact distribution in this region, but the gentle decline of z-scores on the right side of the significance criterion suggests that the file-drawer is relatively small.

Sample sizes of the replication studies were based on power analysis with the reported effect sizes. The problem with this approach is that the reported effect sizes are inflated and provide an inflated estimate of true power. With a true power estimate of 75%, the inflated power estimates were above 80% and often over 90%. As a result, many replication studies used the same sample size and some even used a smaller sample size because the original study appeared to be overpowered (the sample size was much larger than needed). The median sample size for the original studies was 32. The median sample size for the replication studies was N = 32. Changes in sample sizes make it difficult to compare the replication rate of the original studies with those of the replication study. Therefore, I adjusted the z-scores of the replication study to match z-scores that would have been obtained with the original sample size. Based on the post-hoc-power analysis above, I predicted that 75% of the replication studies would produce a significant result (k = 29). I also had posted predictions for individual studies based on a more comprehensive assessment of each article. The success rate for my a priori predictions was 69% (k = 27).

The actual replication rate based on adjusted z-scores was 63% (k = 22), although 3 studies produced only p-values between .05 and .06 after the adjustment was applied. If these studies were not counted, the success rate would have been 50% (19/38). This finding suggests that post-hoc power analysis overestimates true power by 10% to 25%. However, it is also possible that some of the replication studies failed to reproduce the exact experimental conditions of the original studies, which would lower the probability of obtaining a significant result. Moreover, the number of studies is very small and the discrepancy may simply be due to random sampling error. The important result is that post-hoc power curves correctly predict that the success rate in a replication study will be lower than the actual success rate because it corrects for the effect of publication bias. It also correctly predicts that a substantial number of studies will be successfully replicated, which they were. In comparison, post-hoc power analysis of social psychology predicted only 35% of successful replications and only 8% successfully replicated. Thus, post-hoc power analysis correctly predicts that results in cognitive psychology are more replicable than results in social psychology.

The next figure shows the post-hoc-power curve for the sample-size corrected z-scores of the replication studies.

PHP-Curve OSF-REP Cognitive Adj. Rep. Data

The PHP-Curve estimate of power for z-scores in the range from 0 to 4 is 53% for the heterogeneous model that fits the data better than a homogeneous model. The shape of the distribution suggests that several of the non-significant results are type-II errors; that is, the studies had insufficient statistical power to demonstrate a real effect.

I also conducted a power analysis that was limited to the non-significant results. The estimated average power was 22%. This power is a mixture of true power in different studies and may contain some cases of true false positives (power = .05), but the existing data are insufficient to determine whether results are true false positives or whether a small effect is present and sample sizes were too small to detect it. Again, it is noteworthy that the same analysis for social psychology produced an estimate of 5%, which suggests that most of the non-significant results in social psychology are true false positives (the null-effect is true).

Below I discuss my predictions of individual studies.

Eight studies reported an effect with a z-score greater than 4 (4 sigma), and I predicted that all of the 4-sigma effects would replicate. 7 out of 8 effects were successfully replicated (D Ganor-Stern, J Tzelgov; JI Campbell, ND Robert; M Bassok, SF Pedigo, AT Oskarsson; PA White; E Vul, H Pashler; E Vul, M Nieuwenstein, N Kanwisher; J Winawer, AC Huk, L Boroditsky). The only exception was CP Beaman, I Neath, AM Surprenant (DOI: 10.1037/0278-7393.34.1.219). It is noteworthy that the sample size of the original study was N = 99 and the sample size of the replication study was N = 14. Even with an adjusted z-score the study produced a non-significant result (p = .19). However, small samples produce less reliable results and it would be interesting to examine whether the result would become significant with an actual sample of 99 participants.

Based on more detailed analysis of individual articles, I predicted that an additional 19 studies would replicate. However, 9 out these 19 studies were not successfully replicated. Thus, my predictions of additional successful replications are just at chance level, given the overall success rate of 50%.

Based on more detailed analysis of individual articles, I predicted that 11 studies would not replicate. However, 5 out these 11 studies were successfully replicated. Thus, my predictions of failed replications are just at chance level, given the overall success rate of 50%.

In short, my only rule that successfully predicted replicability of individual studies was the 4-sigma rule that predicts that all findings with a z-score greater than 4 will replicate.

In conclusion, a replicability of 50-60% is consistent with Cohen’s (1962) suggestion that typical studies in psychology have 60% power. Post-hoc power analysis slightly overestimated the replicability of published findings despite its ability to correct for publication bias. Future research needs to examine the sources that lead to a discrepancy between predicted and realized success rate. It is possible that some of this discrepancy is due to moderating factors. Although a replicability of 50-60% is not as catastrophic as the results for social psychology with estimates in the range from 8-35%, cognitive psychologists should aim to increase the replicability of published results. Given the widespread use of powerful within-subject designs, this is easily achieved by a modest increase in sample sizes from currently 30 participants to 50 participants, which would increase power from 60% to 80%.

The Replicability of Social Psychology in the OSF-Reproducibility Project

Abstract:  I predicted the replicability of 38 social psychology results in the OSF-Reproducibility Project. Based on post-hoc-power analysis I predicted a success rate of 35%.  The actual success rate was 8% (3 out of 38) and post-hoc-power was estimated to be 3% for 36 out of 38 studies (5% power = type-I error rate, meaning the null-hypothesis is true).

The OSF-Reproducibility Project aimed to replicate 100 results published in original research articles in three psychology journals in 2008. The selected journals focus on publishing results from experimental psychology. The main paradigm of experimental psychology is to recruit samples of participants and to study their behaviors in controlled laboratory conditions. The results are then generalized to the typical behavior of the average person.

An important methodological distinction in experimental psychology is the research design. In a within-subject design, participants are exposed to several (a minimum of two) situations and the question of interest is whether responses to one situation differ from behavior in other situations. The advantage of this design is that individuals serve as their own controls and variation due to unobserved causes (mood, personality, etc.) does not influence the results. This design can produce high statistical power to study even small effects. The design is often used by cognitive psychologists because the actual behaviors are often simple behaviors (e.g., pressing a button) that can be repeated many times (e.g., to demonstrate interference in the Stroop paradigm).

In a between-subject design, participants are randomly assigned to different conditions. A mean difference between conditions reveals that the experimental manipulation influenced behavior. The advantage of this design is that behavior is not influenced by previous behaviors in the experiment (carry over effects). The disadvantage is that many uncontrolled factors (e..g, mood, personality) also influence behavior. As a result, it can be difficult to detect small effects of an experimental manipulation among all of the other variance that is caused by uncontrolled factors. As a result, between-subject designs require large samples to study small effects or they can only be used to study large effects.

One of the main findings of the OSF-Reproducibility Project was that results from within-subject designs used by cognitive psychology were more likely to replicate than results from between-subject designs used by social psychologists. There were two few between-subject studies by cognitive psychologists or within-subject designs by social psychologists to separate these factors.   This result of the OSF-reproducibility project was predicted by PHP-curves of the actual articles as well as PHP-curves of cognitive and social journals (Replicability-Rankings).

Given the reliable difference between disciplines within psychology, it seems problematic to generalize the results of the OSF-reproducibility project to all areas of psychology. The Replicability-Rankings suggest that social psychology has a lower replicability than other areas of psychology. For this reason, I conducted separate analyses for social psychology and for cognitive psychology. Other areas of psychology had two few studies to conduct a meaningful analysis. Thus, the OSF-reproducibility results should not be generalized to all areas of psychology.

The master data file of the OSF-reproducibilty project contained 167 studies with replication results for 99 studies.   57 studies were classified as social studies. However, this classification used a broad definition of social psychology that included personality psychology and developmental psychology. It included six articles published in the personality section of the Journal of Personality and Social Psychology. As each section functions essentially like an independent journal, I excluded all studies from this section. The file also contained two independent replications of two experiments (experiment 5 and 7) in Albarracín et al. (2008; DOI: 10.1037/a0012833). As the main sampling strategy was to select the last study of each article, I only included Study 7 in the analysis (Study 5 did not replicate, p = .77). Thus, my selection did not lower the rate of successful replications. There were also two independent replications of the same result in Bressan and Stranieri (2008). Both replications produced non-significant results (p = .63, p = .75). I selected the replication study with the larger sample (N = 318 vs. 259). I also excluded two studies that were not independent replications. Rule and Ambady (2008) examined the correlation between facial features and success of CEOs. The replication study had new raters to rate the faces, but used the same faces. Heine, Buchtel, and Norenzayan (2008) examined correlates of conscientiousness across nations and the replication study examined the same relationship across the same set of nations. I also excluded replications of non-significant results because non-significant results provide ambiguous information and cannot be interpreted as evidence for the null-hypothesis. For this reason, it is not clear how the results of a replication study should be interpreted. Two underpowered studies could easily produce consistent results that are both type-II errors. For this reason, I excluded Ranganath and Nosek (2008) and Eastwick and Finkel (2008). The final sample consisted of 38 articles.

I first conducted a post-hoc-power analysis of the reported original results. Test statistics were first converted into two-tailed p-values and two-tailed p-values were converted into absolute z-scores using the formula (1 – norm.inverse(1-p/2). Post-hoc power was estimated by fitting the observed z-scores to predicted z-scores with a mixed-power model with three parameters (Brunner & Schimmack, in preparation).

Estimated power was 35%. This finding reflects the typical finding that reported results are a biased sample of studies that produced significant results, whereas non-significant results are not submitted for publication. Based on this estimate, one would expect that only 35% of the 38 findings (k = 13) would produce a significant result in an exact replication study with the same design and sample size.

PHP-Curve OSF-REP-Social-Original

The Figure visualizes the discrepancy between observed z-scores and the success rate in the original studies. Evidently, the distribution is truncated and the mode of the curve (it’s highest point) is projected to be on the left side of the significance criterion (z = 1.96, p = .05 (two-tailed)). Given the absence of reliable data in the range from 0 to 1.96, the data make it impossible to estimate the exact distribution in this region, but the step decline of z-scores on the right side of the significance criterion suggests that many of the significant results achieved significance only with the help of inflated observed effect sizes. As sampling error is random, these results will not replicate again in a replication study.

The replication studies had different sample sizes than the original studies. This makes it difficult to compare the prediction to the actual success rate because the actual success rate could be much higher if the replication studies had much larger samples and more power to replicate effects. For example, if all replication studies had sample sizes of N = 1,000, we would expect a much higher replication rate than 35%. The median sample size of the original studies was N = 86. This is representative of studies in social psychology. The median sample size of the replication studies was N = 120. Given this increase in power, the predicted success rate would increase to 50%. However, the increase in power was not uniform across studies. Therefore, I used the p-values and sample size of the replication study to compute the z-score that would have been obtained with the original sample size and I used these results to compare the predicted success rate to the actual success rate in the OSF-reproducibility project.

The depressing finding was that the actual success rate was much lower than the predicted success rate. Only 3 out of 38 results (8%) produced a significant result (without the correction of sample size 5 findings would have been significant). Even more depressing is the fact that a 5% criterion, implies that every 20 studies are expected to produce a significant result just by chance. Thus, the actual success rate is close to the success rate that would be expected if all of the original results were false positives. A success rate of 8% would imply that the actual power of the replication studies was only 8%, compared to the predicted power of 35%.

The next figure shows the post-hoc-power curve for the sample-size corrected z-scores.

PHP-Curve OSF-REP-Social-AdjRep

The PHP-Curve estimate of power for z-scores in the range from 0 to 4 is 3% for the homogeneous case. This finding means that the distribution of z-scores for 36 of the 38 results is consistent with the null-hypothesis that the true effect size for these effects is zero. Only two z-scores greater than 4 (one shown, the other greater than 6 not shown) appear to be replicable and robust effects.

One replicable finding was obtained in a study by Halevy, Bornstein, and Sagiv. The authors demonstrated that allocation of money to in-group and out-group members is influenced much more by favoring the in-group than by punishing the out-group. Given the strong effect in the original study (z > 4), I had predicted that this finding would replicate.

The other successful replication was a study by Lemay and Clark (DOI: 10.1037/0022-3514.94.4.647). The replicated finding was that participants’ projected their own responsiveness in a romantic relationship onto their partners’ responsiveness while controlling for partners’ actual responsiveness. Given the strong effect in the original study (z > 4), I had predicted that this finding would replicate.

Based on weak statistical evidence in the original studies, I had predicted failures of replication for 25 studies. Given the low success rate, it is not surprising that my success rate was 100.

I made the wrong prediction for 11 results. In all cases, I predicted a successful replication when the outcome was a failed replication. Thus, my overall success rate was 27/38 = 71%. Unfortunately, this success rate is easily beaten by a simple prediction rule that nothing in social psychology replicates, which is wrong in only 3 out of 38 predictions (89% success rate).

Below I briefly comment on the 11 failed predictions.

1   Based on strong statistics (z > 4), I had predicted a successful replication for Förster, Liberman, and Kuschel (DOI: 10.1037/0022-3514.94.4.579). However, even when I made this predictions based on the reported statistics, I had my doubts about this study because statisticians had discovered anomalies in Jens Förster’s studies that cast doubt on the validity of these reported results. Post-hoc power analysis can correct for publication bias, but it cannot correct for other sources of bias that lead to vastly inflated effect sizes.

2   I predicted a successful replication of Payne, MA Burkley, MB Stokes. The replication study actually produced a significant result, but it was no longer significant after correcting for the larger sample size in the replication study (180 vs. 70, p = .045 vs. .21). Although the p-value in the replication study is not very reassuring, it is possible that this is a real effect. However, the original result was probably still inflated by sampling error to produce a z-score of 2.97.

3   I predicted a successful replication of McCrae (DOI: 10.1037/0022-3514.95.2.274). This prediction was based on a transcription error. Whereas the z-score for the target effect was 1.80, I posted a z-score of 3.5. Ironically, the study did successfully replicate with a larger sample size, but the effect was no longer significant after adjusting the result for sample size (N = 61 vs. N = 28). This study demonstrates that marginally significant effects can reveal real effects, but it also shows that larger samples are needed in replication studies to demonstrate this.

4   I predicted a successful replication for EP Lemay, MS Clark (DOI: 10.1037/0022-3514.95.2.420). This prediction was based on a transcription error because EP Lemay and MS Clark had another study in the project. With the correct z-score of the original result (z = 2.27), I would have predicted correctly that the result would not replicate.

5  I predicted a successful replication of Monin, Sawyer, and Marquez (DOI: 10.1037/0022-3514.95.1.76) based on a strong result for the target effect (z = 3.8). The replication study produced a z-score of 1.45 with a sample size that was not much larger than the original study (N = 75 vs. 67).

6  I predicted a successful replication for Shnabel and Nadler (DOI: 10.1037/0022-3514.94.1.116). The replication study increased sample size by 50% (Ns = 141 vs. 94), but the effect in the replication study was modest (z = 1.19).

7  I predicted a successful replication for van Dijk, van Kleef, Steinel, van Beest (DOI: 10.1037/0022-3514.94.4.600). The sample size in the replication study was slightly smaller than in the original study (N = 83 vs. 103), but even with adjustment the effect was close to zero (z = 0.28).

8   I predicted a successful replication of V Purdie-Vaughns, CM Steele, PG Davies, R Ditlmann, JR Crosby (DOI: 10.1037/0022-3514.94.4.615). The original study had rather strong evidence (z = 3.35). In this case, the replication study had a much larger sample than the original study (N = 1,490 vs. 90) and still did not produce a significant result.

9  I predicted a successful replication of C Farris, TA Treat, RJ Viken, RM McFall (doi:10.1111/j.1467-9280.2008.02092.x). The replication study had a somewhat smaller sample (N = 144 vs. 280), but even with adjustment of sample size the effect in the replication study was close to zero (z = 0.03).

10   I predicted a successful replication of KD Vohs and JW Schooler (doi:10.1111/j.1467-9280.2008.02045.x)). I made this prediction of generally strong statistics, although the strength of the target effect was below 3 (z = 2.8) and the sample size was small (N = 30). The replication study doubled the sample size (N = 58), but produced weak evidence (z = 1.08). However, even the sample size of the replication study is modest and does not allow strong conclusions about the existence of the effect.

11   I predicted a successful replication of Blankenship and Wegener (DOI: 10.1037/0022-3514.94.2.94.2.196). The article reported strong statistics and the z-score for the target effect was greater than 3 (z = 3.36). The study also had a large sample size (N = 261). The replication study also had a similarly large sample size (N = 251), but the effect was much smaller than in the original study (z = 3.36 vs. 0.70).

In some of these failed predictions it is possible that the replication study failed to reproduce the same experimental conditions or that the population of the replication study differs from the population of the original study. However, there are twice as many studies where the failure of replication was predicted based on weak statistical evidence and the presence of publication bias in social psychology journals.

In conclusion, this set of results from a representative sample of articles in social psychology reported a 100% success rate. It is well known that this success rate can only be achieved with selective reporting of significant results. Even the inflated estimate of median observed power is only 71%, which shows that the success rate of 100% is inflated. A power estimate that corrects for inflation suggested that only 35% of results would replicate, and the actual success rate is only 8%. While mistakes by the replication experimenters may contribute to the discrepancy between the prediction of 35% and the actual success rate of 8%, it was predictable based on the results in the original studies that the majority of results would not replicate in replication studies with the same sample size as the original studies.

This low success rate is not characteristic of other sciences and other disciplines in psychology. As mentioned earlier, the success rate for cognitive psychology is higher and comparisons of psychological journals show that social psychology journals have lower replicability than other journals. Moreover, an analysis of time trends shows that replicability of social psychology journals has been low for decades and some journals even show a negative trend in the past decade.

The low replicability of social psychology has been known for over 50 years, when Cohen examined the replicability of results published in the Journal of Social and Abnormal Psychology (now Journal of Personality and Social Psychology), the flagship journal of social psychology. Cohen estimated a replicability of 60%. Social psychologists would rejoice if the reproducibility project had shown a replication rate of 60%. The depressing result is that the actual replication rate was 8%.

The main implication of this finding is that it is virtually impossible to trust any results that are being published in social psychology journals. Yes, two articles that posted strong statistics (z > 4) replicated, but several results with equally strong statistics did not replicate. Thus, it is reasonable to distrust all results with z-scores below 4 (4 sigma rule), but not all results with z-scores greater than 4 will replicate.

Given the low credibility of original research findings, it will be important to raise the quality of social psychology by increasing statistical power. It will also be important to allow publication of non-significant results to reduce the distortion that is created by a file-drawer filled with failed studies. Finally, it will be important to use stronger methods of bias-correction in meta-analysis because traditional meta-analysis seemed to show strong evidence even for incredible effects like premonition for erotic stimuli (Bem, 2011).

In conclusion, the OSF-project demonstrated convincingly that many published results in social psychology cannot be replicated. If social psychology wants to be taken seriously as a science, it has to change the way data are collected, analyzed, and reported and demonstrate replicability in a new test of reproducibility.

The silver lining is that a replication rate of 8% is likely to be an underestimation and that regression to the mean alone might lead to some improvement in the next evaluation of social psychology.

When Exact Replications Are Too Exact: The Lucky-Bounce-Test for Pairs of Exact Replication Studies

Imagine an NBA player has an 80% chance to make one free throw. What is the chance that he makes both free throws? The correct answer is 64% (80% * 80%).

Now consider the possibility that it is possible to distinguish between two types of free throws. Some free throws are good; they don’t touch the rim and make a swishing sound when they go through the net (all net). The other free throws bounce of the rim and go in (rattling in).

What is the probability that an NBA player with an 80% free throw percentage makes a free throw that is all net or rattles in? It is more likely that an NBA player with an 80% free throw average makes a perfect free throw because a free throw that rattles in could easily have bounded the wrong way, which would lower the free throw percentage. To achieve an 80% free throw percentage, most free throws have to be close to perfect.

Let’s say the probability of hitting the rim and going in is 30%. With an 80% free throw average, this means that the majority of free throws are in the close-to-perfect category (20% misses, 30% rattle-in, 50% close-to-perfect).

What does this have to do with science? A lot!

The reason is that the outcome of a scientific study is a bit like throwing free throws. One factor that contributes to a successful study is skill (making correct predictions, avoiding experimenter errors, and conducting studies with high statistical power). However, another factor is random (a lucky or unlucky bounce).

The concept of statistical power is similar to an NBA players’ free throw percentage. A researcher who conducts studies with 80% statistical power is going to have an 80% success rate (that is, if all predictions are correct). In the remaining 20% of studies, a study will not produce a statistically significant result, which is equivalent to missing a free throw and not getting a point.

Many years ago, Jacob Cohen observed that researchers often conduct studies with relatively low power to produce a statistically significant result. Let’s just assume right now that a researcher conducts studies with 60% power. This means, researchers would be like NBA players with a 60% free-throw average.

Now imagine that researchers have to demonstrate an effect not only once, but also a second time in an exact replication study. That is researchers have to make two free throws in a row. With 60% power, the probability to get two significant results in a row is only 36% (60% * 60%). Moreover, many of the freethrows that are made rattle in rather than being all net. The percentages are about 40% misses, 30% rattling in and 30% all net.

One major difference between NBA players and scientists is that NBA players have to demonstrate their abilities in front of large crowds and TV cameras, whereas scientists conduct their studies in private.

Imagine an NBA player could just go into a private room, throw two free throws and then report back how many free throws he made and the outcome of these free throws determine who wins game 7 in the playoff finals. Would you trust the player to tell the truth?

If you would not trust the NBA player, why would you trust scientists to report failed studies? You should not.

It can be demonstrated statistically that scientists are reporting more successes than the power of their studies would justify (Sterling et al., 1995; Schimmack, 2012). Amongst scientists this fact is well known, but the general public may not fully appreciate the fact that a pair of exact replication studies with significant results is often just a selection of studies that included failed studies that were not reported.

Fortunately, it is possible to use statistics to examine whether the results of a pair of studies are likely to be honest or whether failed studies were excluded. The reason is that an amateur is not only more likely to miss a free throw. An amateur is also less likely to make a perfect free throw.

Based on the theory of statistical power developed by Nyman and Pearson and popularized by Jacob Cohen, it is possible to make predictions about the relative frequency of p-values in the non-significant (failure), just significant (rattling in), and highly significant (all net) ranges.

As for made-free-throws, the distinction between lucky and clear successes is somewhat arbitrary because power is continuous. A study with a p-value of .0499 is very lucky because p = .501 would have been not significant (rattled in after three bounces on the rim). A study with p = .000001 is a clear success. Lower p-values are better, but where to draw the line?

As it turns out, Jacob Cohen’s recommendation to conduct studies with 80% power provides a useful criterion to distinguish lucky outcomes and clear successes.

Imagine a scientist conducts studies with 80% power. The distribution of observed test-statistics (e.g. z-scores) shows that this researcher has a 20% chance to get a non-significant result, a 30% chance to get a lucky significant result (p-value between .050 and .005), and a 50% chance to get a clear significant result (p < .005). If the 20% failed studies are hidden, the percentage of results that rattled in versus studies with all-net results are 37 vs. 63%. However, if true power is just 20% (an amateur), 80% of studies fail, 15% rattle in, and 5% are clear successes. If the 80% failed studies are hidden, only 25% of the successful studies are all-net and 75% rattle in.

One problem with using this test to draw conclusions about the outcome of a pair of exact replication studies is that true power is unknown. To avoid this problem, it is possible to compute the maximum probability of a rattling-in result. As it turns out, the optimal true power to maximize the percentage of lucky outcomes is 66% power. With true power of 66%, one would expect 34% misses (p > .05), 32% lucky successes (.050 < p < .005), and 34% clear successes (p < .005).

LuckyBounceTest

For a pair of exact replication studies, this means that there is only a 10% chance (32% * 32%) to get two rattle-in successes in a row. In contrast, there is a 90% chance that misses were not reported or that an honest report of successful studies would have produced at least one all-net result (z > 2.8, p < .005).

Example: Unconscious Priming Influences Behavior

I used this test to examine a famous and controversial set of exact replication studies. In Bargh, Chen, and Burrows (1996), Dr. Bargh reported two exact replication studies (studies 2a and 2b) that showed an effect of a subtle priming manipulation on behavior. Undergraduate students were primed with words that are stereotypically associated with old age. The researchers then measured the walking speed of primed participants (n = 15) and participants in a control group (n = 15).

The two studies were not only exact replications of each other; they also produced very similar results. Most readers probably expected this outcome because similar studies should produce similar results, but this false belief ignores the influence of random factors that are not under the control of a researcher. We do not expect lotto winners to win the lottery again because it is an entirely random and unlikely event. Experiments are different because there could be a systematic effect that makes a replication more likely, but in studies with low power results should not replicate exactly because random sampling error influences results.

Study 1: t(28) = 2.86, p = .008 (two-tailed), z = 2.66, observed power = 76%
Study 2: t(28) = 2.16, p = .039 (two-tailed), z = 2.06, observed power = 54%

The median power of these two studies is 65%. However, even if median power were lower or higher, the maximum probability of obtaining two p-values in the range between .050 and .005 remains just 10%.

Although this study has been cited over 1,000 times, replication studies are rare.

One of the few published replication studies was reported by Cesario, Plaks, and Higgins (2006). Naïve readers might take the significant results in this replication study as evidence that the effect is real. However, this study produced yet another lucky success.

Study 3: t(62) = 2.41, p = .019, z = 2.35, observed power = 65%.

The chances of obtaining three lucky successes in a row is only 3% (32% *32% * 32*). Moreover, with a median power of 65% and a reported success rate of 100%, the success rate is inflated by 35%. This suggests that the true power of the reported studies is considerably lower than the observed power of 65% and that observed power is inflated because failed studies were not reported.

The R-Index corrects for inflation by subtracting the inflation rate from observed power (65% – 35%). This means the R-Index for this set of published studies is 30%.

This R-Index can be compared to several benchmarks.

An R-Index of 22% is consistent with the null-hypothesis being true and failed attempts are not reported.

An R-Index of 40% is consistent with 30% true power and all failed attempts are not reported.

It is therefore not surprising that other researchers were not able to replicate Bargh’s original results, even though they increased statistical power by using larger samples (Pashler et al. 2011, Doyen et al., 2011).

In conclusion, it is unlikely that Dr. Bargh’s original results were the only studies that they conducted. In an interview, Dr. Bargh revealed that the studies were conducted in 1990 and 1991 and that they conducted additional studies until the publication of the two studies in 1996. Dr. Bargh did not reveal how many studies they conducted over the span of 5 years and how many of these studies failed to produce significant evidence of priming. If Dr. Bargh himself conducted studies that failed, it would not be surprising that others also failed to replicate the published results. However, in a personal email, Dr. Bargh assured me that “we did not as skeptics might presume run many studies and only reported the significant ones. We ran it once, and then ran it again (exact replication) in order to make sure it was a real effect.” With a 10% probability, it is possible that Dr. Bargh was indeed lucky to get two rattling-in findings in a row. However, his aim to demonstrate the robustness of an effect by trying to show it again in a second small study is misguided. The reason is that it is highly likely that the effect will not replicate or that the first study was already a lucky finding after some failed pilot studies. Underpowered studies cannot provide strong evidence for the presence of an effect and conducting multiple underpowered studies reduces the credibility of successes because the probability of this outcome to occur even when an effect is present decreases with each study (Schimmack, 2012). Moreover, even if Bargh was lucky to get two rattling-in results in a row, others will not be so lucky and it is likely that many other researchers tried to replicate this sensational finding, but failed to do so. Thus, publishing lucky results hurts science nearly as much as the failure to report failed studies by the original author.

Dr. Bargh also failed to realize how lucky he was to obtain his results, in his response to a published failed-replication study by Doyen. Rather than acknowledging that failures of replication are to be expected, Dr. Bargh criticized the replication study on methodological grounds. There would be a simple solution to test Dr. Bargh’s hypothesis that he is a better researcher and that his results are replicable when the study is properly conducted. He should demonstrate that he can replicate the result himself.

In an interview, Tom Bartlett asked Dr. Bargh why he didn’t conduct another replication study to demonstrate that the effect is real. Dr. Bargh’s response was that “he is aware that some critics believe he’s been pulling tricks, that he has a “special touch” when it comes to priming, a comment that sounds like a compliment but isn’t. “I don’t think anyone would believe me,” he says.” The problem for Dr. Bargh is that there is no reason to believe his original results, either. Two rattling-in results alone do not constitute evidence for an effect, especially when this result could not be replicated in an independent study. NBA players have to make free-throws in front of a large audience for a free-throw to count. If Dr. Bargh wants his findings to count, he should demonstrate his famous effect in an open replication study. To avoid embarrassment, it would be necessary to increase the power of the replication study because it is highly unlikely that even Dr. Bargh can continuously produce significant results with samples of N = 30 participants. Even if the effect is real, sampling error is simply too large to demonstrate the effect consistently. Knowledge about statistical power is power. Knowledge about post-hoc power can be used to detect incredible results. Knowledge about a priori power can be used to produce credible results.

Swish!