Introduction
Richard Nisbett has been an influential experimental social psychologist. His co-authored book on faulty human information processing (Nisbett & Ross, 1980) provided the foundation of experimental studies of social cognition (Fiske & Taylor, 1984). Experiments became the dominant paradigm in social psychology with success stories like Daniel Kahneman’s Noble Price for Economics and embarrassments like Diederik Staple’s numerous retractions because he fabricated data for articles published in experimental social psychology (ESP) journals.
The Stapel Debacle raised questions about the scientific standards of experimental social psychology. The reputation of Experimental Social Psychology (ESP) also took a hit when the top journal of ESP research published an article by Daryl Bem that claimed to provide evidence for extra-sensory perceptions. For example, in one study extraverts seemed to be able to foresee the location of pornographic images before a computer program determined the location. Subsequent analyses of his results and data revealed that Daryl Bem did not use scientific methods properly and that the results provide no credible empirical evidence for his claims (Francis, 2012; Schimmack, 2012; Schimmack, 2018).
More detrimental for the field of experimental social psychology was that Bem’s carefree use of scientific methods is common in experimental social psychology; in part because Bem wrote a chapter that instructed generations of experimental social psychologists how they could produce seemingly perfect results. The use of these questionable research practices explains why over 90% of published results in social psychology journals support authors’ hypotheses (Sterling, 1959; Sterling et al., 1995).
Since 2011, some psychologists have started to put the practices and results of experimental social psychologists under the microscope. The most impressive evidence comes from a project that tried to replicate a representative sample of psychological studies (Open Science Collaboration, 2015). Only a quarter of social psychology experiments could be replicated successfully.
The response by eminent social psychologists to these findings has been a classic case of motivated reasoning and denial. For example, in an interview for the Chronicle of Higher Education, Nisbett dismissed these results by attributing them to problems of the replication studies.
Nisbett has been calculating effect sizes since before most of those in the replication movement were born. And he’s a skeptic of this new generation of skeptics. For starters, Nisbett doesn’t think direct replications are efficient or sensible; instead he favors so-called conceptual replication, which is more or less taking someone else’s interesting result and putting your own spin on it. Too much navel-gazing, according to Nisbett, hampers professional development. “I’m alarmed at younger people wasting time and their careers,” he says. He thinks that Nosek’s ballyhooed finding that most psychology experiments didn’t replicate did enormous damage to the reputation of the field, and that its leaders were themselves guilty of methodological problems. And he’s annoyed that it’s led to the belief that social psychology is riddled with errors. “How do they know that?”, Nisbett asks, dropping in an expletive for emphasis.
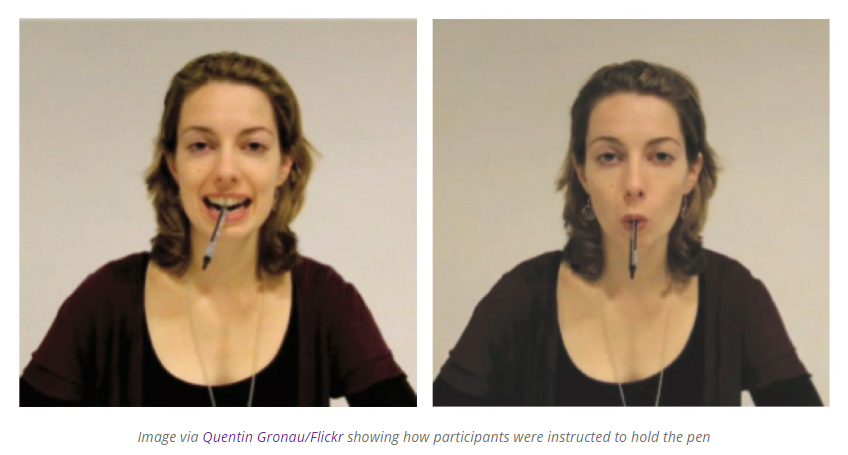
In contrast to Nisbett’s defensive response, Noble Laureate Daniel Kahneman has expressed concerns about the replicability of BS-ESP results that he reported in his popular book “Thinking: Fast and Slow” He also wrote a letter to experimental social psychologists suggesting that they should replicate their findings. It is telling that several years later, eminent experimental social psychologists have not published self-replications of their classic findings.
Nisbett also ignores that Nosek’s findings are consistent with statistical analyses that show clear evidence of questionable research practices and evidence that published results are too good to be true (Francis, 2014). Below I present new evidence about the credibility of experimental social psychology based on a representative sample of published studies in social psychology.
How Replicable are Between-Subject Social Psychology Experiments (BS-ESP)?
Motyl and colleagues (2017) coded hundreds of articles and over one-thousand published studies in social psychology journals. They recorded information about the type of study (experimental or correlational), the design of the study (within subject vs. between-subject) and about the strength of an effect (as reflected in test statistics or p-values). After crunching the numbers, their results showed clear evidence of publication bias, but also evidence that social psychologists published some robust and replicable results.
In a separate blog-post, I agreed with this general conclusion. However, Motyl et al.’s assessment was based on a broad range of studies, including correlational studies with large samples. Few people doubt that these results would replicate, but experimental social psychologist tend to dismiss these findings because they are correlational (Nisbett, 2016).
The replicability of BS-ESP results is more doubtful because these studies often used between-subject designs with small samples, which makes it difficult to obtain statistically significant results. For example, John Bargh used only 30 participants (15 per condition) for his famous elderly priming study that failed to replicate.
I conducted a replicability analysis of BS-ESP results based on a subset of studies in Motly’s dataset. I selected only studies with between-subject experiments where participants were randomly assigned to different conditions with one degree of freedom. The studies could be comparisons of two groups or a 2 x 2 design that is also often used by experimental social psychologists to demonstrate interaction (moderator) effects. I also excluded studies with fewer than 20 participants per condition because these studies should not have been published because parametric tests require a minimum of 20 participants to be robust (Cohen, 1994).
There were k = 314 studies that fulfilled these criteria. Two-hundred-seventy-eight of these studies (89%) were statistically significant at the standard criterion of p < .05. Including marginally significant and one-sided tests, 95% were statistically significant. This success rate is consistent with Sterling’s results in the 1950s and 1990s and the results of the OSC project. For the replicability analysis, I focused on the 278 results that met the standard criterion of statistical significance.
First, I compared the mean effect size without correcting for publication bias with the bias-corrected effect size estimate using the latest version of puniform (vanAert, 2018). The mean effect size of the k = 278 studies was d = .64, while the bias-corrected puniform estimate was more than 50% lower, d = .30. The finding that actual effect sizes are approximately half of the published effect sizes is consistent with the results based on actual replication studies (OSC, 2015).
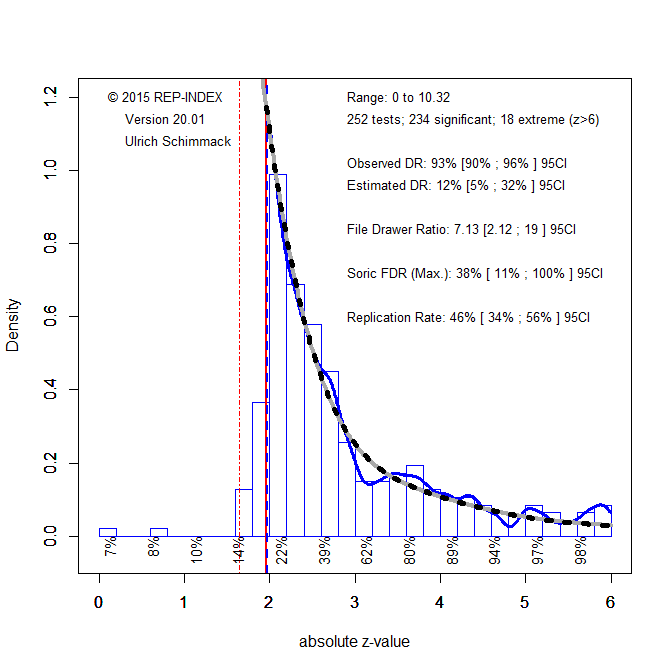
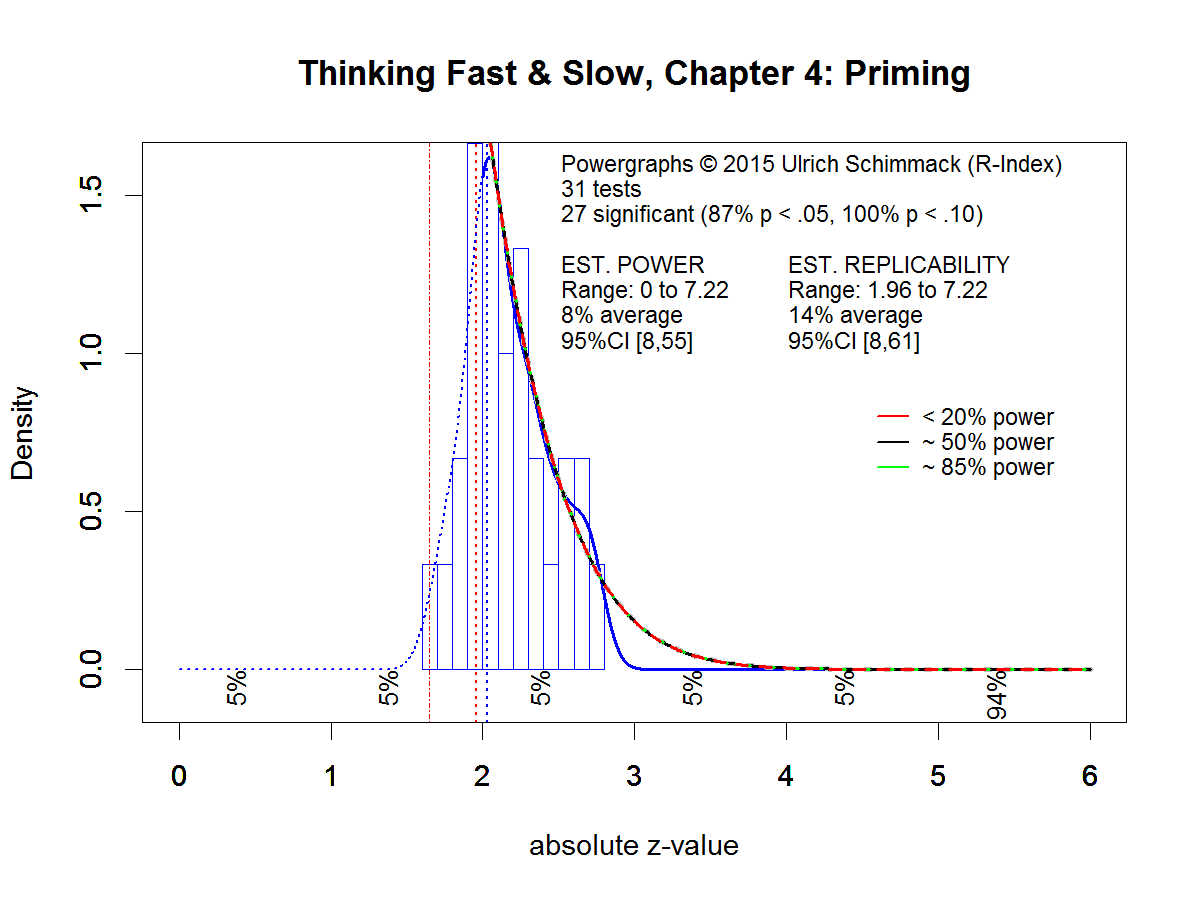
Next, I used z-curve (Brunner & Schimmack, 2018) to estimate mean power of the published studies based on the test statistics reported in the original articles. Mean power predicts the success rate if the 278 studies were exactly replicated. The advantage of using a statistical approach is that it avoids problems of carrying out exact replication studies, which is often difficult and sometimes impossible.
Figure 1. Histogram of the strength of evidence against the null-hypothesis in a representative sample of (k = 314) between-subject experiments in social psychology. 
The Nominal Test of Insufficient Variance (Schimmack, 2015) showed 61% of results within the range from z = 1.96 and z = 2.80, when only a maximum of 32% is expected from a representative sample of independent tests. The z-statistic of 10.34 makes it clear that this is not a chance finding. Visual inspection shows a sharp drop at a z-score of 1.96, which corresponds to the significance criterion, p < .05, two-tailed. Taken together, these results provide clear evidence that published results are not representative of all studies that are conducted by experimental psychologists. Rather, published results are selected to provide evidence in favor of authors’ hypotheses.
The mean power of statistically significant results is 32% with a 95%CI ranging from 23% to 39%. This means that many of the studies that were published with a significant result would not reproduce a significant result in an actual replication attempt. With an estimate of 32%, the success rate is not reliably higher than the success rate for actual replication studies in the Open Science Reproducibility Project (OSC, 2015). Thus, it is clear that the replication failures are the result of shoddy research practices in the original studies rather than problems of exact replication studies.
The estimate of 32% is also consistent with my analysis of social psychology experiments in Bargh’s book “Before you know it” that draws heavily on BS-ESP results. Thus, the present results replicate previous analyses based on a set of studies that were selected by an eminent experimental social psychologist. Thus, replication failures in experimental social psychology are highly replicable.
A new statistic under development is the maximum false discovery rate; that is, the percentage of significant results that could be false positives. It is based on the fit of z-curves with different proportions of false positives (z = 0). The maximum false discovery rate is 70% with a 95%CI ranging from 50% to 85%. This means, the data are so weak that it is impossible to rule out the possibility that most BS-ESP results are false.
Conclusion
Nisbett’s questioned how critics know that ESP is riddled with errors. I answered his call for evidence by presenting a z-curve analysis of a representative set of BS-ESP results. The results are consistent with findings from actual replication studies. There is clear evidence of selection bias and consistent evidence that the majority of published BS-ESP results cannot be replicated in exact replication studies. Nisbett dismisses this evidence and attributes replication failures to problems with the replication studies. This attribution is a classic example of a self-serving attribution error; that is, the tendency to blame others for negative outcomes.
The low replicability of BS-ESP results is not surprising, given several statements by experimental social psychologists about their research practices. For example, Bem’s (2001) advised students that it is better to “err on the side of discovery” (translation: a fun false finding is better than no finding). He also shrugged off replication failures of his ESP studies with a comment that he doesn’t care whether his results replicate or not.
“I used data as a point of persuasion, and I never really worried about, ‘Will this replicate or will this not?” (Daryl J. Bem, in Engber, 2017)
A similar attitude is revealed in Baumeister’s belief that personality psychology has lost appeal because it developed its scientific method and a “gain in rigor was accomplished by a loss in interest.” I agree that fiction can be interesting, but science without rigor is science fiction.
Another social psychologist (I forgot the name) once bragged openly that he was able to produce significant results in 30% of his studies and compared this to a high batting averages in baseball. In baseball it is indeed impressive to hit a fast small ball with a bat 1 out of 3 times. However, I prefer to compare success rates of BS-ESP researchers to the performance of my students on an exam, where a 30% success rate earns them a straight F. And why would anybody watch a movie that earned a 32% average rating on rottentomatoes.com, unless they are watching it because watching bad movies can be fun (e.g., “The Room”).
The problems of BS-ESP research are by no means new. Tversky and Kahneman (1971) tried to tell psychologists decades ago that studies with low power should not be conducted. Despite decades of warnings by methodologists (Cohen, 1962, 1994), social psychologists have blissfully ignored these warnings and continue to publish meaningless statistically significant results and hiding non-significant ones. In doing so, they conducted the ultimate attribution error. They attributed the results of their studies to the behavior of their participants, while the results actually depended on their own biases that determined which studies they selected for publication.
Many experimental social psychologists prefer to ignore evidence that their research practices are flawed and published results are not credible. For example, Bargh did not mention actual replication failures of his work in his book, nor did he mention that Noble Laureate Daniel Kahneman wrote him a letter in which he described Bargh’s work as “the poster child for doubts about the integrity of psychological research.” Several years later, it is fair to say that evidence is accumulating that experimental social psychology lacks scientific integrity. It is often said that science is self-correcting. Given the lack of self-correction by experimental social psychologists, it logically follows that it is not a science; at least it doesn’t behave like one.
I doubt that members of the Society for Experimental Social Psychology (SESP) will respond to this new information any differently from the way they responded to criticism of the field in the past seven years; that is, with denial, name calling (“Shameless Little Bullies”, “Method Terrorists”, “Human Scum”), or threats of legal actions. In my opinion, the biggest failure of SESP is not the way its members conducted research in the past, but their response to valid scientific criticism of their work. As Karl Popper pointed out “True ignorance is not the absence of knowledge, but the refusal to acquire it.” Ironically, the unwillingness of experimental social psychologists to acquire inconvenient self-knowledge provides some of the strongest evidence for biases and motivated reasoning in human information processing. If only these biases could be studied in BS experiments with experimental social psychologists as participants.
Caution
The abysmal results for experimental social psychology should not be generalized to all areas of psychology. The OSC (2015) report examined the replicability of psychology, and found that cognitive studies replicated much better than experimental social psychology results. Motyl et al. (2017) found evidence that correlational results in social and personality psychology are more replicable than BS-ESP results.
It is also not fair to treat all experimental social psychologists alike. Some experimental social psychologists may have used the scientific method correctly and published credible results. The problem is to know which results are credible and which results are not. Fortunately, studies with stronger evidence (lower p-values or higher z-score) are more likely to be true. In actual replication attempts, studies with z-scores greater than 4 had an 80% chance to be successfully replicated (OSC, 2015). I provided a brief description of results that met this criterion in Motyl et al.’s dataset in the Appendix. However, it is impossible to distinguish honest results with weak evidence from results that were manipulated to show significance. Thus, over 50 years of experimental social psychology have produced many interesting ideas without empirical evidence for most of them. Sadly, even today articles are published that are no more credible than those published 10 years ago. If there can be failed sciences, experimental social psychology is one of them. Maybe it is time to create a new society for social psychologists who respect the scientific method. I suggest calling it Society of Ethical Social Psychologists (SESP), and that it adopts the ethics code of the American Physical Society (APS).
Fabrication of data or selective reporting of data with the intent to mislead or deceive is an egregious departure from the expected norms of scientific conduct, as is the theft of data or research results from others.
APPENDIX
Journal of Experimental Social Psychology
Klein, W. M. (2003). Effects of objective feedback and “single other” or “average other” social comparison feedback on performance judgments and helping behavior. Personality and Social Psychology Bulletin, 29(3), 418-429.
| Df1 |
Df2 |
N |
F-value |
| 1 |
44 |
48 |
21.71 |
In this study, participants have a choice to give easy or difficult hints to a confederate after performing on a different task. The strong result shows an interaction effect between performance feedback and the way participants are rewarded for their performance. When their reward is contingent on the performance of the other students, participants gave easier hints after they received positive feedback and harder hints after they received negative feedback.
Phillips, K. W. (2003). The effects of categorically based expectations on minority influence: The importance of congruence. Personality and Social Psychology Bulletin, 29(1), 3-13.
This strong effect shows that participants were surprised when an in-group member disagreed with their opinion in a hypothetical scenario in which they made decisions with an in-group and an out-group member, z = 8.67.
Seta, J. J., Seta, C. E., & McElroy, T. (2003). Attributional biases in the service of stereotype maintenance: A schema-maintenance through compensation analysis. Personality and Social Psychology Bulletin, 29(2), 151-163.
The strong effect in Study 1 reflects different attributions of a minister’s willingness to volunteer for a charitable event. Participants assumed that the motives were more selfish and different from motives of other ministers if they were told that the minister molested a young boy and sold heroin to a teenager. These effects were qualified by a Target Identity × Inconsistency interaction, F(1, 101) = 39.80, p < .001. This interaction was interpreted via planned comparisons. As expected, participants who read about the aberrant behaviors of the minister attributed his generosity in volunteering to the dimension that was more inconsistent with the dispositional attribution of ministers—impressing others (M = 2.26)—in contrast to the same target control participants (M= 4.62), F(1, 101) = 34.06, p < .01.
Trope, Y., Gervey, B., & Bolger, N. (2003). The role of perceived control in overcoming defensive self-evaluation. Journal of Experimental Social Psychology, 39(5), 407-419.
Study 2 manipulated perceptions of changeability of attributes and valence of feedback. A third factor were self-reported abilities. The 2 way interaction showed that participants were more interested in feedback about weaknesses when attributes were perceived as changeable, z = 4.74. However, the critical test was the three-way interaction with self-perceived abilities, which was weaker and not a fully experimental design, F(1, 176) = 6.34, z = 2.24.
Brambilla, M., Sacchi, S., Pagliaro, S., & Ellemers, N. (2013). Morality and intergroup relations: Threats to safety and group image predict the desire to interact with outgroup and ingroup members. Journal of Experimental Social Psychology, 49(5), 811-821.
| 89.02 |
1 |
78 |
83 |
89.02 |
| 42.76 |
1 |
99 |
108 |
42.76 |
| 134.67 |
1 |
156 |
165 |
134.67 |
Three strong results come from this study of morality (zs > 5). In hypothetical scenarios, participants were presented with moral and immoral targets and asked about their behavioral intentions how they would interact with them. All studies showed that participants were less willing to engage with immoral targets. Other characteristics that were manipulated had no effect.
Mason, M. F., Lee, A. J., Wiley, E. A., & Ames, D. R. (2013). Precise offers are potent anchors: Conciliatory counteroffers and attributions of knowledge in negotiations. Journal of Experimental Social Psychology, 49(4), 759-763.
This study showed that recipients of a rounded offer make larger adjustments to the offer than recipients of more precise offers, z = 4.15. This effect was demonstrated in several studies. This is the strongest evidence, in part, because the sample size was the largest. So, if you put your house up for sale, you may suggest a sales price of $491,307 rather than $500,000 to get a higher counteroffer.
Pica, G., Pierro, A., Bélanger, J. J., & Kruglanski, A. W. (2013). The Motivational Dynamics of Retrieval-Induced Forgetting A Test of Cognitive Energetics Theory. Personality and Social Psychology Bulletin, 39(11), 1530-1541.
The strong effect for this analysis is a within-subject main effect. The critical effect was a mixed design three-way interaction. This effect was weaker. “.05). Of greatest importance, the three-way interaction between retrieval-practice repetition, need for closure, and OSPAN was significant, β = −.24, t = −2.25, p < .05.”
Preston, J. L., & Ritter, R. S. (2013). Different effects of religion and God on prosociality with the ingroup and outgroup. Personality and Social Psychology Bulletin, ###.
This strong effect, z = 4.59, showed that participants thought a religious leader would want them to help a family that belongs to their religious group, whereas God would want them to help a family that does not belong to the religious group (cf. These values were analyzed by one-way ANOVA on Condition (God/Leader), F(1, 113) = 23.22, p < .001, partial η2= .17. People expected the religious leader would want them to help the religious ingroup family (M = 6.71, SD = 2.67), whereas they expected God would want them to help the outgroup family (M = 4.39, SD = 2.48)). I find the dissociation between God and religious leaders interesting. The strength of the effect makes me belief that this is a replicable finding.
Sinaceur, M., Adam, H., Van Kleef, G. A., & Galinsky, A. D. (2013). The advantages of being unpredictable: How emotional inconsistency extracts concessions in negotiation. Journal of Experimental Social Psychology, 49(3), 498-508.
Study 2 produced a notable effect of manipulating emotional inconsistency on self-ratings of “sense of unpredictability” (z = 4.88). However, the key dependent variable was concession making. The effect on concession making was not as strong, F(1, 151) = 7.29, z = 2.66.
Newheiser, A. K., & Barreto, M. (2014). Hidden costs of hiding stigma: Ironic interpersonal consequences of concealing a stigmatized identity in social interactions. Journal of Experimental Social Psychology, 52, 58-70.
Participants in this study were either told to reveal their major of study or to falsely report that they are medical students. The strong effect shows that participants who were told to lie reported feeling less authentic, z = 4.51. The effect on a second dependent variable, “belonging” (I feel accepted) was weaker, t(54) = 2.54, z = 2.20.
PERSONALITY AND SOCIAL PSYCHOLOGY BULLETIN
Simon, B., & Stürmer, S. (2003). Respect for group members: Intragroup determinants of collective identification and group-serving behavior. Personality and Social Psychology Bulletin, 29(2), 183-193.
The strong effect in this study shows a main effect of respectful vs. disrespectful feedback from a group-member on collective self-esteem; that is, feeling good about being part of the group. As predicted, a 2 x2 ANOVA revealed that collective identification (averaged over all 12 items; Cronbach’s = .84) was stronger in the respectful-treatment condition than in the disrespectful-treatment condition,M(RESP) = 3.54,M(DISRESP) = 2.59, F(1, 159) = 48.75, p < .001.
Craig, M. A., & Richeson, J. A. (2014). More diverse yet less tolerant? How the increasingly diverse racial landscape affects white Americans’ racial attitudes. Personality and Social Psychology Bulletin, 40(6) 750–761.
| 1 |
13 |
30 |
41.60 |
| 1 |
13 |
15 |
36.00 |
Two strong effects are based on studies that aimed to manipulate responses to the race IAT with stories about shifting demographics in the United States. However, the test statistics are based on the comparison of IAT scores against a value of zero and not the comparison of the experimental group and the control group. The relevant results are, t(26) = 2.07, p = .048, d = 0.84 in Study 2a and t(23) = 2.80, p = .01, d = 1.13 in Study 2b. These results are highly questionable because it is unlikely to obtain just significant results in a pair of studies. In addition, the key finding in Study 1 is also just significant, t(84) = 2.29, p = .025, as is the finding in Study 3, F(1,366) = 5.94, p = .015.
Hung, I. W., & Wyer, R. S. (2014). Effects of self-relevant perspective-taking on the impact of persuasive appeals. Personality and Social Psychology Bulletin, 40(3), 402-414.
Participants viewed a donation appeal from a charity called Pangaea. The one-page appeal described the problem of child trafficking and was either self-referential or impersonal. The strong effect was that participants in the self-referential condition were more likely to imagine themselves in the situation of the child. Participants were more likely to imagine themselves being trafficked when the appeal was self-referential than when it was impersonal (M = 4.78, SD =2.95 vs. M = 3.26, SD = 2.96 respectively), F(1, 288) = 17.42, p < .01, ω2 = .041, and this difference did not depend on the victims’ ethnicity (F < 1). Thus, taking the victims’ perspective influenced participants’ tendency to imagine themselves being trafficked without thinking about their actual similarity to the victims that were portrayed. The effect on self-reported likelihood of helping was weaker. Participants reported greater urge to help when the appeal encouraged them to take the protagonists’ perspective than when it did not (M = 5.83, SD = 2.04 vs. M = 5.18, SD = 2.31), F(1, 288) = 5.68, p < .02, ω2 = .013
Lick, D. J., & Johnson, K. L. (2014).” You Can’tTell Just by Looking!” Beliefs in the Diagnosticity of Visual Cues Explain Response Biases in Social Categorization. Personality and Social Psychology Bulletin,
The main effect of social category dimension was significant, F(1, 164) = 47.30, p < .001, indicating that participants made more stigmatizing categorizations in the sex condition (M = 15.94, SD = 0.45) relative to the religion condition (M = 12.42, SD = 4.64). This result merely shows that participants were more likely to indicate that a woman is a woman than that an atheist is an atheist based on a photograph of a person. This finding would be expected based on the greater visibility of gender than religion.
Bastian, B., Jetten, J., Chen, H., Radke, H. R., Harding, J. F., & Fasoli, F. (2013). Losing our humanity the self-dehumanizing consequences of social ostracism. Personality and Social Psychology Bulletin, 39(2), 156-169.
The strong effect in this study reveals that participants rated ostracizing somebody more immoral than a typical everyday interaction. An ANOVA, with condition as the between-subjects variable, revealed that condition had an effect on perceived immorality, F(1, 51) = 39.77, p < .001, η2 = .44, indicating that participants felt the act of ostracizing another person was more immoral (M = 3.83, SD = 1.80) compared with having an everyday interaction (M = 1.37, SD = 0.81).
PSYCHOLOGICAL SCIENCE
Kifer, Y., Heller, D., Perunovic, W. Q. E., & Galinsky, A. D. (2013). The good life of the powerful the experience of power and authenticity enhances subjective well-being. Psychological science, 24(3), 280-288.
This strong effect is a manipulation check. The focal test provides much weaker evidence for the claim that authenticity increases wellbeing. The manipulation was successful. Participants in the high-authenticity condition (M = 4.57, SD = 0.62) reported feeling more authentic than those in the low-authenticity condition (M = 2.70, SD = 0.74), t(130) = 15.67, p < .01, d = 2.73. As predicted, participants in the high-authenticity condition (M = 0.38, SD = 1.99) reported higher levels of state SWB than those in the low-authenticity condition (M = −0.46, SD = 2.12), t(130) = 2.35, p < .05, d = 0.40.
Lerner, J. S., Li, Y., & Weber, E. U. (2012). The financial costs of sadness. Psychological science, 24(1) 72–79.
Again, the strong effect is a manipulation check. The emotion-induction procedure was effective in both magnitude and specificity. Participants in the sad-state condition reported feeling more sadness (M = 3.72) than neutrality (M = 1.66), t(78) = 6.72, p < .0001. The critical test that sadness leads to financial losses produced a just significant result. Sad participants were more impatient (mean = .21, median = .04) than neutral participants (mean = .28, median = .19; Mann- Whitney z = 2.04, p = .04).
Tang, S., Shepherd, S., & Kay, A. C. (2014). Do Difficult Decisions Motivate Belief in Fate? A Test in the Context of the 2012 US Presidential Election. 25(4), 1046-1048.
A manipulation check confirmed that participants in the similar-candidates condition saw the candidates as more similar (M = 4.41, SD = 0.80) than did participants in the different-candidates condition (M = 3.24, SD = 0.76), t(180) = 10.14, p < .001. The critical test was not statistically significant. As predicted, participants in the similar-candidates condition reported greater belief in fate (M = 3.45, SD = 1.46) than did those in the different-candidates condition (M = 3.04, SD = 1.44), t(180) = 1.92, p = .057
Caruso, E. M., Van Boven, L., Chin, M., & Ward, A. (2013). The temporal Doppler effect when the future feels closer than the past. Psychological science, 24(4) 530–536.
The strong effect revealed that participants view an event (Valentine’s Day) in the future closer to the present than an event in the past. Valentine’s Day was perceived to be closer 1 week before it happened than 1 week after it happened, t(321) = 4.56, p < .0001, d = 0.51 (Table 1). The effect met the criterion of z > 4 because the sample size was large, N = 323, indicating that experimental social psychology could benefit from larger samples to produce more credible results.
Galinsky, A. D., Wang, C. S., Whitson, J. A., Anicich, E. M., Hugenberg, K., & Bodenhausen, G. V. (2013). The reappropriation of stigmatizing labels the reciprocal relationship between power and self-labeling. Psychological science, 24(10)
The strong effect showed that participants rated a stigmatized group as having more power of a stigmatized label if they used the label themselves than when it was used by others. The stigmatized out-group was seen as possessing greater power over the label in the self-label condition (M = 5.14, SD = 1.52) than in the other-label condition (M = 3.42, SD = 1.76), t(233) = 8.04, p < .001, d = 1.05. The effect on evaluations of the label was weaker. The label was also seen as less negative in the self-label condition (M = 5.61, SD = 1.37) than in the other-label condition (M = 6.03, SD = 1.19), t(233) = 2.46, p = .01, d = 0.33. And the weakest evidence was provided for a mediation effect. We tested whether perceptions of the stigmatized group’s power mediated the link between self-labeling and stigma attenuation. The bootstrap analysis was significant, 95% bias-corrected CI = [−0.41, −0.01]. A value of 0 rather than -0.01 would render this finding non-significant. The t-value for this analysis can be approximated by dividing the mean of the confidence boundaries (-.42/2 = -.21), by an estimate of sampling error (-.21- (-0.01) = -.20 / 2 = -.10). The ratio is an estimate of the signal to noise ratio (-.21 / -.10 = 2.1). With N = 235 this t-value is similar to the z-score and the effect can be considered just significant. This result is consistent with the weak evidence in the other 7 studies in this article.
JOURNAL OF PERSONALITY AND SOCIAL PSYCHOLOGY-Attitudes and Social Cognition
[This journal published Bem’s (2011) alleged evidence in support of extrasensory perceptions]
Ruder, M., & Bless, H. (2003). Mood and the reliance on the ease of retrieval heuristic. Journal of Personality and Social Psychology, 85(1), 20.
The strong effect in this study is based on a contrast analysis for the happy condition. Supporting the first central hypothesis, happy participants responded faster than sad participants (M = 9.81 s vs. M = 14.17 s), F(1, 59) = 23.46, p < .01. The results of the 2 x 2 ANOVA analysis are reported subsequently. The differential impact of number of arguments on happy versus sad participants is reflected in a marginally significant interaction, F(1, 59) = 3.59, p = .06.
Fazio, R. H., Eiser, J. R., & Shook, N. J. (2004). Attitude formation through exploration: valence asymmetries. Journal of personality and social psychology, 87(3), 293.
The strong effect in this study reveals that participants approached stimuli that they were told were rewarding. When they learned by experience that this was not the case, they stopped approaching them. However, when they were told that stimuli were bad, they avoided them and were not able to learn that the initial information was wrong. This resulted in an interaction effect for prior (true or false) and actual information. More important, the predicted interaction was highly significant as well, F(1, 71) =18.65, p< .001.
Pierro, A., Mannetti, L., Kruglanski, A. W., & Sleeth-Keppler, D. (2004). Relevance override: on the reduced impact of” cues” under high-motivation conditions of persuasion studies. Journal of Personality and Social Psychology, 86(2), 251.
The strong effect in this study is based on a contrast effect following an interaction effect. Consistent with our hypothesis, the first informational set exerted a stronger attitudinal impact in the low accountability condition, simple F(1, 42) = 19.85, p < .001, M = (positive) 1.79 versus M (negative) = -.15. The pertinent two-way interaction effect was not as strong. The interaction between accountability and valence of first informational set was significant, F(1, 84) = 5.79, p = .018. For study 2, an effect of F(1,43) = 18.66 was used, but the authors emphasized the importance of the four-way interaction. Of greater theoretical interest was the four-way interaction between our independent variables, F(1, 180) = 3.922, p = .049. For Study 3, an effect of F(1,48) = 18.55 was recorded, but the authors emphasize the importance of the four-way interaction, which was not statistically significant. Of greater theoretical interest is the four-way interaction between our independent variables, F(1, 176) = 3.261, p = .073.
Clark, C. J., Luguri, J. B., Ditto, P. H., Knobe, J., Shariff, A. F., & Baumeister, R. F. (2014). Free to punish: A motivated account of free will belief. Journal of personality and social psychology, 106(4), 501.
The strong effect in this study by my prolific friend Roy Baumeister is due to the finding that participants want to punish a robber more than an aluminum can forager. Participants also wanted to punish the robber (M _ 4.98, SD =1.07) more than the aluminum can forager (M = 1.96, SD = 1.05), t(93) = 13.87, p = .001. Less impressive is the evidence that beliefs about free will are influenced by reading about a robber or an aluminum can forager. Participants believed significantly more in free will after reading about the robber (M = 3.68, SD = 0.70) than the aluminum can forager (M _ 3.38, SD _ 0.62), t(90) = 2.23, p = .029, d = 0.47.
Yan, D. (2014). Future events are far away: Exploring the distance-on-distance effect. Journal of Personality and Social Psychology, 106(4), 514.
This strong effect reflects an effect of a construal level manipulation (thinking in abstract or concrete terms) on temporal distance judgments. The results of a 2 x 2 ANOVA on this index revealed a significant main effect of the construal level manipulation only, F(1, 118) = 23.70, p < .001. Consistent with the present prediction, participants in the superordinate condition (M = 1.81) indicated a higher temporal distance than those in the subordinate condition (M = 1.58).