Authors: Ulrich Schimmack & Yue Chen
“Any man whose errors take ten years to correct is quite a man.” (J. Robert Oppenheimer)
More than a century ago, Charles Darwin proposed that facial expressions of emotions not only communicate emotional experiences to others, but play an integral role in the experience of emotions themselves (Darwin, 1872). This hypothesis later became known as the facial feedback hypothesis.
Nearly a century later, a review article concluded that empirical evidence for the facial feedback hypothesis was inconclusive and suffered from some methodological problems (Ross, 1980). Most important, positive results may have been due to demand effects. That is, participants may have been aware that the manipulation of their facial muscles was intended to induce a specific emotion and respond accordingly.
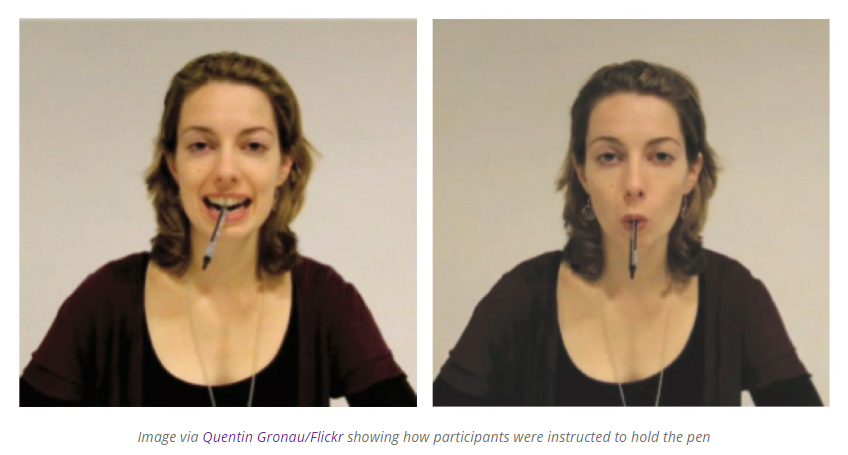
Strack, Martin, and Stepper (1988) invented the pen-in–mouth-paradigm to overcome these limitations of prior studies. In this paradigm, participants are instructed to hold a pen in their mouth either with their lips or with their teeth. Holding the pen with the teeth is supposed to activate the muscles involved in smiling (zygomaticus major). Holding the pen with the lips prevents smiling. To ensure that participants are not aware of the purpose of the manipulation, the study is conducted as a between-subject study with participants being randomly assigned to either the teeth or the lips condition. Furthermore, they are given a cover story for holding the pen in the mouth.
“The study you are participating in has to do with psychomotoric coordination. More specifically, we are interested in people’s ability to perform various tasks with parts of their body that they would normally not use for such tasks…The tasks we would like you to perform are actually part of a pilot study for a more complicated experiment we are planning to do next semester to better understand this substitution process.” (p. 770).
In Study 1, participants were shown several cartoons and asked to rate how funny each cartoon was. According to FFH, inducing smiling by holding a pen with teeth should induce amusement and amplify the funniness of cartoons. The average rating of funniness was consistent with this prediction (teeth M = 5.14 vs. lips M = 4.33 on a 0 to 9 scale). A second study replicated the pen-in-mouth paradigm with amusement ratings as the dependent variable (M = 6.43 vs. 5.40).
Strack et al.’s article has been widely cited as conclusive evidence for FFH (cf. Wagenmakers et al., 2016) and the article has been featured prominently in textbooks (cf. Coles & Larsen, 2017) and popular psychology books (cf. Schimmack, 2017). However, in 2011 psychologists encountered a crisis of confidence after some classic findings could not be replicated and Nobel Laureate Daniel Kahneman asked for replications of classic studies (Kahneman, 2012).
Wagenmakers et al. (2016) answered this call using the newly established format of a Registered Replication Report (Simons & Holcombe, 2014). In this format, original authors, replication authors, and editors work together to design the replication study and the original study is replicated across several labs. Wagenmakers et al. (2016) reported the results of 17 preregistered replications of Strack et al.’s Study 1. The minimum sample size for each study was N = 50. Actual sample sizes ranged from N = 87 to 139. These sample sizes do not provide sufficient statistical power to replicate the effect in each study. However, a meta-analysis of all 17 studies ensures a high probability of replicating the original finding even with a statistically small effect size. Nevertheless, the replication study failed to provide evidence for FFH.
Some psychologists interpreted these results as challenging Darwin’s century old hypothesis that facial expressions play an important role in emotional experiences. After all, results based on the best test of the theory that were widely used to support FFH could not be replicated. However, some psychologists raised concerns about the replication study. Reber (2016) compared psychology to chemistry. For an experiment in chemistry to work as predicted, chemists need to use pure chemicals. Even small impurities may cause failures to demonstrate chemical processes. Reber suggested that the replication failure of the FFH could have been caused by “impurities” in the replication study. This line of argumentation is dangerous because it can lead to circular reasoning. That is, if a study provides evidence for a theoretically predicted effect, the study was pure, but if a study fails to provide evidence for the effect, the study was impure. Accordingly, a theoretical prediction can never be falsified.
It is also possible to question the results of the original study. Schimmack (2017) pointed out that both studies failed to reach the standard criterion of statistical significance in a two-tailed test and were only significant in a one-tailed test. These results are often called marginally significant. Two marginally significant results are suggestive, but do not provide conclusive evidence for an effect. Thus, these results were prematurely accepted as evidence for FFH, when additional evidence was needed.
It would be surprising if nobody had ever tried to replicate the pen-in-mouth paradigm given its prominence and theoretical importance. In fact, numerous published articles have used the paradigm to replicate and extend the original findings (see Appendix). We conducted a replicability analysis of studies that used the pen-in-mouth paradigm prior to the controversial registered replication report. If previous studies consistently found evidence for FFH, it suggests that the replication report studies were impure. However, if previous studies also had difficulties demonstrating the effect, it suggests that the pen-in-mouth paradigm does not reliably produce facial feedback effects.
Replicability Analysis
A replicabiliy analysis differs from conventional meta-analyses in two ways. First, the goal of a replicability analysis is not to estimate an effect size. Instead, the goal is to estimate the average replicability of a set of studies, where replicability is defined as the probability of obtaining a statistically significant result (Schimmack, 2014). Second, a replicability analysis examines whether a set of studies shows signs of publication bias by comparing the percentage of significant results to the average statistical power of studies. In an unbiased set of studies, the success rate should match median observed power. However, if publication bias is present, the success rate is higher than median observed power justifies (Schimmack, 2012, 2014).
Median observed power is only an estimate of average power and the estimate is imprecise with small sets of studies. However, precision increases as the number of studies increases. For this replicability analysis, we conducted a cumulative replicability analysis where studies are added in chronological order. The cummulative analysis shows how strong the evidence for FFH was in the beginning and how it changed over time.
We used three search strategies to retrieve original articles that used the pen-in-mouth paradigm. First, we conducted full text searchers of social psychology journals looking for the word pen. Second, we searched for articles that cited Strack et al.’s seminal study that introduced the pen-in-mouth paradigm. Third, articles that were found using the first two strategies were searched for references to additional studies. We fond 12 published articles with 19 independent studies that used the pen-in-mouth paradigm, including the original pair of studies.
For each independent study, we converted reported test statistics into a z-score as a standardized measure of the strength of evidence for FFH. If the means were not in the predicted direction, the z-scores were negative. We then computed observed power with z = 1.96 (p < .05, two-tailed) as criterion, unless the authors interpreted a marginally significant result as evidence for FFH; in this case, we used z = 1.65 as criterion for significance. The formula to convert z-scores into observed power is simply
1-pnorm(criterion.z,obs.z); obs.z = observed z-score; criterion.z = 1.96 or 1.65
The outcome of each study is dichotomous with 0 = not significant and 1 = significant. Averaging this outcome across studies yields the success rate.
We then compute an inflation index as the difference between the success rate and median observed power. In the long run, these two values should be equivalent if there is no publication bias. If there is publication bias, the inflation index is positive and reflects the amount of publication bias.
Finally, I computed the Replicability Index (R-Index; Schimmack, 2014). As publication bias also inflates median observed power, we subtracted the inflation index from median observed power. The result is called the R-Index. An R-Index of 50% or less suggests that it would be difficult to replicate a finding with the typical sample sizes in the set of studies.
Results
Table 1 shows the results. The original studies were both successful with the weaker criterion value of z = 1.65 that was used by the authors. However, both studies barely met this criterion which leads to a high inflation index and a low replicability index. As predicted by the low R-Index, the next study produced a non-significant result which brought the success rate more in line with median observed power. However, the next three studies also failed to demonstrate the effect and median observed power dropped to .07. From study 9 till study 19, median observed power stays at this level, while the success rate remains above 30%, indicating the influence of publication bias.
For the total set of 19 studies, the probability of obtaining more than 53% (10 / 19) non-significant results with a 1-.07 = 93% probability of this outcome is greater than 99.99% (Schimmack, 2012). Thus, there is strong evidence of publication bias, even though the estimated median power is only 7%. Combining the very low estimate of median power with a positive inflation index yields a negative R-Index. Thus, it is not surprising that a set of studies without publication bias failed to replicate the original effect. This finding is entirely consistent with the cumulative evidence from previous studies, once publication bias is taken into account. In fact, the cumulative analysis shows that there was never convincing evidence for the effect (R-Index < 50).
| No. |
Year |
A# |
S# |
z |
OP |
Sig. |
MOP |
SR |
Inf. |
R-Index |
| 1 |
1988 |
1 |
1 |
1.83 |
0.57 |
1 |
0.57 |
1.00 |
0.43 |
0.14 |
| 2 |
1988 |
1 |
2 |
1.76 |
0.54 |
1 |
0.56 |
1.00 |
0.44 |
0.12 |
| 3 |
2002 |
2 |
1 |
0.52 |
0.07 |
0 |
0.54 |
0.67 |
0.12 |
0.42 |
| 4 |
2006 |
3 |
1 |
< 1 |
0.07 |
0 |
0.31 |
0.50 |
0.19 |
0.12 |
| 5 |
2006 |
3 |
2 |
-2.38 |
0.00 |
0 |
0.07 |
0.40 |
0.33 |
-0.25 |
| 6 |
2008 |
4 |
1 |
-1.17 |
0.00 |
0 |
0.07 |
0.33 |
0.26 |
-0.19 |
| 7 |
2009 |
5 |
1 |
2.18 |
0.59 |
1 |
0.07 |
0.43 |
0.35 |
-0.28 |
| 8 |
2012 |
6 |
1 |
2.29 |
0.63 |
1 |
0.31 |
0.50 |
0.19 |
0.12 |
| 9 |
2013 |
7 |
1 |
0.17 |
0.04 |
0 |
0.07 |
0.44 |
0.37 |
-0.29 |
| 10 |
2013 |
8 |
1 |
< 1 |
0.07 |
0 |
0.07 |
0.40 |
0.33 |
-0.25 |
| 11 |
2013 |
8 |
2 |
< 1 |
0.07 |
0 |
0.07 |
0.36 |
0.29 |
-0.22 |
| 12 |
2013 |
8 |
3 |
< 1 |
0.07 |
0 |
0.07 |
0.33 |
0.26 |
-0.19 |
| 13 |
2013 |
8 |
4 |
< 1 |
0.07 |
0 |
0.07 |
0.31 |
0.24 |
-0.16 |
| 14 |
2013 |
8 |
5 |
2.18 |
0.59 |
1 |
0.07 |
0.36 |
0.28 |
-0.21 |
| 15 |
2013 |
8 |
6 |
2.96 |
0.84 |
1 |
0.07 |
0.40 |
0.33 |
-0.26 |
| 16 |
2014 |
9 |
1 |
1.90 |
0.60 |
1 |
0.07 |
0.44 |
0.36 |
-0.29 |
| 17 |
2014 |
10 |
1 |
2.43 |
0.68 |
1 |
0.07 |
0.47 |
0.40 |
-0.32 |
| 18 |
2015 |
11 |
1 |
0.25 |
0.04 |
0 |
0.07 |
0.44 |
0.37 |
-0.30 |
| 19 |
2016 |
12 |
1 |
2.34 |
0.65 |
1 |
0.07 |
0.47 |
0.40 |
-0.32 |
Note. No. = Number of Study in Chronological Order, Year = Year, A# Article Number (see Appendix), S# Study Number in Article, z = strength of evidence for or against FFH, OP = observed power, Sig = Significant (0 = No, 1 = Yes), MOP = Median Observed Power, SR = Success Rate, Inf. = Inflation, R-Index = Replicability Index (MOP – Inf).
Conclusion
Darwin was a great scientist. Since he published his influential theory of evolution in 1859, biology has made tremendous progress in understanding the process of evolution. The same cannot be said about Darwin’s theory of emotion. More than hundred years later, psychologists are still debating the influence of facial feedback on emotional experiences. One reason for the slow progress in some areas of psychology is that original studies were often accepted as conclusive evidence without rigorous replication efforts. In addition, meta-analyses provided misleading results because they failed to take publication bias into account. The present replicability analysis showed that the pen-in-mouth paradigm never provided convincing evidence for facial feedback effects. Nevertheless, the original study was often cited as evidence for facial feedback effects. To make progress like other sciences, psychology needs to take empirical studies more seriously and ensure that important findings can be replicated before they become corner stones of theories and textbook findings.
This replicability analysis is limited to the pen-in-mouth paradigm. Other paradigms may produce replicable results. However, the pen-in-mouth paradigm has been used because it addressed limitations of these paradigms such as demand effects. Thus, even if these paradigms were more successful, the underlying mechanism would be less clear. At present, the replicability analysis simply shows a lack of evidence for FFH, but it would be premature to conclude that facial feedback effects do not exist.
References
Buck, R. (1980). Nonverbal Behavior and the Theory of Emotion: The Facial
Feedback Hypothesis. Journal of Personality and Social Psychology, 38, 811-824.
Coles, N. A., & Larsen, J. T., & Lench, H. C. (2017). A meta-analysis of the facial feedback hypothesis literature. OSF-Preprint.
Darwin, C. (1872). The expression of emotions in man and animals. London: John Murray.
Kahneman, D. (2012). A proposal to deal with questions about priming effects.
Strack, F., Martin, L. L., & Stepper, S. (1988). Inhibiting and Facilitating Conditions of the Human Smile: A Nonobtrusive Test of the Facial Feedback Hypothesis. Journal of Personality and Social Psychology. 54, 768–777.
Reber, R. (2016). Impure replications.
Schimmack, U. The Ironic Effect of Significant Results on the Credibility of Multiple-Study Articles, Psychological Methods, 17, 551–566.
Schimmack, U. (2014). A revised introduction to the R-Index.
A Revised Introduction to the R-Index
Schimmack, U. (2017). Reconstruction of a Train Wreck: How Priming Research Went off the Rails. https://replicationindex.com/category/thinking-fast-and-slow/
Simons, D. J., & Holcombe, A. O. (2014). Registered Replication Reports.
Wagenmakers, EJ et al. (2016). Registered Replication Report: Strack, Martin, & Stepper (1988). Perspectives on Psychological Science, 917-928.
Appendix: Articles used for Meta-Analysis
A1. Strack, F., Martin, L. L., & Stepper, S. (1988). Inhibiting and Facilitating Conditions of the Human Smile: A Nonobtrusive Test of the Facial Feedback Hypothesis. Journal of Personality and Social Psychology. 54, 768–777.
A2. Soussignan, R. (2002). Duchenne Smile, Emotional Experience, and Autonomic Reactivity: A Test of the Facial Feedback Hypothesis. Emotion, 2, 52-74.
A3. Ito, T., Chiao, K. W., Devine, P. G., Lorig, T. S., & Cacioppo, J. T. (2006). The Influence of Facial Feedback on Race Bias. Psychological Science, 17, 256-261.
A4. Andreasson, P., & Dimberg, U. (2008). Emotional Empathy and Facial Feedback. Journal of Nonverbal Behavior, 32, 215-224.
A5. Wiswede, D., Munte, T. F., Kramer, U. M., & Russler, J. (2009). Embodied Emotion Modulates Neural Signature of Performance Monitoring. PlosOne, 4, e5754, 1-6.
A6. Kraft, T. L., & Pressman, S. D. (2012). Grin and Bear It: The Influence of Manipulated Facial Expression on the Stress Response. Psychological Science, 23, 1372-1378.
A7. Paredes, B., Stavraki, M., Briñol, P., & Petty, R. E. (2013). Social Psychology, 44, 349-353.
A8. Marmolejo-Ramos, F. & Dunn, J. (2013). On the activation of sensorimotor systems during the processing of emotionally-laden stimuli. Universitas Psychologica, 12, 1511-1542.
A9. Rummer, R., Schweppe, J., Schleelmilch, R., Grice, M. (2014). Mood Is Linked to Vowel Type: The Role of Articulatory Movements. Emotion, 14, 246-250.
A10. Dzokoto, V., Wallace, D. S., Peters, L., & Bentsi-Enchill, E. (2014). Attention to Emotion and Non-Western Faces: Revisiting the Facial Feedback Hypothesis. The Journal of General Psychology, 2014, 141(2), 151–168.
A11. Arminjon, M., Preissmann, D., Chmetz, F., Duraku, A., Ansermet, F., & Magistretti, P. J. (2015). Embodied memory: Unconscious smiling modulates emotional evaluation of episodic memories, Frontiers in Psychology, 6, 650, 1-7.
A12. Epstein, N., Brendel, T., Hege, I., Ouellette, D. L., Schmidmaier, R., & Kiesewetter, J. (2016). The power of the pen: how to make physicians more friendly and patients more attractive. Medical Education, 50, 1214–1218.