When I discovered Sterling et al.’s (1995) article, it changed my life forever. I always had the suspicion that some articles reported results that are too good to be true. I also had my fair share of experiences where I tried to replicate an important finding to build on it, but only found out that I couldn’t replicate the original finding. Already skeptical by nature, I became increasingly uncertain what findings I could actually believe. Discovering the article by Sterling et al. (1995) helped me to develop statistical tests that make it possible to distinguish credible from incredible (a.k.a., not trustworthy) results (Schimmack, 2012), the R-Index (Schimmack, 2014), and Powergraphs (Schimmack, 2015).
In this post, I give a brief summary of the main points made in Sterling et al. (1995) and then show how my method builds on their work to provide an estimate of the actual success rate in psychological laboratories.
Research studies from 11 major journals demonstrate the existence of biases that favor studies that observe effects that, on statistical evaluation, have a low probability of erroneously rejecting the so-called null hypothesis (Ho). This practice makes the probability of erroneously rejecting Ho different for the reader than for the investigator. It introduces two biases in the interpretation of the scientific literature: one due to multiple repetition of studies with false hypothesis, and one due to failure to publish smaller and less significant outcomes of tests of a true hypothesis (Sterling et al., 1995, p. 108).
The main point of the article was to demonstrate that published results are biased. Several decades earlier, Sterling (1959) observed that psychology journals nearly exclusively publish support for theoretical predictions. The 1995 article showed that nothing had changed. It also showed that medical journals were more willing to publish non-significant results. The authors pointed out that publication bias has two negative consequences on scientific progress. First, false results that were published cannot be corrected because non-significant results are not published. However, when a false effect produces another false positive it can be published and it appears as if the effect was successfully replicated. As a result, false results can accumulate and science cannot self-correct and weed out false positives. Thus, a science that publishes only significant results is like a gambler who only remembers winning nights. It appears successful, but it is bankrupting itself in the process.
The second problem is that non-significant results do not necessarily mean that an effect does not exist. It is also possible that the study had insufficient statistical power to rule out chance as an explanation. If these non-significant results were published, they could be used by future researchers to conduct more powerful studies or to conduct meta-analyses. A meta-analysis uses the evidence from many small studies to combine the information into evidence from one large study, which makes it possible to detect small effects. However, if publication bias is present, a meta-analysis will always conclude that an effect is present because significant results are more likely to be included.
Both problems are important, but for psychology the first problem appeared to be a bigger problem because it published nearly exclusively significant results. There was no mechanism for psychology to correct itself until a recent movement started to question the credibility of published results in psychology.
The authors examined how often authors reported that a critical hypothesis test confirmed a theoretical prediction. The Table shows the results for the years 1986-87 and for the year 1958. The 1958 results are based on Sterling (1959).
| Journal | 1987 | 1958 |
|---|---|---|
| Journal of Experimental Psychology | 93% | 99% |
| Comparative & Physiological Psychology | 97% | 97% |
| Consulting & Clinical Psychology | 98% | 95% |
| Personality and Social Psychology | 96% | 97% |
The authors use the term “proportion of studies rejecting H0” to refer to the percentages of studies with significant results. I call it the success rate. A researcher who plans a study to confirm a theoretical prediction has a success when the study produces a significant result. When the result is not significant, the researcher cannot claim support for the hypothesis and the study is a failure. Failure does not mean that the study was not useful and that the result should not be published. It just means that the study does not provide sufficient support for a prediction.
Sterling et al. (1995) distinguish between the proportion of published studies rejecting H0 and the proportion of all conducted studies rejecting H0. I use the terms reported success rate and actual success rate. Without publication bias, the reported success rate and the actual success rate are the same. However, when publication bias or reporting bias is present, the reported success rate exceeds the actual success rate. A gambler might win on 45% trips to the casino, but he may tell his friends that he wins 90% of the time. This discrepancy reveals a reporting bias. Similarly, a researcher may have a success rate of 40% of studies (or statistical analyses if multiple analyses are conducted with one data set), but the published studies show a 95% success rate. The difference shows the effect of reporting bias.
A reported success rate of 95% in psychology journals seems high, but it does not automatically imply that there is publication bias. To make claims about the presence of publication bias it is necessary to find out what the actual success rate of psychological researchers is. When researchers press the button on a statistics software and look up the p-value, and the result will be used for a publication, how often is this p-value below the critical .05 value. How often do researchers go “Yeah” and “Got it.” versus “S***” and move on to another significance test? [I’ve been there; I have done it.]
Sterling et al. (1995) provide a formula that can be used to predict the actual success rate of a researcher. Actually, Sterling et al. (1995) predicted the failure rate, but the formula can be easily modified to predict the success rate. I first present the original formula for the prediction of failure, but I spare readers the Greek notation.
FR = proportion of studies accepting H0
%H0 = proportion of studies where H0 is true
B = average type-II error probability (type-II error = non-significant result when H0 is false)
C = Criterion value for significance (typically p < .05, two-tailed, also called alpha)
FR = %H0 * B + (1 – %H0) * C
The corresponding formula for the success rate is
SR = %H0 * C + (1 – %H0) * (1 – B)
In this equation, (1 – B) is the average probability to obtain a significant effect when an effect is present, which is known as statistical power (P). Substituting (1 – B) with P gives the formula
SR = %H0 * C + (1 – %H0) * P
This formula says that the success rate is a function of the criterion for significance (C), the proportion of studies where the null-hypothesis is true (%H0) and the average statistical power of studies when an effect is present.
The problem with this formula is that the proportion of true null-effects is unknown or even unknowable. It is unknowable because the null-hypothesis is a point prediction of an effect size and even the smallest deviation from this point prediction invalidates H0 and H1 is true. H0 is true if the effect is exactly zero, but H1 is true if the effect is 0.00000000000000000000000000000001. And even if it were possible to demonstrate that the effect is smaller than 0.00000000000000000000000000000001, it is possible that the effect is 0.000000000000000000000000000000000000000001 and the null-hypothesis would still be false.
Fortunately, it is not necessary to know the proportion of true null-hypotheses to use Sterling et al.’s (1995) formula. Sterling et al. (1995) make the generous assumption that H0 is always false. Researchers may be wrong about the direction of a predicted effect, but the two-tailed significance tests helps to correct this false prediction by showing a significant result in the opposite direction (a one-tailed test would not be able to do this). Thus, H0 is only true when the effect size is exactly zero and it has been proposed that this is very unlikely. Eating a jelly bean a day may not have a noticeable effect on life expectancy, but can we be sure a priori that the effect is exactly 0? Maybe it extends or shortens life-expectancy by 5 seconds. This would not matter to lovers of jelly beans, but the null-hypothesis that the effect is zero would be false.
Even if the null-hypothesis is true in some cases, it is irrelevant because the assumption that it is always false is the best case scenario for a researcher, which makes the use of the formula conservative. The actual success rate can only be lower than the estimated success rate based on the assumption that all null-hypotheses are false. With this assumption, the formula is reduced to
SR = P
This means that the actual success rate is a function of the average power of studies. The formula also implies that an unbiased sample of studies provides an estimate of the average power of studies.
P = SR
Sterling et al. (1995) contemplate what a 95% success rate would mean if no publication bias were present.
“If we take this formula at face value, it suggests that only studies with high power are performed and that the investigators formulate only true hypothesis.”
In other words, a 95% success rate in the journals can only occur if the null-hypothesis is false and researchers conduct studies with 95% power or if the null-hypothesis is true in 5% of the studies and true power is 100%.”
Most readers are likely to agree with Sterling et al. (1995) that “common experience tells us that such is unlikely.” Thus, publication bias is most likely to contribute to the high success rate. The really interesting question is whether it is possible to (a) estimate the actual success rate and (b) estimate the extend of publication bias.
Sterling et al. (1995) use post-hoc power analysis to obtain some estimate of the actual success rate.
“Now alpha is usually .05 or less, and beta while unknown and variable, is frequently .15-.75 (Hedges 1984). For example, if beta = .05 and we take B = .2 as a conservative estimate, then the proportion of studies that should accept Ho is .95-.75 percent. Thus even if the null hypothesis is always false , we would expect about 20% of published studies to be unable to reject Ho.”
To translate, even with a conservative estimate that the type-II error rate is 20% (i.e., average power is 80%), 20% of published studies should report a non-significant result. Thus, the 95% reported success rate is inflated by publication bias by at least 15%.”
One limitation of Sterling et al.’s (1995) article is that they do not provide a more precise estimate of the actual success rate.
There are essentially three methods to obtain estimates of the actual success rate. One could conduct a survey of researchers and ask them to report how often they obtain significant results in statistical analyses that are conducted for the purpose of publication. Nobody has tried to use this approach. I only heard some informal rumor that a psychologist compared his success rate to batting averages in baseball and was proud of a 33% success rate (a 33% batting average is a good average for hitting a small ball that comes at you at over 80mph).
The second approach would be to take a representative sample of theoretically relevant statistical tests (i.e., excluding statistical tests of manipulation checks or covariates) from published articles and to replicate these studies as closely as possible. The success rate in the replication studies provides an estimate of the actual success rate in psychology because the replication studies do not suffer from publication bias.
This approach was taken by the Open Science Collaboration (2015), although with a slight modification. The replication studies tried to replicate the original studies as closely as possible, but sample sizes differed from the original studies. As sample size has an influence on power, the success rate in the replication studies is not directly comparable to the actual success rate of the original studies. However, sample sizes were often increased and they were usually only decreased if the original study appeared to have very high power. As a result, the average power of the replication studies was higher than the average power of the original studies and the result can be considered an optimistic estimate of the actual success rate.
The study produced a success rate of 35% (95%CI = 25% to 45%). The study also showed different success rates for cognitive psychology (SR = 50%, 95%CI = 35% to 65%) and social psychology (SR = 25%, 95%CI = 14% to 36%).
The actual replication approach has a number of strength and weaknesses. The strength is that actual replications do not only estimate the actual success rate in original studies, but also test how robust these results are when an experiment is repeated. A replication study is never an exact replication study of the original study, but a study that reproduces the core aspects of the original study should be able to reproduce the same result. A weakness of actual replication studies is that they may have failed to reproduce core aspects of the original experiment. Thus, it is possible to attribute non-significant results to problems with the replication study. If 20% of the replication studies suffered from this problem, the actual success rate in psychology would increase from 36% to 45%. The problem with this adjustment is that the adjustment is arbitrary because it is impossible to know whether a replication study successfully reproduced the core aspects of an original experiment or not and using significant results as the criterion would lead to a circular argument; a replication was successful only if it produced a significant result, which would lead to the absurd implication that only the 36% of replications that produced significant results were good replications and the actual success rate is back to 100%.
A third approach is to use the results of the original article to estimate the actual success rate. The advantage of this method is that it uses the very same results that were used to report a 97% success rate. Thus, no mistakes in data collection can explain discrepancies. The problem is to find a statistical method to correct for publication bias. There have been a number of attempts to correct for publication bias in meta-analyses of a set of studies (see Schimmack, 2014, for a review). However, a shared limitation of these methods is that they assume that all studies have the same power or effect size. This assumption is obviously violated when the set of studies spans different designs and disciplines.
Brunner and Schimmack (forthcoming) developed a method that can estimate the average power for a heterogeneous set of results while controlling for publication bias. The method first transforms the reported statistical result into an absolute z-score. This z-score represents the strength of evidence against the null-hypothesis. If non-significant results are reported, they are excluded from the analysis because publication bias makes the reporting of non-significant results unreliable. In the OSF-repoducibility project nearly all reported results were significant and two were marginally significant. Therefore this step is irrelevant. The next step is to reproduce the observed distribution of significant z-scores as a function of several non-centrality parameters and weights. The non-centrality parameters are then converted into power and the weighted average of power is the estimate of the actual average power of studies.
In this method the distinction between true null hypothesis and true effects is irrelevant because true null effects cannot be distinguished from studies with very low power to detect small effects. As a result, the success rate is equivalent to the average power estimate. The figure below shows the distribution of z-scores for the replicated studies (on the right side).
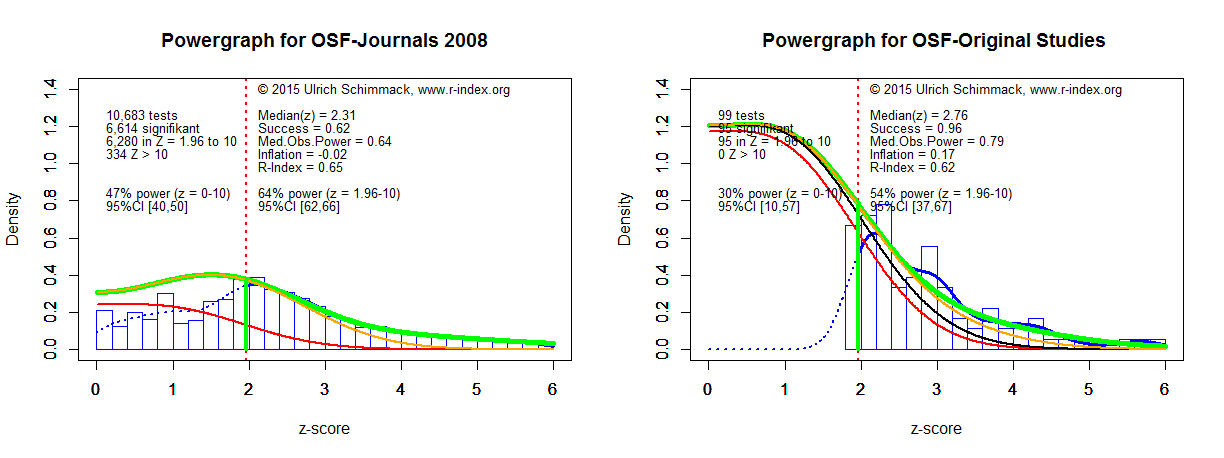
The estimated actual success rate is 54%. A 95% confidence interval is obtained by running 500 bootstrap analyses. The 95%CI ranges from 37% to 67%. This confidence interval overlaps with the confidence interval for the success rate in the replication studies of the reproducibility project. Thus, the two methods produce convergent evidence that the actual success rate in psychological laboratories is somewhere between 30% and 60%. This estimate is also consistent with post-hoc power analyses for moderate effect sizes (Cohen, 1962).
It is important to note that this success rate only applies to statistical tests that are included in publication when these tests produce a significant result. The selection of significant results also favors studies that actually had higher power and larger effect sizes, but research do not know a priori how much power their study has because the effect size is unknown. Thus, the power of all studies that are being conducted is even lower than the power estimated for the studies that produced significant results and were published. The powergraph analysis also estimates power for all studies, including the estimated file-drawer of non-significant results. The estimate is 30% with a 95%CI ranging from 10% to 57%.
The figure on the left addresses another problem of actual replications. A sample of 100 studies is a small sample and may not be representative because researchers focused on studies that are easy to replicate. The statistical analysis of original results does not have this problem. The figure on the left side used all statistical tests that were reported in the three target journals in 2008; the year that was used to sample studies for the reproducibility project.
Average power is in the same same ball bark, but it is 10% higher than for the sample of replication studies and the confidence interval does not overlap with the 95%CI for the success rate in the actual replication studies. There are two explanations for this discrepancy. One explanation is that the power of tests of critical conditions is lower than the power of all statistical tests that can include manipulation checks or covariates. Another explanation could be that the sample of reproduced studies was not representative. Future research may help to explain the discrepancy.
Despite some inconsistencies, these results show that different methods can provide broadly converging evidence about the actual success rate in psychological laboratories. In stark contrast to reported success rates over 90%, the actual success rate is much lower and likely to be less than 60%. Moreover, this average glosses over differences in actual success rates in cognitive and social psychology. The success rate in social psychology is likely to be less than 50%.
CONCLUSION
Reported success rates in journals provide no information about the actual success rate when researchers conduct studies because publication bias dramatically inflates reported success rates. Sterling et al. (1995) showed that actual success rate is equivalent to the power of studies when the null-hypothesis is always false. As a result, the success rate in an unbiased set of studies is an estimate of average power and average power after correcting for publication bias is an estimate of the actual success rate before publication bias. The OSF-reproducibilty project obtained an actual success rate of 36%. A bias-corrected estimate of average power of the original studies produced an estimate of 54%. Given the small sample size of 100 studies, the confidence intervals overlap and both methods provide converging evidence that the actual success rate in psychology laboratories is much lower than reported success rate. The ability to estimate actual success rates from published results makes it possible to measure reporting bias, which may help to reduce it.
5 thoughts on “Reported Success Rates, Actual Success Rates, and Publication Bias In Psychology: Honoring Sterling et al. (1995)”