One major contribution to the growing awareness that psychological research is often unreliable was an article by Daryl Bem (2011), which reported nine barely statistically significant results to support the existence of extrasensory perception—most memorably, that extraverts could predict the future location of erotic images (“pornception”).
Subsequent replication attempts quickly failed to reproduce these findings (Galak et al., 2012). This outcome was not especially newsworthy; few researchers believed the substantive claim. The more consequential question was how seemingly strong statistical evidence could be produced for a false conclusion.
Under the conventional criterion of p<.05, one false positive is expected by chance roughly 1 out of 20 times. However, obtaining statistically significant results in nine out of nine studies purely by chance is extraordinarily unlikely (Schimmack, 2012). This pattern strongly suggests that the data-generating process was biased toward significance.
Schimmack (2018) argued that the observed bias in Bem’s (2011) findings was best explained by questionable research practices (John et al., 2012). For example, unpromising studies may be abandoned and later characterized as pilot work, whereas more favorable results may be selectively aggregated or emphasized, increasing the likelihood of statistically significant outcomes. Following the publication of the replication failures, a retraction was requested. In response, the then editor, Shinobu Kitayama, declined to pursue retraction, citing that the practices in question were widespread in social psychology at the time and were not treated as clear violations of prevailing norms (Kitayama, 2018).
After more than a decade of methodological debate and reform, ignorance is no longer a credible defense for the continued use of questionable research practices. This is especially true when articles invoke open science practices—such as preregistration, transparent reporting, and data sharing—to signal credibility: these practices raise the expected standard of methodological competence and disclosure, not merely the appearance of rigor.
Nevertheless, there are growing concerns that preregistration alone is not sufficient to ensure valid inference. Preregistered studies can still yield misleading conclusions if auxiliary assumptions are incorrect, analytic choices are poorly justified, or deviations and contingencies are not transparently handled (Soto & Schimmack, 2025).
Against this backdrop, Francis (2024) published a statistical critique of Ongchoco, Walter-Terrill, and Scholl’s (2023) PNAS article reporting seven preregistered experiments on visual event boundaries and anchoring. Using a Test of Excess Significance (“excess success”) argument, Francis concluded that the uniformly significant pattern—particularly the repeated significant interaction effects—was unlikely under a no-bias, correctly specified model, reporting p=.011. This result does not establish the use of questionable research practices; it shows only that the observed pattern of results is improbable under the stated assumptions, though chance cannot be ruled out.
Ongchoco, Walter-Terrill, and Scholl (2024) responded by challenging both the general validity of excess-success tests and their application to a single article. In support, they cite methodological critiques—especially Simonsohn (2012, 2013)—arguing that post hoc excess-success tests can generate false alarms when applied opportunistically or when studies address heterogeneous hypotheses.
They further emphasize preregistration, complete reporting of preregistered studies, and a preregistered replication with increased sample size as reasons their results should be considered credible—thereby raising the question of whether the significant findings themselves show evidential value, independent of procedural safeguards.
The appeal to Simonsohn is particularly relevant here because Simonsohn, Nelson, and Simmons (2014) introduced p-curve as a tool for assessing whether a set of statistically significant findings contains evidential value even in the presence of selective reporting or p-hacking. P-curve examines the distribution of reported significant p-values (typically those below .05). If the underlying effect is null and significance arises only through selection, the distribution is expected to be approximately uniform across the .00–.05 range. If a real effect is present and studies have nontrivial power, the distribution should be right-skewed, with a greater concentration of very small p-values (e.g., < .01).
I therefore conducted a p-curve analysis to assess the evidential value of the statistically significant results reported in this research program. Following Simonsohn et al. (2014), I focused on the focal interaction tests bearing directly on the core claim that crossing a visual event boundary (e.g., walking through a virtual doorway) attenuates anchoring effects. Specifically, I extracted the reported p-values for the anchoring-by-boundary interaction terms across the preregistered experiments in Ongchoco, Walter-Terrill, and Scholl (2023) and evaluated whether their distribution showed the right-skew expected under genuine evidential value.
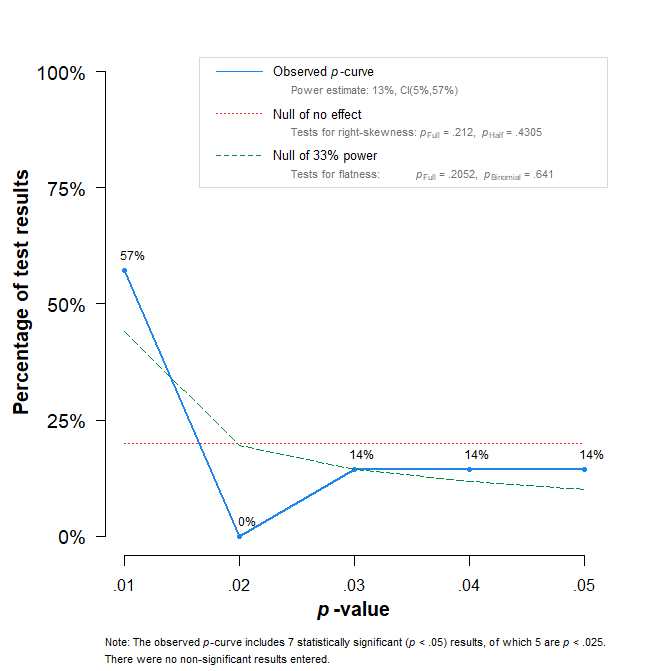
The p-curve analysis provides no evidence of evidential value for the focal interaction effects. Although all seven tests reached nominal statistical significance, the distribution of significant p-values does not show the right-skew expected when results are driven by a genuine effect. Formal tests for right-skewness were non-significant (full p-curve: p=.212; half p-curve: p=.431), indicating that the results cannot be distinguished from patterns expected under selective success or related model violations.
Consistent with this pattern, the p-curve-based estimate of average power is low (13%). Although the confidence interval is wide (5%–57%), the right-skew tests already imply failure to reject the null hypothesis of no evidential value. Moreover, even under the most generous interpretation—assuming 57% power for each test—the probability of obtaining seven statistically significant results out of seven is approximately 0.577≈.020. Thus, invoking Simonsohn’s critiques of excess-success testing is not sufficient, on its own, to restore confidence in the evidential value of the reported interaction effects.
Some criticisms of Francis’s single-article bias tests also require careful handling. A common concern is selective targeting: if a critic applies a bias test to many papers but publishes commentaries only when the test yields a small p-value, the published set of critiques will overrepresent “positive” alarms. Importantly, this publication strategy does not invalidate any particular p-value; it affects what can be inferred about the prevalence of bias findings from the published subset.
Francis (2014) applied an excess-success test to multi-study articles in Psychological Science (2009–2012) and reported that a large proportion exhibited patterns consistent with excess success (often summarized as roughly 82% of eligible multi-study articles). Under a high-prevalence view—i.e., if such model violations are common—an individual statistically significant bias-test result is less likely to be a false alarm than under a low-prevalence view. The appropriate prevalence for preregistered studies, however, remains uncertain.
Additional diagnostics help address this uncertainty. The “lucky-bounce” test (Schimmack, unpublished) illustrates the improbability of observing only marginally significant results when studies are reasonably powered. Under a conservative assumption of 80% power, the probability that all seven interaction effects fall in the “just significant” range (.005–.05) is approximately .00022. Although this heuristic test is not peer-reviewed, it highlights the same improbability identified by other methods.
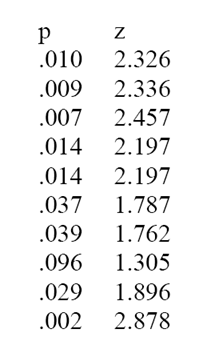
A closely related, peer-reviewed approach is the Test of Insufficient Variance (TIVA). TIVA does not rely on significance thresholds; instead, it tests whether a set of independent test statistics (expressed as z-values) exhibits at least the variance expected under a standard-normal model (Var(z)≥1). Conceptually, it is a left-tailed chi-square test on the variance of z-scores. Because heterogeneity in power or true effects typically increases variance, evidence of insufficient variance is conservative. With the large sample sizes in these studies, transforming F-values to t- and approximate z-values is reasonable. Applying TIVA to the seven interaction tests yields p=.002, indicating that the dispersion of the test statistics is unusually small under the assumption of independent tests.
These results do not establish that the seven statistically significant findings are all false positives, nor do they identify a specific mechanism. They do show, however, that perfect significance can coexist with weak evidential value: even in preregistered research, a uniformly significant pattern can be statistically inconsistent with the assumptions required for straightforward credibility.
Given these results, an independent, well-powered replication is warranted. The true power of the reported studies is unlikely to approach 80% even with sample sizes of 800 participants; if it did, at least one p-value would be expected below .005. Absent such evidence, perfect success should not be taken as evidence that a robust effect has been established.
In conclusion, the replication crisis has sharpened awareness that researchers face strong incentives to publish and that journals—especially prestigious outlets such as PNAS—prefer clean, internally consistent narratives. Open science practices have improved transparency, but it remains unclear whether they are sufficient to prevent the kinds of model violations that undermined credibility before the crisis. Fortunately, methodological reform has also produced more informative tools for evaluating evidential value.
For researchers seeking credible results, the practical implication is straightforward: avoid building evidential claims on many marginally powered studies. Rather than running seven underpowered experiments in the hope of success, conduct one adequately powered study—and, if necessary, a similarly powered preregistered replication (Schimmack, 2012). Multi-study packages are not inherently problematic, but when “picture-perfect” significance becomes the implicit standard, they increase the risk of selective success and overinterpretation. Greater awareness that such patterns can be detected statistically may help authors, reviewers, and editors better weigh these trade-offs.