
Citation. Schimmack, U. (2014, December 30). The test of insufficient
variance (TIVA): A new tool for the detection of questionable research practices [Blog Post]. Retrieved from http:// replicationindex.wordpress.com/2014/12/30/tiva
Updated 2025/08/20
I never submitted this work for peer-review, but the method has been reviewed in a peer-reviewed article and compared to other bias detection tools. Like many other tests, it does not work well when heterogeneity in effect sizes or sample sizes (or both) produces heterogeneity in power, but it did really well when all studies tested similar effect sizes which is often the case when they are small or zero.

Renkewitz, F., & Keiner, M. (2019). How to detect publication bias in psychological research: A comparative evaluation of six statistical methods. Zeitschrift für Psychologie, 227(4), 261–279. https://doi.org/10.1027/2151-2604/a000386
The Test of Insufficient Variance
It has been known for decades that published results tend to be biased (Sterling, 1959). For most of the past decades this inconvenient truth has been ignored. In the past years, there have been many suggestions and initiatives to increase the replicability of reported scientific findings (Asendorpf et al., 2013). One approach is to examine published research results for evidence of questionable research practices (see Schimmack, 2014, for a discussion of existing tests). This blog post introduces a new test of bias in reported research findings, namely the Test of Insufficient Variance (TIVA).
TIVA is applicable to any set of studies that used null-hypothesis testing to conclude that empirical data provide support for an empirical relationship and reported a significance test (p-values).
Rosenthal (1978) developed a method to combine results of several independent studies by converting p-values into z-scores. This conversion uses the well-known fact that p-values correspond to the area under the curve of a normal distribution. Rosenthal did not discuss the relation between these z-scores and power analysis. Z-scores are observed scores that should follow a normal distribution around the non-centrality parameter that determines how much power a study has to produce a significant result. In the Figure, the non-centrality parameter is 2.2. This value is slightly above a z-score of 1.96, which corresponds to a two-tailed p-value of .05. A study with a non-centrality parameter of 2.2 has 60% power. In specific studies, the observed z-scores vary as a function of random sampling error. The standardized normal distribution predicts the distribution of observed z-scores. As observed z-scores follow the standard normal distribution, the variance of an unbiased set of z-scores is 1. The Figure on top illustrates this with the nine purple lines, which are nine randomly generated z-scores with a variance of 1.
In a real data set the variance can be greater than 1 for two reasons. First, if the nine studies are exact replication studies with different sample sizes, larger samples will have a higher non-centrality parameter than smaller samples. This variance in the true non-centrality variances adds to the variance produced by random sampling error. Second, a set of studies that are not exact replication studies can have variance greater than 1 because the true effect sizes can vary across studies. Again, the variance in true effect sizes produces variance in the true non-centrality parameters that add to the variance produced by random sampling error. In short, the variance is 1 in exact replication studies that also hold the sample size constant. When sample sizes and true effect sizes vary, the variance in observed z-scores is greater than 1. Thus, an unbiased set of z-scores should have a minimum variance of 1.
If the variance in z-scores is less than 1, it suggests that the set of z-scores is biased. One simple reason for insufficient variance is publication bias. If power is 50% and the non-centrality parameter matches the significance criterion of 1.96, 50% of studies that were conducted would not be significant. If these studies are omitted from the set of studies, variance decreases from 1 to .36. Another reason for insufficient variance is that researchers do not report non-significant results or used questionable research practices to inflate effect size estimates. The effect is that variance in observed z-scores is restricted. Thus, insufficient variance in observed z-scores reveals that the reported results are biased and provide an inflated estimate of effect size and replicability.
In small sets of studies, insufficient variance may be due to chance alone. It is possible to quantify how lucky a researcher was to obtain significant results with insufficient variance. This probability is a function of two parameters: (a) the ratio of the observed variance (OV) in a sample over the population variance (i.e., 1), and (b) the number of z-scores minus 1 as the degrees of freedom (k -1).
The product of these two parameters follows a chi-square distribution with k-1 degrees of freedom.
Formula 1: Chi-square = OV * (k – 1) with k-1 degrees of freedom.
Example 1:
Bem (2011) published controversial evidence that appear to demonstrate precognition. Subsequent studies failed to replicate these results (Galak et al.,, 2012) and other bias tests show evidence that the reported results are biased Schimmack (2012). For this reason, Bem’s article provides a good test case for TIVA.
 The article reported results of 10 studies with 9 z-scores being significant at p < .05 (one-tailed). The observed variance in the 10 z-scores is 0.19. Using Formula 1, the chi-square value is chi^2 (df = 9) = 1.75. Importantly, chi-square tests are usually used to test whether variance is greater than expected by chance (right tail of the distribution). The reason is that variance is not expected to be less than the variance expected by chance because it is typically assumed that a set of data is unbiased. To obtain a probability of insufficient variance, it is necessary to test the left-tail of the chi-square distribution. The corresponding p-value for chi^2 (df = 9) = 1.75 is p = .005. Thus, there is only a 1 out of 200 probability that a random set of 10 studies would produce a variance as low as Var = .19.
This outcome cannot be attributed to publication bias because all studies were published in a single article. Thus, TIVA supports the hypothesis that the insufficient variance in Bem’s z-scores is the result of questionable research methods and that the reported effect size of d = .2 is inflated. The presence of bias does not imply that the true effect size is 0, but it does strongly suggest that the true effect size is smaller than the average effect size in a set of studies with insufficient variance.
Example 2:
Vohs et al. (2006) published a series of studies that he results of nine experiments in which participants were reminded of money. The results appeared to show that “money brings about a self-sufficient orientation.” Francis and colleagues suggested that the reported results are too good to be true. An R-Index analysis showed an R-Index of 21, which is consistent with a model in which the null-hypothesis is true and only significant results are reported.
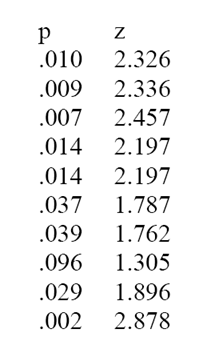
Because Vohs et al. (2006) conducted multiple tests in some studies, the median p-value was used for conversion into z-scores. The p-values and z-scores for the nine studies are reported in Table 2. The Figure on top of this blog illustrates the distribution of the 9 z-scores relative to the expected standard normal distribution.
Table 2
Study p z
Study 1 .026 2.23
Study 2 .050 1.96
Study 3 .046 1.99
Study 4 .039 2.06
Study 5 .021 2.99
Study 6 .040 2.06
Study 7 .026 2.23
Study 8 .023 2.28
Study 9 .006 2.73
The variance of the 9 z-scores is .054. This is even lower than the variance in Bem’s studies. The chi^2 test shows that this variance is significantly less than expected from an unbiased set of studies, chi^2 (df = 8) = 1.12, p = .003. An unusual event like this would occur in only 1 out of 381 studies by chance alone.
In conclusion, insufficient variance in z-scores shows that it is extremely likely that the reported results overestimate the true effect size and replicability of the reported studies. This confirms earlier claims that the results in this article are too good to be true (Francis et al., 2014). However, TIVA is more powerful than the Test of Excessive Significance and can provide more conclusive evidence that questionable research practices were used to inflate effect sizes and the rate of significant results in a set of studies.
Conclusion
TIVA can be used to examine whether a set of published p-values was obtained with the help of questionable research practices. When p-values are converted into z-scores, the variance of z-scores should be greater or equal to 1. Insufficient variance suggests that questionable research practices were used to avoid publishing non-significant results; this includes simply not reporting failed studies.
At least within psychology, these questionable research practices are used frequently to compensate for low statistical power and they are not considered scientific misconduct by governing bodies of psychological science (APA, APS, SPSP). Thus, the present results do not imply scientific misconduct by Bem or Vohs, just like the use of performance enhancing drugs in sports is not illegal unless a drug is put on an anti-doping list. However, jut because a drug is not officially banned, it does not mean that the use of a drug has no negative effects on a sport and its reputation.
One limitation of TIVA is that it requires a set of studies and that variance in small sets of studies can vary considerably just by chance. Another limitation is that TIVA is not very sensitive when there is substantial heterogeneity in true non-centrality parameters. In this case, the true variance in z-scores can mask insufficient variance in random sampling error. For this reason, TIVA is best used in conjunction with other bias tests. Despite these limitations, the present examples illustrate that TIVA can be a powerful tool in the detection of questionable research practices. Hopefully, this demonstration will lead to changes in the way researchers view questionable research practices and how the scientific community evaluates results that are statistically improbable. With rejection rates at top journals of 80% or more, one would hope that in the future editors will favor articles that report results from studies with high statistical power that obtain significant results that are caused by the predicted effect.