Zhao, Z., & Zhang, X. (2026). The effect of emotion on prospective memory: a three-level meta-analytic review. Cognition & emotion, 40(2), 329–344. https://doi.org/10.1080/02699931.2025.2508391
Introduction
In a recent critique of z-curve (under review), some authors (who shall remain anonymous at this point) argued that z-curve performs poorly when it is applied to meta-analyses in the emotion literature (Schimmack, 2026). However, the critic did not even publish z-curve analyses of these meta-analyses, nor did it show how other meta-analytic methods perform with the same data. In a previous post, I showed that in the first meta-analysis of this critical article, z-curve performed just as well as other methods (Schimmack, 2026). The demonstration that z-curve estimates vary a lot across bootstrapped samples is not a flaw of z-curve. It merely shows that the data do not contain useful information.
This blog post examines the performance of z-curve and an effect-size selection model (Vevea & Wood, 2025) for the second meta-analysis that was used to claim that z-curve fails to provide meaningful information.
Influence of Valence on Prospective Memory
The meta-analysis included studies that examined the influence of affective valence (neutral, positive, negative) on prospective memory; that is the ability to remember to perform planned actions at a future point in time. The dataset contains 171 effect sizes. 116 are comparisons of neutral stimuli with emotional ones, and 55 compare positive to negative stimuli.
Figure 1 shows a histogram of the effect sizes (Hedge’s g).
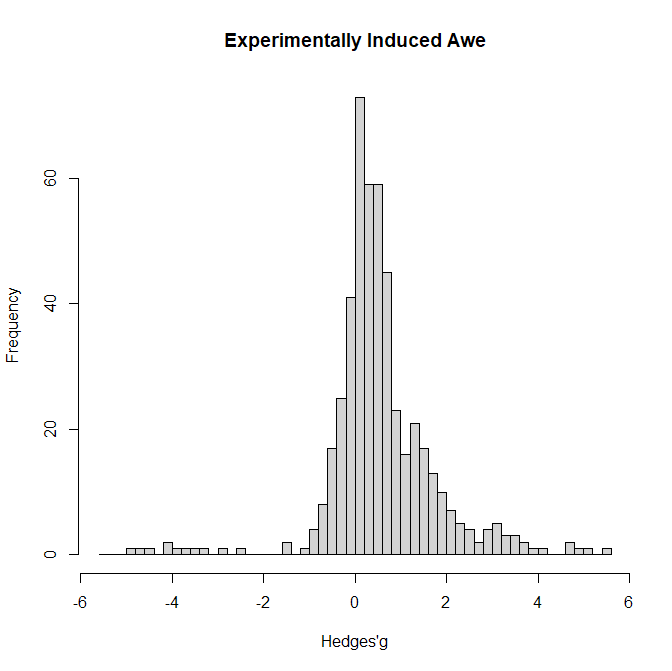
The most notable feature of the histogram is that the mode is close to zero. There are a few extremely large negative effect sizes, but most effect sizes are positive. This pattern suggests large heterogeneity.
I first analyzed these data comparing neutral to affective stimuli. I used Vevea and Wood’s (2005) selection model and used clustered bootstraps to take the nested structure of the data into account. There was evidence of selection bias: the weight for negative effects was below 1, w = .33, 95%CI = .15 to .74.
The estimated mean was not significantly different from zero, g = .05, 95%CI = -0.57 to 0.54. The estimated heterogeneity was large, tau = 1.31, 95%CI = 1.00 to 1.59. The prediction interval ranged from g = -2.64 to 2.64.
Given the wide prediction interval, it is impossible to predict the effect size of a specific study without further information.
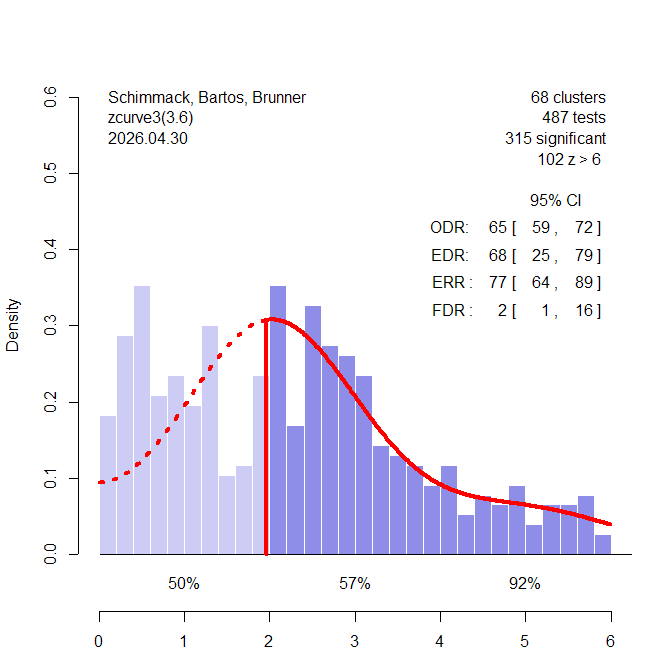
Z-curve shows a different picture (Figure 2). The observed discovery rate is 65%. That is 65% of the results are statistically significant. Based on the distribution of the significant z-values, the model estimates an expected discovery rate of 68%. Thus, there is no evidence of selection bias. Moreover, an EDR of 68% implies that most studies have high power and the false positive risk is low, FDR = 2%. Even with the lower limit of the EDR confidence interval, 25%, the FDR is a modest 16%. The model also predicts that an exact replication of one of the significant results has a 77% probability of producing a significant result again. The lower limit of the ERR is still 64%. Even the non-significant results have an average 50% probability of producing a significant result if they were done again. This suggests that many of these results are false negatives. For studies with z-values between 4 and 6 replicability increases to 92%, 95%CI = .85 to .95. Moreover, there are 102 z-values greater than 6 that are practically guaranteed to produce a significant result again in an exact replication study.
In conclusion, z-curve does not claim that all studies have a common effect size. Instead, it examines how credible a set of heterogenous results are. The results here show that the awe-literature is credible with a low false positive risk. It also shows that results with significant results are likely to replicate if the z-value is above 4. Other results are likely to produce significant results in close replications with large samples. These results are somewhat better than the average credibility of emotion research (Soto & Schimmack, 2024).
What (TF) is McShane Doing?
McShane shows plots like the one in Figure 3 that claim to show the “Sampling Distributions of z-curve Point Estimates of Average Power”
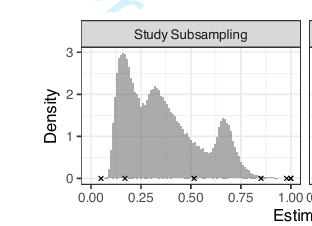
First, it is not clear what McShane means by “average power.” Z-curve estimates Expected Discovery Rates and Expected Replication Rates, not average power. Second, it is not clear what McShane means by sampling distribution of z-curve estimands (EDR, ERR). The actual sampling distributions look very different from his plot.
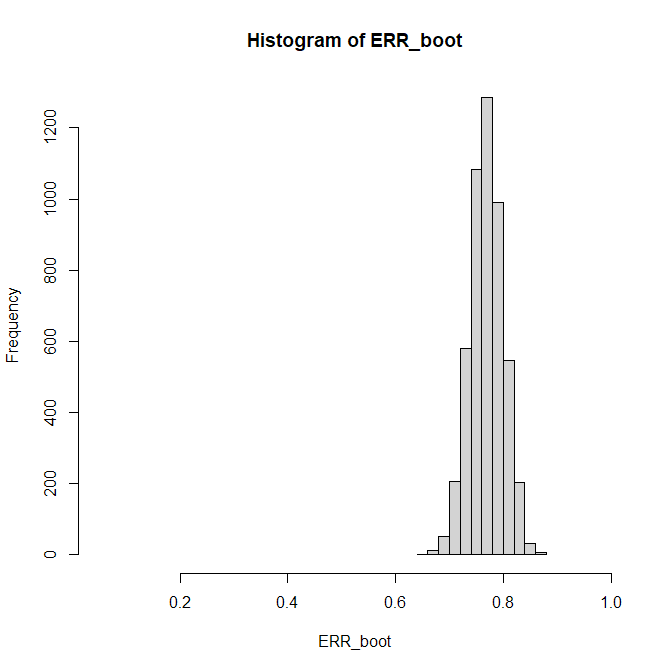
Figure 4 shows the histogram for 5,000 bootstraps with study-level sampling.
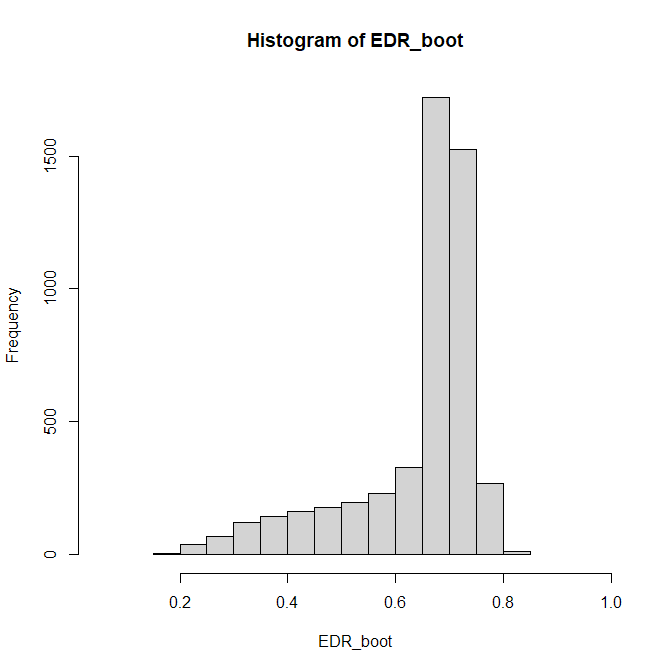
The figure is very different and explains the EDR results. The point estimate is 68%. There is little uncertainty about the upper limit, 79%, but high uncertainty about the lower limit, 25%. The reason is that the EDR is based on a prediction about the unknown distribution of non-significant results. This creates uncertainty and wide CI especially if only 84 studies are available.
The results for the ERR are different because ERR is an estimate for significant results that are all available. Consistent with the narrow CI for the ERR ranging from 64% to 89%, the histogram shows a narrow distribution in this range.
Conclusion
This work was motivated by claims that z-curve is an unreliable method to conduct meta-analysis that produces wide and uninformative confidence intervals. Closer inspection shows that the problem is not z-curve. Instead, the problem are the data. The studies are variable and have low power to detect any real effects, if they exist. A fixed-effect meta-analysis would ignore this variability and might produce a statistically significant result that is then presented as evidence for effects of affective valence on prospective memory. Z-curve accurately reveals the truth that there is no reliable signal in the data, as does the effect size selection model. The information may not be desirable but z-cure is just a messenger. Unfortunately, the messenger often gets blamed for the bad news.
P.S. AI Coding
Coding research results for meta-analyses or z-curve analyses is time consuming and difficult when results are not clearly reported. Mistakes are nearly inevitable. Inspection of outliers can help to detect coding mistakes (e.g., confusing SE and SD). AI is now powerful enough to code articles and it should be used at least to check human coding.