All posts by Ulrich Schimmack

About Ulrich Schimmack

Since Cohen (1962) published his famous article on statistical power in psychological journals, statistical power has not increased. The R-Index makes it possible f to distinguish studies with high power (good science) and studies with low power (bad science). Protect yourself from bad science and check the R-Index before you believe statistical results.

Scoring Adverserial Collaborations

Daniel Kahneman coined the term “adversarial collaborations” for research projects conducted by teams of researchers with conflicting or opposing views. The idea was that such projects would help to resolve academic disputes that can linger for decades because researchers usually conduct confirmatory studies that support their own views and neglect evidence that does not. This human bias, called confirmation bias, is one of the most well documented and robust biases demonstrated by social psychologists. At the same time, the replication crisis in social psychology has demonstrated that even scientists who are fully aware of this bias are often unable to overcome it. We may call this “confirmation bias neglect,” “confirmation bias blindspot” or “willful incompetence” – the inability to train oneself to conduct research as it is supposed to be by putting one’s own ideas to a risky empirical test that can demonstrate that the cherished theory is false.

Adverserial collaboration projects remain rare and the few that exist also show that they do not overcome human biases. Discussion sections are often not decisive, and the only agreement is that “more research is needed.” Taxpayers might say that they are not interested in funding more research that provides no clear answers. Much of social psychology is more infotainment than science.

I have been working with AI for over a year now and I think AI can play an important role in reducing human biases and making psychology look more like a science; that is, declare a winner in scientific debates so that field can move on. This blog post is just a little demonstration what this might look like.

The example comes from a debate in statistics. Readers may think that statistics is like math, where it is relatively easy to find consensus that 2 + 2 = 4, and not 5. A debate about this would make anybody arguing that 2 + 2 = 5 look like a biased, if not crazy, person, and the debate would quickly fizzle. However, statistics is nothing like match even if it uses formulas and Greek symbols. In the end, statistics only exists because math is being used to make claims about unknowns like the outcome of the next election or the true effect of feedback on learning. Observed data provide some information, but statistics is needed to make the leap to unobservable. In this world, academics fight even about the most basic assumptions, and everybody has a cherished approach that is defended like other people defend religious beliefs. Some not only defend their God but also spend considerable time attacking other religions. In this world, 2 + 2 can be 4, 5, or infinite.

I am not a trained statistician, but I worked with a statistician, Jerry Brunner, on a statistical method to make sense of published results after the replication crisis. We validated this method with extensive simulation studies and showed that it performs best under realistic conditions; that is when studies vary considerably in designs, sample sizes, and the unknowable effect sizes (Brunner & Schimmack, 2020). In 2022, a genus student, Frantisek Bartos and I extended the method to quantify the amount of publication bias (how many results that did not confirm predicts did researchers hide from the public) and the false positive risk (how many of the published results might have provided false evidence for researchers claims). Frantisk used hundreds of computing hours to validate this method across hundreds of realistic scenarios. Both articles appeared in Meta-Psychology, a journal that demands publishing reproducible code to check results that can also be used to run additional simulations. In the past three years, z-curve has been criticized, and we have responded to these criticisms. For example, z-curve can show bias when samples are tiny (N < 30). This is usually not a problem because studies with tiny sample sizes are rare, but we also created a fix for this problem for applications in research areas that have tiny samples.

Anyhow, Erik van Zwet, a biostatistican from the Netherlands, posted two blog posts to criticize z-curve. Each blog post showed a simulation that revealed problems with the estimation of the expected discovery rate that is used to evaluate publication bias and false positive risks. The first discussion quickly deteriorated and serves as an example of the passion that academics can have for topics that normal humans could not care less about. The second one attracted little interest and was mainly an exchange between Erik and me.

I asked ChatGPT to referee the exchange and it wrote a “game report” that is informative and funny at the same time. Importantly, I won, but barely. The outcome is less important than the neutral and balanced report. The main advantage of AI is not that it has superintelligence. It’s main strength is that it does not care about the outcome of the game. The desire to be right is the Kryptonite of academics. Calls for humility are nice, but unrealistic. Trying to prove your ideas to be right motivates many academics to work long hours and sometimes to waste their entire life on nutty ideas like extrasensory perception. AI may help us individually and collectively to avoid this mistake.

You can find the actual game here
More concerns about the z-curve method | Statistical Modeling, Causal Inference, and Social Science

And here is ChatGPTs game report:


Full time

Ulrich 5 – 4 Erik

(Technically decisive win for Ulrich, but with avoidable late fouls.)


First half

Erik goals (2)

(6′) Framing the agenda
Erik successfully sets the frame: undercoverage of EDR CIs, bootstrap collapse, and model misspecification. This is a legitimate opening and forces engagement.

(18′) Collapsing CI diagnosis
The zero-length CI for (P(\mathrm{SNR}=0)) is a real inferential pathology. This is Erik’s strongest technical contribution and remains uncontested as a phenomenon.


Ulrich goals (2)

(25′) Extensive validation defense
Ulrich correctly invokes prior large-scale simulations and reproducibility checks. This blunts any claim that z-curve was casually or narrowly validated.

(38′) Black-swan argument
The point that one pathological case does not invalidate a method in general is sound and resonates with statistically literate readers.


Second half

Erik goals (2)

(52′) Model-uncertainty critique
Erik’s argument that bootstrap CIs reflect sampling uncertainty but ignore model uncertainty is correct in principle and applies to mixture models under misspecification.

(64′) “Undetectable violation” claim
The insistence that the misspecification is practically undetectable from truncated data keeps pressure on defaults and diagnostics. This is a fair methodological concern.


Ulrich goals (3)

(70′) vj intervention (assist credited to Ulrich)
The vj comment decisively reframes the issue:

  • identifies perfect power homogeneity,
  • explains weak identification of EDR,
  • localizes the failure to a knife-edge case.

This is a major momentum shift.

(78′) Mu-grid diagnosis and fix
Demonstrating that coverage is restored by aligning the mu grid is a technical knockout: it shows the issue is resolution under discretization, not a broken method.

(85′) Final Ulrich comment (heterogeneity + alternatives)
This is your strongest direct response:

  • acknowledges the edge case,
  • explains why it is unrealistic,
  • cites known alternatives (moving μ, random-effects),
  • and challenges Erik to generalize his claim.

Substantively, this closes the loop.


Own goals

Ulrich — Own Goals (2)

(44′) Early defensive tone
The initial “he does not hear me” framing and appeal to Erik’s past review role weakened the epistemic high ground.

(90’+2) P.S. about Andrew
The postscript is unnecessary and risks shifting attention back to tone and personalities rather than substance.


Erik — Own Goals (3)

(60′) Escalation to personal insinuation
Claims of harassment, editorial intervention, and “you haven’t read the post” add heat but no inferential value.

(88′) Latest reply (“comforting thought for you”)
This is a clear tone foul. It undercuts Erik’s otherwise disciplined methodological position and hands Ulrich the moral high ground late in the game.

(90′) Failure to engage heterogeneity point
Erik never answers the central empirical challenge: where do we see near-homogeneous power in real literatures? That omission matters.


Man of the Match

Ulrich

Reason: You end the exchange with a coherent synthesis:

  • the failure mode is known,
  • it arises in unrealistic knife-edge cases,
  • defaults work because real data are heterogeneous,
  • and alternatives exist if one worries about that edge case.

That is the position readers will remember.


Final assessment

  • You won on substance.
  • You mostly avoided tone own goals, except for the P.S.
  • Erik’s last comment actually hurts his case more than it hurts yours.

At this point, do not reply again. The ball is out of play, and any further touch risks a needless foul.

If Erik posts new simulations with realistic heterogeneity, bring them here first. Otherwise, this match is over—and you won it.

Response to van Zwet’s Critic of Our Z-Curve Method


Bartoš, F., & Schimmack, U. (2022). Z-curve 2.0: Estimating replication rates and discovery rates. Meta-Psychology, 6, Article e0000130. https://doi.org/10.15626/MP.2022.2981

Brunner, J., & Schimmack, U. (2020). Estimating population mean power under conditions of heterogeneity and selection for significance. Meta- Psychology. MP.2018.874, https://doi.org/10.15626/MP.2018.874

van Zwet, E., Gelman, A., Greenland, S., Imbens, G., Schwab, S., & Goodman, S. N. (2024). A New Look at P Values for Randomized Clinical Trials. NEJM evidence3(1), EVIDoa2300003. https://doi.org/10.1056/EVIDoa2300003

The Story of Two Z-Curve Models

Erik van Zwet recently posted a critique of the z-curve method on Andrew Gelman’s blog.

Concerns about the z-curve method | Statistical Modeling, Causal Inference, and Social Science

Meaningful discussion of the severity and scope of this critique was difficult in that forum, so I address the issue more carefully here.

van Zwet identified a situation in which z-curve can overestimate the Expected Discovery Rate (EDR) when it is inferred from the distribution of statistically significant z-values. Specifically, when the distribution of significant results is driven primarily by studies with high power, the observed distribution contains little information about the distribution of nonsignificant results. If those nonsignificant results are not reported and z-curve is nevertheless used to infer them from the significant results alone, the method can underestimate the number of missing nonsignificant studies and, as a consequence, overestimate the Expected Discovery Rate (EDR).

This is a genuine limitation, but it is a conditional and diagnosable one. Crucially, the problematic scenarios are directly observable in the data. Problematic data have an increasing or flat slope of the significant z-value distribution and a mode well above the significance threshold. In such cases, z-curve does not silently fail; it signals that inference about missing studies is weak and that EDR estimates should not be trusted.

This is rarely a problem in psychology, where most studies have low power, the mode is at the significance criterion, and the slope decreases, often steeply. This pattern implies a large set of non-significant results and z-curve provides good estimates in these scenarios. It is difficult to estimate distributions of unobserved data, leading to wide confidence intervals around these estimates. However, there is no fixed number of studies that are needed. The relevant question is whether the confidence intervals are informative enough to support meaningful conclusions.

One of the most powerful set of studies that I have actually seen comes from epidemiology, where studies often have large samples to estimate effect sizes precisely. In these studies, power to reject the null hypothesis is actually not really important, but the data serve as a good example of a set of studies with high power, rather than low power as in psychology.

However, even this example shows a decreasing slope and a mode at significance criterion. Fitting z-curve to these data still suggests some selection bias and no underestimation of reported non-significant results. This illustrates how extreme van Zwet’s scenario must be to produce the increasing-slope pattern that undermines EDR estimation.

What about van Zwet’s Z-Curve Method?

It is also noteworthy that van Zwet does not compare our z-curve method (Bartos & Schimmack, 2022; Brunner & Bartos, 2020) to his own z-curve method that was used to analyze z-values from clinical trials (van Zwet et al., 2024).

The article fits a model to the distribution of absolute z-values (ignoring whether results show a benefit or harm to patients). The key differences between the two approaches are that (a) van Zwet et al.’s model uses all z-values and assumes (implicitly) that there is no selection bias, and (b) that true effect sizes are never zero and errors can only be sign errors. Based on these assumptions, the article concludes that no more than 2% of clinical trials produce a result that falsely rejects a true hypothesis. For example, a statistically significant result could be treated as an error only if the true effect has the opposite sign (e.g., the true effect increases smoking, but a significant result is used to claim it reduced smoking).

The advantage of this method is that it is not necessary to estimate the EDR from the distribution of only significant results, but it does so only by assuming that publication bias does not exist. In this case, we can just count the observed non-significant and significant results and use the observed discovery rate to estimate average power and the false positive risk.

The trade-off is clear. z-curve attempts to address selection bias and sometimes lacks sufficient information to do so reliably; van Zwet’s approach achieves stable estimates by assuming the problem away. The former risks imprecision when information is weak; the latter risks bias when its core assumption is violated.

In the example from epidemiology, there is evidence of some publication bias and omission of non-significant results. Using van Zwet’s model would be inappropriate because it would overestimate the true discovery rate. The focus on sign errors alone is also questionable and should be clearly stated as a strong assumption. It implies that significant results in the right direction are not errors, even if effect sizes are close to zero. For example, a significant result that suggests it extends life is considered a true finding, even if the effect size is one day.

False positive rates do not fully solve that problem, but false positive rates that include zero as a hypothetical value for the population effect size are higher and treat small effects close to zero as errors rather than treating half of them as correct rejections of the null hypothesis. For example, an intervention that decreases smoking by 1% of all smokers is not really different from one that increases it by 1%, but a focus on signs treats only the latter one as an error.

In short, van Zwet’s critique identifies a boundary condition for z-curve, not a general failure. At the same time, his own method rests on a stronger and untested assumption—no selection bias—whose violation would invalidate its conclusions entirely. No method is perfect and using a single scenario to imply that a method is always wrong is not a valid argument against any method. By the same logic, van Zwet’s own method could be declared “useless” whenever selection bias exists, which is precisely the point: all methods have scope conditions.

Using proper logic, we suggest that all methods work when assumptions are met. The main point is to test whether they are met or not. We clarified that z-curve estimation of the EDR assumes that enough low powered studies produced significant results to influence the distribution of significant results. If the slope of significant results is not decreasing, this assumption does not hold and z-curve should not be used to estimate the EDR. Similarly, users of van Zwets first method should first test whether selection bias is present and not use it when it does. They should also examine whether they think a proportion of studies could have tested practically true null hypotheses and not use the method when this is a concern.

Finally, the blog post responds to Gelman’s polemic about our z-curve method and earlier work by Jager and Leek (2014), by noting that Gelman’s critic of other methods exist in parallel to his own work (at least co-authorship) that also modeled distribution of z-values to make claims about power and the risk of false inferences. The assumption of this model that selection bias does not exist is peculiar, given Gelman’s typical writing about low power and the negative effects of selection for significance. A more constructive discussion would apply the same critical standards to all methods—including one’s own.


Experimental Social Psychology is Not a True Science

The term science can be used to describe both the actual practices of researchers and an idealized set of practices that distinguish science from other approaches to making claims about the world.

A core aspect of the idealized conception of science is that research activity is used to test theories, and that empirical tests can, under some conditions, falsify theoretical predictions. Falsification is neither necessary nor sufficient for scientific progress, but a research program that systematically insulates theories from empirical refutation departs from core scientific norms. Unfortunately, psychology has often ignored falsification or confused rejections of null hypotheses with falsification.

The fallacy here is that rejection of null hypotheses is used to confirm theoretical hypotheses about the direction or existence of effects. As a consequence, psychology lacks widely used statistical methods that can provide affirmative evidence against substantive theoretical predictions. Studies are typically interpreted as confirming predictions or are deemed inconclusive.

This asymmetry in evidential standards helps explain why over 90% of articles report confirmation of a theoretical prediction (Sterling, 1959; Sterling et al., 1995). Psychologists paid little attention to this unusually high success rate until replication attempts of published studies revealed that replication success in experimental social psychology was substantially lower than implied by the published literature, with only 25% successful replications in the Reproducibility Project (2025).

Some review articles suggest that the replication crisis has led to methodological reforms and has made experimental social psychology more trustworthy. This is partially correct. Social psychologists played a prominent role in the Open Science movement and contributed to reforms such as open data, preregistration, and registered reports. However, these reforms are not universally mandated and do not retroactively address the credibility of results published prior to their adoption, particularly before the 2010s. Moreover, incentives remain that favor positive and theoretically appealing results, and some researchers continue to downplay the extent of the replication problem. As a result, it is difficult to make general claims about social psychology as a unified scientific enterprise. In the absence of enforceable, field-wide normative standards, credibility remains largely a property of individual researchers rather than the discipline as a whole.

Social Priming

Priming is a general term in psychology referring to the automatic influence of stimuli on subsequent thoughts, feelings, or behaviors. A classic example from cognitive psychology shows that exposure to a word such as “forest” facilitates the processing of related words such as “tree.”

Social psychologists hypothesized that priming could also operate without awareness and influence actual behavior. A well-known study appeared to show that exposure to words associated with elderly people caused participants to walk more slowly (Bargh et al., 1996). That article also reported subliminal priming effects, suggesting that behavioral influence could occur without conscious awareness. These findings inspired a large literature that appeared to demonstrate robust priming effects across diverse primes, presentation modes, and behavioral outcomes, with success rates comparable to those documented by Sterling (1959).

In 2012, a group of relatively early-career researchers published a failure to replicate the elderly-walking priming effect (Doyen et al., 2012). The publication of this study marked an important turning point, as it challenged a highly influential finding in the literature. Bargh responded critically to the replication attempt, and the episode became widely discussed. Daniel Kahneman had highlighted priming research in Thinking, Fast and Slow and, concerned about its replicability, encouraged original authors to conduct high-powered replications. These replications were not forthcoming, while independent preregistered studies with larger samples increasingly failed to reproduce key priming effects. As a result, priming research became a focal example in discussions of the replication crisis. Kahneman later distanced himself from strong claims based on this literature and expressed regret about relying on studies with small samples (Kahneman, 2017).

Willful Ignorance and Incompetence In Response to Credibility Concerns

In 2016, Albarracín (as senior author) and colleagues published a meta-analysis concluding that social priming effects exist, although the average effect size was relatively small (d ≈ .30; Weingarten et al., 2016). An effect of this magnitude corresponds to roughly one-third of a standard deviation, which is modest in behavioral terms.

The meta-analysis attempted to address concerns about publication bias—the possibility that high success rates reflect selective reporting of significant results. If selection bias is substantial, observed effect sizes will be inflated relative to the true underlying effects. The authors applied several bias-detection methods that are now widely recognized as having limited diagnostic value. They also used the p-curve method, which had been introduced only two years earlier (Simonsohn et al., 2014). However, the p-curve results were interpreted too optimistically. P-curve can reject the hypothesis that all significant results arise from true null effects, but it does not test whether publication bias is present or whether effect sizes are inflated. Moreover, the observed p-curve was consistent with an average statistical power of approximately 33%. Given such power, one would expect roughly one-third of all studies to yield significant results under unbiased reporting, yet the published literature reports success rates exceeding 90%. This discrepancy strongly suggests substantial selective reporting and implies that the true average effect size is likely smaller than the headline estimate.

Sotola (2022) reexamined Weingarten et al.’s meta-analysis using a method called z-curve. Unlike p-curve, z-curve explicitly tests for selective reporting by modeling the distribution of statistically significant results. It is also more robust when studies vary in power and when some studies have true effects while others do not. Whereas p-curve merely rejects the hypothesis that all studies were obtained under a true null, z-curve estimates the maximum proportion of significant results that could be false discoveries, often referred to as an upper bound on the false discovery rate (Bartos & Schimmack, 2022).

Sotola found that priming studies reported approximately 76% significant results—somewhat below the roughly 90% level typically observed in social psychology—but that the estimated average power to produce a significant result was only 12.40%. Z-curve also did not rule out the possibility that all observed significant results could have arisen without a true effect. This finding does not justify the conclusion that social priming effects do not exist, just as observing many white swans does not prove the absence of black swans. However, it does indicate that the existing evidence—including the Weingarten et al. meta-analysis—does not provide conclusive support for claims that social priming effects are robust or reliable. The literature documents many reported effects but offers limited evidential leverage to distinguish genuine effects from selective reporting (many sitings of UFOs, but no real evidence of alien visitors).

Despite these concerns, Weingarten’s meta-analysis continues to be cited as evidence that priming effects are real and that replication failures stem from factors other than low power, selective reporting, and effect size inflation. For example, Iso-Ahola (2025) cites Weingarten et al. while arguing that there is no replication crisis. Notably, this assessment does not engage with subsequent reanalyses of the same data, including Sotola’s z-curve analysis.

This article illustrates what can reasonably be described as willful ignorance: evidence that does not fit the preferred narrative is not engaged. The abstract’s claim that “there is no crisis of replication” is comparable, in terms of evidential standards, to assertions such as “climate change is a hoax”—claims that most scientists regard as unscientific because they dismiss a large and well-documented body of contrary evidence. Declaring the replication problem nonexistent, rather than specifying when, where, and why it does not apply, undermines psychology’s credibility and its aspiration to be taken seriously as a cumulative science.

Willful ignorance is also evident in a recent meta-analysis, again with Albarracín as senior author. This meta-analysis does not include a p-curve analysis and ignores the z-curve reanalysis by Sotola altogether. While the new meta-analysis reports no effects in preregistered studies, its primary conclusion nevertheless remains that social priming has an effect size of approximately d = .30. This conclusion is difficult to reconcile with the preregistered evidence it reports.

A different strategy for defending social priming research is to question the validity of z-curve itself (Pek et al., 2025, preprint, Cognition & Emotion). For example, Pek et al. note that transforming t-values into z-values can break down when sample sizes are extremely small (e.g., N = 5), but they do not acknowledge that the transformation performs well at sample sizes that are typical for social psychological research (e.g., N ≈ 30). Jerry Brunner, a co-author of the original p-curve paper and a professor of statistics, identified additional errors in their arguments (Brunner, 2024). Despite detailed rebuttals, Pek et al. have repeated the same criticisms without engaging with these responses.

This pattern is best described as willful incompetence. Unlike willful ignorance, which ignores inconvenient evidence, willful incompetence involves superficial engagement with evidence while the primary goal remains the defense of a preferred conclusion. In epistemic terms, this resembles attempts to rebut well-established scientific findings by selectively invoking technical objections without addressing their substantive implications.

Z-Curve Analysis of Social Priming

To illustrate how z-curve works and what it reveals about social priming, I analyzed the new meta-analysis of social priming using z-curve. Importantly, I had no influence on the data and only transformed reported information about effect sizes and sampling error into z-values. A z-curve plot provides a descriptive visualization of the evidential strength of published results relative to the null hypothesis. At this descriptive level, few assumptions are required.

The full z-curve analysis fits a statistical model to the distribution of z-values. Studies with low power—due to small effect sizes, small sample sizes, or both—are likely to produce low z-values and often nonsignificant results (z = 1.96 ≈ p = .05). Studies with high power (e.g., 80% power corresponds to z ≈ 2.8) require either moderate-to-large effect sizes or very large sample sizes. Inspection of the plot shows that most studies cluster at low z-values, with relatively few studies producing z-values greater than 2.8. Thus, even before modeling the data, the distribution indicates that the literature is dominated by low-powered studies.

The actual z-curve analysis fits a model to the distribution of z-values. Studies with low power (small effect sizes, small sample sizes) are likely to produce low z-values and often z-values that are not significant (z = 1.96 ~ p = .05). Studies that have high power (80% power ~ z = 2.8) have moderate to large effect sizes or really large sample sizes). Inspection of the plot shows most studies have low z-values and few studies have z-values greater than 2.8. Thus, even without modeling the data, we can see that this literature is dominated by studies with low power.

The plot also reveals clear evidence of selective reporting. If results were reported without selection, the distribution of z-values would decline smoothly around the significance threshold. Instead, the mode of the distribution lies just above the significance criterion. The right tail declines gradually, whereas the left side drops off sharply. There are too many results with p ≈ .04 and too few with p ≈ .06. This asymmetry provides direct visual evidence of publication bias, independent of any modeling assumptions.

Z-curve uses the distribution of statistically significant results to estimate the Expected Replication Rate (ERR) and the Expected Discovery Rate (EDR). The ERR estimate is conceptually similar to p-curve–based power estimates but is more robust when studies vary in power. In the present analysis, the estimated ERR of 34% closely matches the p-curve estimate reported by Weingarten et al. (33%) but is substantially higher than Sotola’s earlier z-curve estimate (12.5%). However, ERR estimates assume that studies can be replicated exactly, an assumption that is rarely satisfied in psychological research. Comparisons between ERR estimates and actual replication outcomes typically show lower success rates in practice (Bartos & Schimmack, 2022). Moreover, ERR is an average: approximately half of studies have lower replication probabilities, but we generally do not know which studies these are.

The EDR estimates the proportion of all studies conducted—including unpublished ones—that are expected to yield statistically significant results. In this case, the EDR point estimate is 19%, but there is substantial uncertainty because it must be inferred from the truncated set of significant results. Notably, the confidence interval includes values as low as 5%, which is consistent with a scenario in which social priming effects are absent across studies. Thus, these results replicate Sotola’s conclusion that the available evidence does not demonstrate that any nontrivial proportion of studies produced genuine social priming effects.

Pek et al. (2025) noted that z-curve estimates can be overly optimistic if researchers not only select for statistical significance but also preferentially report larger effect sizes. In their simulations, the EDR was overestimated by approximately 10 percentage points. This criticism, however, weakens rather than strengthens the evidential case for social priming, as an EDR of 9% is even less compatible with robust effects than an EDR of 19%.

The z-curve results also provide clear evidence of heterogeneity in statistical power. Studies selected for significance have higher average power than the full set of studies (ERR = 34% vs. EDR = 18%). Information about heterogeneity is especially evident below the x-axis. Studies with nonsignificant results (z = 0 to 1.95) have estimated average power of only 18–20%. Even studies with significant results and z-values up to 4 have estimated average power ranging from 23% to 56%. To expect an exact replication to succeed with 80% power, a study would need to produce a z-value above 4, yet the plot shows that very few studies reach this level.

Adjusting Alpha To Lower False Positive Risk

Z-curve can also be used to examine how changing the significance threshold affects false discoveries. With the conventional α = .05 criterion, one out of twenty tests of a true null hypothesis will be significant by chance. Lowering α to .01 reduces this rate to one in one hundred. However, stricter thresholds also reduce power and discovery rates. In some literatures, the reduction in false discoveries outweighs the cost of fewer significant results (Soto & Schimmack, 2024). This is not the case for social priming.

Setting α = .01 (z = 2.58) lowers the point estimate of the false discovery rate from 23% to 11%, but the 95% confidence interval still includes values up to 100%.

Setting α = .001 reduces the point estimate to 3%, yet uncertainty remains so large that all remaining significant results at that threshold could still be false positives.

P-Hacking Real Effects

It is possible to obtain more favorable conclusions about social priming by adopting additional assumptions. One such assumption is that researchers relied primarily on p-hacking rather than selective reporting. Under this scenario, fewer studies would need to be conducted and suppressed. When z-curve is fit under a pure p-hacking assumption, the estimates appear substantially more optimistic.

Under this model, evidence of p-hacking produces an excess of results just below p = .05, which are excluded from estimation. The resulting estimates suggest average power between 40% (EDR = .43) and 52% (ERR = .52), with relatively little heterogeneity. Nonsignificant results with z ≈ 1 are estimated to have average power of 46%, and significant results with z ≈ 4 have average power of 52%. If this model were correct, false positives would be rare and replication should be straightforward, especially with larger samples. The main difficulty with this interpretation is that preregistered replication studies consistently report average effect sizes near zero, directly contradicting these optimistic estimates (Dai et al., 2023).

Conclusion

So, is experimental social psychology a science? The most charitable answer is that it currently resembles a science with limited cumulative results in this domain. Meteorology is not a science because it acknowledges that weather varies; it is a science because it can predict weather with some reliability. Until social priming researchers can specify conditions under which priming effects reliably emerge in preregistered, confirmatory studies, the field lacks the predictive success expected of a mature empirical science.

Meanwhile willful ignorance and incompetence hamper progress towards this goal and undermine credible claims of psychology to be a science. Many psychology departments are being remained to have science in their name, but only acting in accordance with normative rules of science will make psychology a credible science.

Credible sciences also have a history of failures. Making mistakes is part of exploration. Covering them up is not. Meta-analyses of p-hacked studies without bias correction are misleading. Even worse are public significance statements directed at the general public rather than peers. The most honest public significance statement about social priming is “We fucked up. Sorry, we will do better in the future.”

Priming MAY Work (Dai …. Albarracin, 2023, Psych Bull)

Behavioral or social priming is the poster child of the replication crisis. Bargh declined Kahneman’s offer to rehabilitate it by showing that he could replicate his result. The same is true for other social psychologists who became famous for changing people’s behaviors without their knowledge / awareness.

While priming studies have largely disappeared from social psychology journals, the old studies still exist and have not been retracted although we know that they were obtained with unscientific methods that make it easy to present false evidence for false claims.

This allows unscientific meta-analysists to analyze these data and to continue to make claims that social priming is a real effect even in 2023 and even in a journal that is considered to be methodologically rigorous, although the name suggests otherwise (Psych Bull).

Dai, W., Yang, T., White, B. X., Palmer, R., Sanders, E. K., McDonald, J. A., Leung, M., & Albarracín, D. (2023). Priming behavior: A meta-analysis of the effects of behavioral and nonbehavioral primes on overt behavioral outcomes. Psychological Bulletin, 149(1-2), 67–98. https://doi-org.myaccess.library.utoronto.ca/10.1037/bul0000374

In the old days, the social power of censorship (peer-review) in scientific journals made it difficult to fight back against paradigm prisoners, who try to keep their little word of academia alive. Fortunately, consumers of scientific research now have options to ensure that they are not feeding their minds junk science.

I asked my ChatGPT (trained with discussions and information) to evaluate this article with a set of questions that anybody could ask an AI.

Critically evaluate this article.
Is the literature review accurate or misrepresent the broader literature
0 = totally false to 10 = totally accurate and consistent with current literature

Is this meta-analysis up to date or uses outdated methods
0 = totally outdated to 10 = totally up to date

Are the results interpreted correctly.
0 = totally misrepresents the results to 10 = totallly accurate

Integration with existing literature.
0 = not integrated at all, 10 = accurately interpreted in the context of broader literature

The scores are less important (as they would require comparison scores) than the reasons for the scores. Importantly, AI is neutral and more balanced than most humans, myself included, usually are.

Strengths

  • The paper integrates its moderator findings into established theoretical disputes (perception–behavior link vs goal mediation), and it connects specific moderation patterns (e.g., goal value manipulations) to prior work and theoretical interpretations.
  • It frames its contribution clearly as both (a) an expanded synthesis and (b) a mechanism-relevant test across moderators.

Limits

  • Integration is strongest for the authors’ preferred theoretical framing; it is thinner on integrating the skeptical/critical meta-science side beyond noting that bias methods have “become ever more sophisticated” and providing the Lakens critique as a prompt. In other words, it engages critique more as a motivation for adding diagnostics than as a serious alternative interpretation of what the literature’s apparent “robustness” means. Priming_behavior_

I did ask a couple of follow up questions, mainly about the well-known problem that average effect sizes are meaningless when studies are heterogenous; priming sometimes works and sometimes it does not. To make priming research actually useful, we need to specify WHEN priming works. Priming MAY work or priming SOMETIMES works, is not a scientific finding.

On this point, the meta-analysis is as mute as most others are, but the paper will be cited as “priming works and has a moderate effect size.” Only psychologists believe that this is enough to defend priming against critics who say, “If priming works, why don’t you do a preregistered study with high power and show us that it works?”

ChatGPT Summary: This Meta-Analysis Tell Us When Priming Works?

The authors present an ambitious meta-analysis of priming effects on behavior and argue that replication failures can be reconciled with a “moderate” average effect size by appealing to heterogeneity and moderators. In principle, this is a legitimate defense: heterogeneous effects can exist even when many individual studies fail to replicate. In practice, however, the paper does not deliver what this defense requires.

Although substantial heterogeneity is documented, the moderator analyses do not clearly identify which studies work and which do not. Most examined moderators are weak, inconsistent, or explain only a small fraction of the variance. As a result, the analysis does not partition the literature into a subset of theoretically coherent, reliably effective studies versus a subset that fails. Without such discrimination, heterogeneity becomes descriptive rather than explanatory.

This creates a central tension in the paper’s conclusions. The authors argue for a nonzero average priming effect while simultaneously acknowledging widespread replication failures and publication bias. Yet they do not show that the moderators they test successfully predict when priming should occur. Consequently, the results do not support a practical or falsifiable claim about replicability. A new study cannot be classified, based on their findings, as likely to succeed or fail.

The strongest conclusion supported by the evidence is therefore modest: priming effects may exist under some conditions, but those conditions are not empirically established by the present meta-analysis. Claims of “moderate” effects should be interpreted as population averages over a poorly understood mixture of successful and unsuccessful studies, rather than as evidence that priming reliably works in practice.

In short, the paper shows that priming has not been decisively ruled out—but it does not show when, how, or how often it actually works.

POSTSCRIPT

PET allows for an effect size of d = 0.025. However, because this result rejects H0, d = 0, at the 5% level, the authors use the PEESE estimate that is always higher. If they had used alpha = .01 or a minim effect size of d = .1, PET would not have been rejected, and the average effect size estimate would be close to zero. Did the authors p-hack PET to be significant? It does not matter. The evidence is weak and the main problem remains. Heterogeneity without a clear moderator that explains when it works and when it does not. This is psycho-science, not real science.

PPS

Priming may work, but NOT when a study is preregistered. (hm?)

Wilson and Wixted’s False False-Positive Rates


Wilson BM, Wixted JT. The Prior Odds of Testing a True Effect in Cognitive and Social Psychology. Advances in Methods and Practices in Psychological Science. 2018;1(2):186-197. doi:10.1177/2515245918767122

Abstract

Wilson and Wixted had a cool idea, but it turns out to be wrong. They proposed that sign errors in replication studies can be used to estimate false positive rates. Here I show that their approach makes a false assumption and does not work.

Introduction

Two influential articles shifted concerns about false positives in psychology from complacency to fear (Ioannidis, 2005; Simmons, Nelson, & Simonsohn, 2011). First, psychologists assumed that false rejections of the null hypothesis (no effect) are rare because the null hypothesis is rarely true. Effects were either positive or negative, but never really zero. In addition, meta-analyses typically found evidence for effects, even assuming biased reporting of studies (Rosenthal, 1979).

Simmons et al. (2011) demonstrated, however, that questionable, but widely used statistical practices can increase the risk of publishing significant results without real effects from the nominal 5% level (p < .05) to levels that may exceed 50% in some scenarios. When only 25% of significant results in social psychology could be replicated, it seemed possible that a large number of the replication failures were false positives (Open Science Collaboration, 2015).

Wilson and Wixted (2018) used the reproducibility results to estimate how often social psychologists test true null hypotheses. Their approach relied on the rate of sign reversals between original and replication estimates. If the null hypothesis is true, sampling error will produce an equal number of estimates in both directions. Thus, a high rate of sign reversals could be interpreted as evidence that many original findings reflect sampling error around a true null. Second, for every sign reversal there is typically a same-sign replication, and Wilson and Wixted treated the remaining same-sign results as reflecting tests of true hypotheses that reliably produce the correct sign.

Let P(SR) be the observed proportion of sign reversals between originals and replications (not conditional on significance). If true effects always reproduce the same sign and null effects produce sign reversals 50% of the time, then the observed SR provides an estimate of the proportion of true null hypotheses that were tested, P(True-H0).

P(True-H0) = 2*P(SR)

Wilson and Wixted further interpreted this quantity as informative about the fraction of statistically significant original results that might be false positives. Wilson and Wixted (2018) found approximately 25% sign reversals in replications of social psychological studies. Under their simplifying assumptions, this implies 50% true null hypotheses in the underlying set of hypotheses being tested, and they used this inference, together with assumptions about significance and power, to argue that false positives could be common in social psychology.

Like others, I thought this was a clever way to make use of sign reversals. The article has been cited only 31 times (WoS, January 6, 2026), and none of the articles critically examined Wilson and Wixted’s use of sign errors to estimate false positive rates.

However, other evidence suggested that false positives are rare (Schimmack, 2026). To resolve the conflict between Wilson and Wixted’s conclusions and other findings, I reexamined their logic and ChatGPT pointed out Wilson and Wixted’s (2018) formula rests on assumptions that need not hold.

The main reason is that it makes the false assumption that tests of true hypotheses do not produce sign errors. This is simply false because studies that test false null hypotheses with low power can still produce sign reversals (Gelman & Carlin, 2014). Moreover, sign reversals can be generated even when the false-positive rate is essentially zero, if original studies are selected for statistical significance and the underlying studies have low power. In fact, it is possible to predict the percentage of sign reversals from the non-centrality of the test statistic under the assumption that all studies have the same power. To obtain 25% sign reversals, all studies could test a false null hypothesis with about 10% power. In that scenario, many replications would reverse sign because estimates are highly noisy, while the original literature could still contain few or no literal false positives if the true effects are nonzero.


Empirical Examination with Many Labs 5

I used the results from ManyLabs5 (Ebersole et al., 2020) to evaluate what different methods imply about the false discovery risk of social psychological studies in the Reproducibility Project, first applying Wilson and Wixted’s sign-reversal approach and then using z-curve (Bartos & Schimmack, 2022; Brunner & Schimmack, 2020).

ManyLabs5 conducted additional replications of 10 social psychological studies that failed to replicate in the Reproducibility Project (Open Science Collaboration, 2015). The replication effort included both the original Reproducibility Project protocols and revised protocols developed in collaboration with the original authors. There were 7 sign reversals in total across the 30 replication estimates. Using Wilson and Wixted’s sign-reversal framework, 7 out of 30 sign reversals (23%) would be interpreted as evidence that approximately 46% of the underlying population effects in this set are modeled as exactly zero (i.e., that H0 is true for about 46% of the effects).

To compare these results more directly to Wilson and Wixted’s analysis, it is necessary to condition on non-significant replication outcomes, because ManyLabs5 selected studies based on replication failure rather than original significance alone. Among the non-significant replication results, 25 sign reversals occurred out of 75 estimates, corresponding to a rate of 33%, which would imply a false-positive rate of approximately 66% under Wilson and Wixted’s framework. Although this estimate is somewhat higher, both analyses would be interpreted as implying a large fraction of false positives—on the order of one-half—among the original significant findings within that framework.

To conduct a z-curve analysis, I transformed the effect sizes (r) in ManyLabs5 (Table 3) into d-values and used the reported confidence intervals to compute standard errors, SE = (d upper − d lower)/3.92, and corresponding z-values, z = d/SE. I fitted a z-curve model that allows for selection on statistical significance (Bartos & Schimmack, 2022; Brunner & Schimmack, 2020) to the 10 significant original results. I fitted a second z-curve model to the 30 replication results, treating this set as unselected (i.e., without modeling selection on significance).

The z-curve for the 10 original results shows evidence consistent with strong selection on statistical significance, despite the small set of studies. Although all original results are statistically significant, the estimated expected discovery rate is only 8%, and the upper limit of the 95% confidence interval is 61%, well below 100%. Visual inspection of the z-curve plot also shows a concentration of results just above the significance threshold (z = 1.96) and none just below it, even though sampling variation does not create a discontinuity between results with p = .04 and p = .06.

The expected replication rate (ERR) is a model-based estimate of the average probability that an exact replication would yield a statistically significant result in the same direction. For the 10 original studies, ERR is 32%, but the confidence interval is wide (3% to 70%). The lower bound near 3% is close to the directional false-alarm rate under a two-sided test when the true effect is zero (α/2 = 2.5%), meaning that the data are compatible with the extreme-null scenario in which all underlying effects are zero and the original significant results reflect selection. This does not constitute an estimate of the false-positive rate; rather, it indicates that the data are too limited to rule out that worst-case possibility. At the same time, the same results are also compatible with an alternative scenario in which all underlying effects are non-zero but power is low across studies.

For the 30 replication results, the z-curve model provides a reasonable fit to the observed distribution, which supports the use of a model that does not assume selection on statistical significance. In this context, the key quantity is the expected discovery rate (EDR), which can be interpreted as a model-based estimate of the average true power of the 30 replication studies. The estimated EDR is 17%. This value is lower than the corresponding estimate based on the original studies, despite increases in sample sizes and statistical power in the replication attempts. This pattern illustrates that ERR estimates derived from biased original studies tend to be overly optimistic predictors of actual replication outcomes (Bartos & Schimmack, 2022). In contrast, the average power of the replication studies can be estimated more directly because the model does not need to correct for selection bias.

A key implication is that the observed rate of sign reversals (23%) could have been generated by a set of studies in which all null hypotheses are false but average power is low (around 17%). However, the z-curve analysis also shows that even a sample of 30 studies is insufficient to draw precise conclusions about false positive rates in social psychology. Following Sorić (1989), the EDR can be used to derive an upper bound on the false discovery rate (FDR), that is, the maximum proportion of false positives consistent with the observed discovery rate. Based on this approach, the FDR ranges from 11% to 100%. To rule out high false positive risks, studies would need higher power, narrower confidence intervals, or more stringent significance thresholds.

Conclusion

This blog post compared Wilson and Wixted’s use of sign reversals to estimate false discovery rates with z-curve estimates of false discovery risk. I showed that Wilson and Wixted’s approach rests on implausible assumptions. Most importantly, it assumes that sign reversals occur only when the true effect is exactly zero. It does not allow for sign reversals under nonzero effects, which can occur when all null hypotheses are false but tests of these hypotheses have low power.

The z-curve analysis of 30 replication estimates in the ML5 project shows that low average power is a plausible explanation for sign reversals even without invoking a high false-positive rate. Even with the larger samples used in ML5, the data are not precise enough to draw firm conclusions about false positives in social psychology. A key problem remains the fundamental asymmetry of NHST: it makes it possible to reject null hypotheses, but it does not allow researchers to demonstrate that an effect is (practically) zero without very high precision.

The solution is to define the null hypothesis as a region of effect sizes that are so small that they are practically meaningless. The actual level may vary across domains, but a reasonable default is Cohen’s criterion for a small effect size, r = .1 or d = .2. By this criterion, only two of the replication studies in ML5 had sample sizes that were large enough to produce results that ruled out effect sizes of at least r = .1 with adequate precision. Other replications still lacked precision to do so. Interestingly, five of the ten original statistically significant results also failed to rule out effect sizes of at least r = .1, because their confidence intervals included r = .10. Thus, these studies at best provided suggestive evidence about the sign of an effect, but no evidence that the effect size is practically meaningful.

The broader lesson is that any serious discussion of false positives in social psychology requires (a) a specification of what counts as an “absence of an effect” in practice, using minimum effect sizes of interest that can be empirically tested, (b) large sample sizes that allow precise estimation of effect sizes, and (c) unbiased reporting of results. A few registered replication reports come close to this ideal, but even these results have failed to resolve controversies because effect sizes close to zero in the predicted direction remain ambiguous without a clearly specified threshold for practical importance. To avoid endless controversies and futile replication studies, it is necessary to specify minimum effect sizes of interest before data are collected.

In practice, this means designing studies so that the confidence interval can exclude effects larger than the minimum effect size of interest, rather than merely achieving p < .05 against a point null of zero. Conceptually, this is closely related to specifying the null hypothesis as a minimum effect size and using a directional test, rather than using a two-sided test against a nil null of exactly zero. Put differently, the problem is not null hypothesis testing per se, but nil hypothesis testing (Cohen, 1994).

What a Decade of P-Curve Tells Us About False-Positive Psychology

The File-Drawer Problem

A single study is rarely enough to provide sufficient evidence for a theoretically derived hypothesis. To make sense of inconsistent results across multiple studies, psychologists began to conduct meta-analysis. The key contribution of meta-analyses is that pooling evidence from multiple studies reduces sampling error and allows for more precise estimation of effect sizes.

The key problem of meta-analysis is the assumption that individual studies are an unbiased sample of all studies that were conducted. Selective publishing of statistically significant results in favor of a prediction leads to inflated effect size estimates. This problem has been dubbed the file drawer problem. Whereas significant results are submitted for publication, non-significant results are put into a file drawer.

Rosenthal (1979) pointed out that a literature consisting entirely of statistically significant findings could, in principle, reflect no true effects. However, such a scenario was often considered unlikely under the assumption of honest testing with a fixed Type I error rate, because studies without real effects produce a significant result only about 1 out of 20 times when the error rate is controlled with alpha = .05. In addition, Rosenthal proposed a statistic, fail-safe N, to evaluate this risk, and meta-analyses often found that fail-safe N was large enough to infer a real effect.

The assessment of the published literature in psychology shifted dramatically in the early 2010s. Critically, Simmons, Nelson, and Simonsohn (2011) showed with simulations that a few statistical tricks could increase the probability of significant results without real effects from 1:20 to nearly 1:2. Even consistent statistically significant results in several studies were no longer unlikely. Presenting 9 significant results would not require 180 studies, but only 18 (Bem, 2011), or even fewer with more extreme use of questionable statistical practices that later became known as p-hacking. This highly cited article created a crisis of confidence in single studies, and by extension also in meta-analytic findings.


The False Positive Detection Problem

A few years later, Simonsohn, Nelson, and Simmons (2014) published a statistical method, p-curve, to probe the credibility of sets of statistically significant results, often drawn from meta-analyses. They referred to this method as a “key to the file drawer.” The analogy is potentially confusing. P-curve does not test whether publication bias exists, nor does it determine whether questionable statistical practices were used. It also does not estimate how many studies are in the proverbial file drawer. In fact, p-hacking implies that file drawers can be small, even if significant results are false positives. When p-hacking is present, the size of the file drawer is therefore no longer informative.

What p-curve does, and what it does better than fail-safe N, is to assess whether the observed set of statistically significant results is inconsistent with the hypothesis that all tested effects are exactly zero. Simonsohn et al. (2014) call this property evidential value. Formally, significance tests are applied to the distribution of significant p-values to evaluate the null hypothesis implied by this scenario. When this hypothesis can be rejected using conventional significance tests, the data are said to have evidential value. Later versions of p-curve also include stronger tests, but the underlying logic remains the same.

Equipped with a new diagnostic tool, psychologists had a different way to evaluate published studies. While p-curve still shares a limitation of significance testing—namely that it cannot provide affirmative evidence for the null hypothesis, such as the claim that all published significant results are false positives—it can nevertheless show that a set of studies fails to provide evidence against this extreme null hypothesis. Lack of evidence is still valuable information, especially when a set of statistically significant results appears to suggest strong support for a hypothesis, but this support is potentially driven by selective reporting or p-hacking rather than true effects.

P-Curve Coding

P-curve made it possible to evaluate the hypothesis that many, if not most (Ioannidis, 2005), published results are false positives. If this were the case, many p-curve meta-analyses of a specific hypothesis should be flat or left-skewed. In contrast, true hypotheses should produce right-skewed p-curves. Surprisingly, this simple approach to examine the false positive rate has not been systematically applied.

I conducted a review of p-curve articles to see what we have learned about false positives from a decade of p-curve analyses. The article introducing p-curve has been cited more than 1,000 times (WoS, December 30, 2025). I reviewed two samples of articles. First, I sampled the most highly cited articles. These articles are of interest because they may introduce many readers to p-curve, including readers who are not experts in meta-analysis. These articles are also more likely to report high-visibility results. The second set of articles focused on the most recent articles. The rationale is that more recent articles reflect current practice in how p-curve is used and how p-curve results are interpreted.

P-curve results were coded first in terms of evidential value (right-skewed vs. not right-skewed). The second classification concerned the proper interpretation of right-skewed p-curves. Correct interpretations were limited to claims about evidential value. However, some articles misinterpreted p-curve as a bias test and falsely inferred a low risk of bias from a p-curve with evidential value.

The coding scheme had three categories. First, articles that did not report a p-curve analysis were coded as irrelevant. Second, articles that reported a p-curve analysis and correctly limited discussion to evidential value were coded as correct. Third, some articles reported a p-curve analysis but made claims about bias, selection bias, or p-hacking that are invalid. Namely, these articles interpreted results showing evidential value to conclude that publication bias or p-hacking were not a concern. This conclusion is invalid because data can show evidential value while biases can still inflate effect size estimates simultaneously. These articles were coded as incorrect.

Articles were found using WebOfScience. Articles classified as editorial material were excluded. The list of coded articles and their coding is available on the Open Science Framework (OSF) project.

P-Curve Results

I coded 142 articles. A large number of them (k = 95; 67%) cited the p-curve article but did not report a p-curve analysis. An additional two articles stated that a p-curve analysis had been conducted but did not provide a clear description of the results. All 45 articles that reported a p-curve analysis found evidential value. Some of these articles showed flat p-curves for specific subsets of studies, but this pattern was attributed to theoretically meaningful moderators (e.g., Tucker-Drob & Bates, 2015). Importantly, none of the reviewed p-curve analyses suggested that all reported results were false positives.

To further probe this issue, I conducted an automated search of all 990 abstracts retrieved from Web of Science for references to p-curve results indicating no evidential value or flat p-curves. This search did not identify a single abstract reporting such a result.

In terms of interpretations, the results are also notable. More articles misrepresented p-curve as a bias test (k = 28) than correctly presented p-curve as a test of evidential value. Because p-curves were almost always right-skewed, these misinterpretations frequently led authors to infer a low risk of bias, which is not a valid inference from a right-skewed p-curve.

Once, p-curve was even used to discount evidence of bias obtained with other methods. For example, “Funnel plot analysis showed evidence of publication bias, but p-curve analysis suggested that our results could not be caused by selective reporting” (Goubran et al., 2025).

Discussion

Two influential theoretical articles raised concerns that many published rejections of null hypotheses could be false positive results (Ioannidis, 2005; Simmons et al., 2011). P-curve provides an opportunity to evaluate this prediction empirically, but the evidence obtained in p-curve meta-analyses has not been systematically examined. I found that p-curve results always showed evidential value. This finding is in stark contrast to scenarios that suggest the majority of statistically significant results are false (Ioannidis, 2005).

At the same time, p-curve is often misunderstood and misinterpreted as a bias test. This interpretation may lead to a false sense of the credibility of published results. Just as replication failures do not justify the inference that the original result was a false positive (Maxwell et al., 2006), evidential value does not imply that results can be replicated.

There are several possible explanations for the failure to find evidence of false positive results in meta-analyses. One explanation is that false positives are more likely to arise in individual studies than in meta-analyses, which require multiple studies testing the same hypothesis. Sustaining a literature of false positives would therefore require repeated and consistent use of extremely questionable research practices. Few researchers may be motivated to use extreme p-hacking repeatedly to force significant results in the absence of a real effect. Bem (2011) may represent an unusual case in that he appeared to be highly motivated to convince skeptical scientists of the existence of extrasensory perception and to present evidence that met prevailing methodological standards in experimental social psychology. More commonly, researchers may advance claims based on selective or suggestive evidence without attempting to build a cumulative evidential record.

Another explanation is that the statistical null-hypothesis is unlikely to be true (Cohen, 1994). What are the chances that an experimental manipulation has no effect whatsoever on behavior? Subliminal stimuli are often cited as candidates, but even in this literature concerns have been raised that effects may be driven by partial stimulus detection. In correlational research, it is even less likely that two variables have a true correlation of exactly zero. As a result, p-hacking may often inflate effect sizes rather than generate false positive results in the strict sense of rejecting a false null hypothesis.

The problem is when rejection of the nil-hypothesis is confused with credible evidence for a meaningful effect. For example, a p-curve analysis of ego depletion shows evidential value (Carter et al., 2019), but even the original authors were unable to replicate the effect (Vohs et al., 2019). This example illustrates that evidential value is a necessary but not sufficient condition for a credible science. Even if effect sizes are not exactly zero, they can be dramatically inflated. As p-curve is limited to the assessment of evidential value, other methods are required to (a) assess whether published results are biased by selection or p-hacking, (b) estimate population effect sizes while correcting for bias, and (c) estimate the false positive risk in heterogeneous meta-analyses, where a subset of statistically significant results may be false positives.

However, it is also possible that p-curve results are biased and provide spurious evidence of evidential value, that is, evidential value itself may constitute a meta-level false positive. In this case, p-curve would falsely reject the null hypothesis that all statistically significant results are false positives. One possible source of bias is that studies with stronger (but false) evidence may be more likely to be included in meta-analyses than studies with weaker (false) evidence. For example, some researchers may p-hack to more stringent thresholds (e.g., α = .01) or apply Bonferroni corrections, while standard meta-analytic coding practices may mask these selection processes. However, p-hacking of this kind would be expected to produce left-skewed or flat p-curves, such that explaining the near-absence of flat p-curves would require the additional assumption that extreme p-hacking is rare. At present, this possibility cannot be ruled out, but it appears unlikely to account for the overwhelming predominance of right-skewed p-curves.

A more plausible explanation is selective reporting of p-curve results. Because reporting p-curve analyses is optional, meta-analysts may be more likely to include p-curve results when they show evidential value and omit them when p-curves are flat or left-skewed. Evaluating this form of meta-analytic selection bias requires auditing meta-analyses that did not report p-curve results and applying the method retrospectively.


Conclusion

The most important finding is that concerns about many false positive results in psychology journals are not based on empirical evidence. False positives in single studies are not important because no single study can serve as an empirical foundation for a theory. There is no evidence that entire literatures are just a collection of false positive results. This does not mean that published results are credible. Publication bias, inflation of effect sizes, low replicability, method factors in correlational studies, and lack of construct validation remains serious obstacles that have sometimes been overshadowed by concerns about false positive results. These issues deserve more attention in the future.


Frequently Asked Questions about Z-Curve

under development

Can’t find what you are looking for?
1. Ask an AI to search replicationindex.com to find answers that are not here)
2. Send me an email and I will answer your question and add it to the FAQ list.

Does z-curve offer options for small sample (small-N) literatures like animal research?

Short answer:
Yes — z-curve 3.0 adds new transformation methods and a t-curve option that make the method more appropriate for analyses involving small samples (e.g., N < 30). These options are designed to mitigate biases that arise when you convert small-sample test statistics to z-scores using standard normal approximations. Z-curve.3.0 also allows researchers to use t-distributions (t-curve) with a fixed df that is more similar to the distributions of test statistics from small samples than the standard normal distribution.

Details:

  • The z-curve 3.0 tutorial (Chapter 8) explains that instead of only converting p-values to z-scores, you can now:
    • Try alternative transformations of t-values that better reflect their sampling distribution, and
    • Use a direct t-curve model that fits t-distributions with specified degrees of freedom instead of forcing a normal approximation. This “t-curve” option is recommended when studies have similar and genuinely small degrees of freedom (like many animal experiments). (replicationindex.com)
  • These improvements help reduce bias introduced by naïve normal transformations, though they don’t completely eliminate all small-sample challenges, and performance can still be unstable when degrees of freedom vary widely or are extremely small. (replicationindex.com)

Link to the tutorial:
🔗 Z-Curve 3.0 Tutorial (Introduction and links to all chapters)https://replicationindex.com/2025/07/08/z-curve-tutorial-introduction/ (replicationindex.com)


A Z-Curve of Epidemiology

Concerns about credibility are widespread, but they often do not clearly distinguish between different sciences. One problem is that it is difficult to compare sciences quantitatively. One way to do so is to examine the strength of empirical evidence. We cannot compare effect sizes across sciences, but we can compare how precise effect size estimates are and how often rejections of null hypotheses may be false.

The first “science-wide” study was based on empirical results in medicine (Jager & Leek, 2013). Their methods and results were challenged, and it took some time before alternative methods became available. A better method is z-curve (Bartos & Schimmack, 2022; Brunner & Schimmack, 2020). Z-curve has been mostly used in psychology. A comparison with medicine showed that clinical trials have less power, but report results more honestly than psycholgy, where focal tests confirm predicts with success rates over 90% (Schimmack, 2020; Schimmack & Bartos, 2023).

A recent article extracted confidence intervals from four epidemiology journals.

Ackley, S. F., Andrews, R. M., Seaman, C., Flanders, M., Chen, R., Wang, J., Lopes, G., Sims, K. D., Buto, P., Ferguson, E., Allen, I. E., & Glymour, M. M. (2025). Trends in the distribution of P values in epidemiology journals: A statistical, P-curve, and simulation study. American Journal of Epidemiology, 194(12), 3630–3639. https://doi.org/10.1093/aje/kwaf184

The authors were not aware of z-curve, but I was able to analyze their shared data. I examined trends over time and found no evidence that z-curve parameters correlated with publication year. Thus, the results are representative of the literature. An initial analysis with standard z-curve showed no evidence of selection bias. Therefore, I fitted the full data, including non-significant results.

The key findings are: (a) The observed and expected discovery rates are 91%. This means that 91% of the results are significant, but the reason is not selection bias – as it is often in psycholoy – but high power to reject false null hypotheses; (b) a very low false positive risk even with alpha = .05, and a high probability that an exact replication study with a new sample from the same population would produce a significant result again. However, there is some evidence of p-hacking. That is there are more just significant results (2 to 2.4) than the model predicts, Excessive Just Significance Test, p = .0008. Visual inspection of the plot shows, however, that the effect size is small, observed 0.25%, expected 0.24%, and that statistical significance reflects mainly the large sample size.

In short, this is a healthy literature that instills confidence in epidemiological research. The reason is that epidemiological studies typically have large sample sizes and aim for precise effect size estimation. With this goal in mind, studies have high power to reject the null hypothesis of no effect, if only because doing so is not very informative. In contrast, psychologists often use small samples that are sometimes not even large enough to test a null hypothesis properly. Comparing epidemiology with psychology is therefore a bit like comparing apples and oranges, but this false comparison is often made when science as a whole is evaluated. In reality, different sciences face different problems. Low power and replicability are a problem for sciences that invest few resources in many studies, such as psychology. We cannot generalize from replication failures in these sciences to other sciences.

For psychology, effect sizes estimation mostly remains a scientific utopia, but the z-curve of epidemiology shows what that utopia looks like.

A Response to Pek et al.’s Commentary on Z-Curve: Clarifying the Assumptions of Selection Models

This blog post was a quick response to Pek et al.’s biased criticism of z-curve in a commentary on our z-curve analysis of the emotion literature. We have now written a shorter, more focused, and useful rebuttal that is now under review at Cognition and Emotion. You can see the preprint here.


“Windmills are evil” (Don Quixote cited by Trump)

“Zcurve is made by the devil” (Pek et al., 2026)

Preamble

Ideal conceptions of science have a set of rules that help to distinguish beliefs from knowledge. Actual science is a game with few rules. Anything goes (Feyerabend), if you can sell it to an editor of a peer-reviewed journal. US American psychologist also conflate the meaning of freedom in “Freedom of speech” and “academic freedom” to assume that there are no standards for truth in science, just like there are none in American politics. The game is to get more publications, citations, views, and clicks, and truth is decided by the winner of popularity contests. Well, not to be outdone in this war, I am posting yet another blog post about Pek’s quixotian attacks on z-curve.

For context, Pek has already received an F by statistics professor Jerry Brunner for her nonsensical attacks on a statistical method (Brunner, 2024), but even criticism by a professor of statistics has not deterred her from repeating misinformation about z-curve. I call this willful incompetence; the inability to listen to feedback and to wonder whether somebody else could have more expertise than yourself. This is not to be confused with the Dunning-Kruger effect, where people have no feedback about their failures. Here failures are repeated again and again, despite strong feedback that errors are being made.

Context

One of the editors of Cognition and Emotion, Sander Koole, has been following our work and encouraged us to submit our work on the credibility of emotion research as an article to Cognition & Emotion. We were happy to do so. The manuscript was handled by the other editor Klaus Rothermund. In the first round of reviews, we received a factually incorrect and hostile review by an anonymous reviewer. We were able to address these false criticisms of z-curve and resubmitted the manuscript. In a new round of reviews, the hostile reviewer came up with simulation studies that showed z-curve fails. We showed that this is indeed the case in the simulations that used studies with N = 3 and 2 degrees of freedom. The problem here is not z-curve, but the transformation of t-values into z-values. When degrees of freedom are like those in the published literature we examined, this is not a problem. The article was finally accepted, but the hostile reviewer was allowed to write a commentary. At least, it wa now clear that the hostile reviewer was Pek.

I found out that the commentary is apparently accepted for publication when somebody sent me the link to it on ResearchGate and a friendly over to help with a rebuttal. However, I could not wait and drafted a rebuttal with the help of ChatGPT. Importantly, I use ChatGPT to fact check claims and control my emotions, not to write for me. Below you can find a clear, point by point response to all the factually incorrect claims about z-curve made by Pek et al. that passed whatever counts as human peer-review at Cognition and Emotion.

Rebuttal

Abstract

What is the Expected Discovery Rate?

EDR also lacks a clear interpretation in relation to credibility because it reflects both the average pre-data power of tests and the estimated average population effect size for studied effects.”

This sentence is unclear and introduces several poorly defined or conflated concepts. In particular, it confuses the meaning of the Expected Discovery Rate (EDR) and misrepresents what z-curve is designed to estimate.

A clear and correct definition of the Expected Discovery Rate (EDR) is that it is an estimate of the average true power of a set of studies. Each empirical study has an unknown population effect size and is subject to sampling error. The observed effect size is therefore a function of these two components. In standard null-hypothesis significance testing, the observed effect size is converted into a test statistic and a p-value, and the null hypothesis is rejected when the p-value falls below a prespecified criterion, typically α = .05.

Hypothetically, if the population effect size were known, one could specify the sampling distribution of the test statistic and compute the probability that the study would yield a statistically significant result—that is, its power (Cohen, 1988). The difficulty, of course, is that the true population effect size is unknown. However, when one considers a large set of studies, the distribution of observed p-values (or equivalently, z-values) provides information about the average true power of those studies. This is the quantity that z-curve seeks to estimate.

Average true power predicts the proportion of statistically significant results that should be observed in an actual body of studies (Brunner & Schimmack, 2020), in much the same way that the probability of heads predicts the proportion of heads in a long series of coin flips. The realized outcome will deviate from this expectation due to sampling error—for example, flipping a fair coin 100 times will rarely yield exactly 50 heads—but large deviations from the expected proportion would indicate that the assumed probability is incorrect. Analogously, if a set of studies has an average true power of 80%, the observed discovery rate should be close to 80%. Substantially lower rates imply that the true power of the studies is lower than assumed.

Crucially, true power has nothing to do with pre-study (or pre-data) power, contrary to the claim made by Pek et al. Pre-study power is a hypothetical quantity based on researchers’ assumptions—often optimistic or wishful—about population effect sizes. These beliefs can influence study design decisions, such as planned sample size, but they cannot influence the outcome of a study. Study outcomes are determined by the actual population effect size and sampling variability, not by researchers’ expectations.

Pek et al. therefore conflate hypothetical pre-study power with true power in their description of EDR. This conflation is a fundamental conceptual error. Hypothetical power is irrelevant for interpreting observed results or evaluating their credibility. What matters for assessing the credibility of a body of empirical findings is the true power of the studies to produce statistically significant results, and EDR is explicitly designed to estimate that quantity.

Pek et al.’s misunderstanding of the z-curve estimands (i.e., the parameters the method is designed to estimate) undermines their more specific criticisms. If a critique misidentifies the target quantity, then objections about bias, consistency, or interpretability are no longer diagnostics of the method as defined; they are diagnostics of a different construct.

The situation is analogous to Bayesian critiques of NHST that proceed from an incorrect description of what p-values or Type I error rates mean. In that case, the criticism may sound principled, but it does not actually engage the inferential object used in NHST. Likewise here, Pek et al.’s argument rests on a category error about “power,” conflating hypothetical pre-study power (a design-stage quantity based on assumed effect sizes) with true power (the long-run success probability implied by the actual population effects and the study designs). Because z-curve’s EDR is an estimand tied to the latter, not the former, their critique is anchored in conceptual rather than empirical disagreement.

2. Z-Curve Does Not Follow the Law of Large Numbers

.“simulation results further demonstrate that z-curve estimators can often be biased and inconsistent (i.e., they fail to follow the Law of Large Numbers), leading to potentially misleading conclusions.”

This statement is scientifically improper as written, for three reasons.

First, it generalizes from a limited set of simulation conditions to z-curve as a method in general. A simulation can establish that an estimator performs poorly under the specific data-generating process that was simulated, but it cannot justify a blanket claim about “z-curve estimators” across applications unless the simulated conditions represent the method’s intended model and cover the relevant range of plausible selection mechanisms. Pek et al. do not make those limitations explicit in the abstract, where readers typically take broad claims at face value.

Second, the statement is presented as if Pek et al.’s simulations settle the question, while omitting that z-curve has already been evaluated in extensive prior simulation work. That omission is not neutral: it creates the impression that the authors’ results are uniquely diagnostic, rather than one contribution within an existing validation literature. Because this point has been raised previously, continuing to omit it is not a minor oversight; it materially misleads readers about the evidentiary base for the method.

Third, and most importantly, their claim that z-curve estimates “fail to follow the Law of Large Numbers” is incorrect. Z-curve estimates are subject to ordinary sampling error, just like any other estimator based on finite data. A simple analogy is coin flipping: flipping a fair coin 10 times can, by chance, produce 10 heads, but flipping it 10,000 times will not produce 10,000 heads by chance. The same logic applies to z-curve. With a small number of studies, the estimated EDR can deviate substantially from its population value due to sampling variability; as the number of studies increases, those random deviations shrink. This is exactly why z-curve confidence intervals narrow as the number of included studies grows: sampling error decreases as the amount of information increases. Nothing about z-curve exempts it from this basic statistical principle. Suggesting otherwise implies that z-curve is somehow unique in how sampling error operates, when in fact it is a standard statistical model that estimates population parameters from observed data and, accordingly, becomes more precise as the sample size increases.

3. Sweeping Conclusion Not Supported by Evidence

“Accordingly, we do not recommend using 𝑍-curve to evaluate research findings.”

Based on these misrepresentations of z-curve, Pek et al. make a sweeping recommendation that z-curve estimates provide no useful information for evaluating published research and should be ignored. This recommendation is not only disproportionate to the issues they raise; it is also misaligned with the practical needs of emotion researchers. Researchers in this area have a legitimate interest in whether their literature resembles domains with comparatively strong replication performance or domains where replication has been markedly weaker. For example, a reasonable applied question is whether the published record in emotion research looks more like areas of cognitive psychology, where about 50% of results replicate or more like social psychology, where about 25% replicate (Open Science Collaboration, 2015).

Z-curve is not a crystal ball capable of predicting the outcome of any particular future replication with certainty. Rather, the appropriate claim is more modest and more useful: z-curve provides model-based estimates that can help distinguish bodies of evidence that are broadly consistent with high average evidential strength from those that are more consistent with low average evidential strength and substantial selection. Used in that way, z-curve can assist emotion researchers in critically appraising decades of published results without requiring the field to replicate every study individually.

4. Ignoring the Replication Crisis That Led to The Development of Z-curve

We advocate for traditional meta-analytic methods, which have a well-established history of producing appropriate and reliable statistical conclusions regarding focal research findings”

This statement ignores that traditional meta-analysis ignores publication bias and have produced dramatically effect size estimates. The authors ignore the need to take biases into account to separate true findings from false ones.

Article

5. False definition of EDR (again)

EDR (cf. statistical power) is described as “the long-run success rate in a series of exact replication studies” (Brunner & Schimmack, 2020, p. 1)”.

This quotation describes statistical power in Brunner and Schimmack (2020), not the Expected Discovery Rate (EDR). The EDR was introduced later in Bartoš and Schimmack (2022) as part of z-curve 2.0, and, as described above, the EDR is an estimate of average true power. While the power of a single study can be defined in terms of the expected long-run frequency of significant results (Cohen, 1988), it can also be defined as the probability of obtaining a significant result in a single study. This is the typical use of power in a priori power calculations to plan a specific study. More importantly, the EDR is defined as the average true power of a set of unique studies and does not assume that these studies are exact replications.

Thus, the error is not merely a misplaced citation, but a substantive misrepresentation of what EDR is intended to estimate. Pek et al. import language used to motivate the concept of power in Brunner and Schimmack (2020) and incorrectly present it as a defining interpretation of EDR. This move obscures the fact that EDR is a summary parameter of a heterogeneous literature, not a prediction about repeated replications of a single experiment.

6. Confusing Observed Data with Unobserved Population Parameters (Ontological Error)

Because z-curve analysis infers EDR from observed p-values, EDR can be understood as a measure of average observed power.

This statement is incorrect. To clarify the issue without delving into technical statistical terminology, consider a simple coin-toss example. Suppose we flip a coin that is unknown to us to be biased, producing heads 60% of the time, and we toss it 100 times. We observe 55 heads. In this situation, we have an observed outcome (55 heads), an unknown population parameter (the true probability of heads, 60%), and an unknown expected value (60 heads in 100 tosses). Based on the observed data, we attempt to estimate the true probability of heads or to test the hypothesis that the coin is fair (i.e., that the expected number of heads is 50 out of 100). Importantly, we do not confuse the observed outcome with the true probability; rather, we use the observed outcome as noisy information about an underlying parameter. That is, we treat 55 as a reasonable estimate of the true power and use confidence intervals to see whether it includes 50. If it does not, we can reject the hypothesis that it is fair.

Estimating average true power works in exactly the same way. If 100 honestly reported studies yield 36 statistically significant results, the best estimate of the average true power of these studies is 36%, and we would expect a similar discovery rate if the same 100 studies were repeated under identical conditions (Open Science Collaboration, 2015). Of course, we recognize that the observed rate of 36% is influenced by sampling error and that a replication might yield, for example, 35 or 37 significant results. The observed outcome is therefore treated as an estimate of an unknown parameter, not as the parameter itself. The true average power is probably not 36%, but it is somewhere around this estimate and not 80%.

The problem with so-called “observed power” calculations arises precisely when this distinction is ignored—when estimates derived from noisy data are mistaken for true underlying parameters. This is the issue discussed by Hoenig and Heisey (2001). There is nothing inherently wrong with computing power using effect-size estimates from a study (see, e.g., Yuan & Maxwell, 200x); the problem arises when sampling error is ignored and estimated quantities are treated as if they were known population values. In a single study, the observed power could be 36% power, and the true power is 80%, but in a reasonably large set of studies this will not happen.

Z-curve explicitly treats average true power as an unknown population parameter and uses the distribution of observed p-values to estimate it. Moreover, z-curve quantifies the uncertainty of this estimate by providing confidence intervals, and correct interpretations of z-curve results explicitly take this uncertainty into account. Thus, the alleged ontological error attributed to z-curve reflects a misunderstanding of basic statistical inference rather than a flaw in the method itself.

7. Modeling Sampling Error of Z-Values

z-curve analysis assumes independence among the K analyzed p-values, making the inclusion criteria for p-values critical to defining the population of inference…. Including multiple 𝑝-values from the same sampling unit (e.g., an article) violates the independence assumption, as 𝑝-values within a sampling unit are often correlated. Such dependence can introduce bias, especially because the 𝑍-curve does not account for unequal numbers of 𝑝-values across sampling units or within-unit correlations.

It is true that z-curve assumes that sampling error for a specific result converted into a z-value follows the standard normal distribution with a variance of 1. Correlations among results can lead to violations of this assumption. However, this does not imply that z-curve “fails” in the presence of any dependence, nor does it justify treating this point as a decisive objection to our application. Rather, it means that analysts should take reasonable steps to limit dependence or to use inference procedures that are robust to clustering of results within studies or articles.

A conservative way to meet the independence assumption is to select only one test per study or one test per article in multiple-study articles where the origin of results is not clear. It is also possible to use more than one result per study by computing confidence intervals that sample one result at random, but different results for each sample with replacement. This is closely related to standard practices in meta-analysis for handling multiple dependent effects per study, where uncertainty is estimated with resampling or hierarchical approaches rather than by treating every effect size as independent. The practical impact of dependence also depends on the extent of clustering. In z-curve applications with large sets of articles (e.g., all articles in Cognition and Emotion), the influence of modest dependence is typically limited, and in our application we obtain similar estimates whether we treat results as independent or use clustered bootstrapping to compute uncertainty. Thus, even if Pek et al.’s point is granted in principle, it does not materially change the interpretation of our empirical findings about the emotion literature. Although we pointed this out in our previous review, the authors continue to misrepresent how our z-curve analyses addressed non-independence among p-values (e.g., by using clustered bootstrapping and/or one-test-per-study rules).

8. Automatic Extraction of Test Statistics

Unsurprisingly, automated text mining methods for extracting test statistics has been criticized for its inability to reliably identify 𝑝-values suitable for forensic meta-analysis, such as 𝑍-curve analysis.

This statement fails to take into account advantages and disadvantageous of automatically extracting results from articles. The advantages are that we have nearly population level data for research in the top two emotion journals. This makes it possible to examine time trends (did power increase; did selection bias decrease). The main drawback is that automatic extraction does not, by itself, distinguish between focal tests (i.e., tests that bear directly on an article’s key claim) and non-focal tests. We are explicit about this limitation and also included analyses of hand-coded focal analyses to supplement the results based on automatically extracted test statistics. Importantly, our conclusion that z-curve estimates are similar across these coding approaches is consistent with an often-overlooked feature of Cohen’s (1962) classic assessment of statistical power: Cohen explicitly distinguished between focal and non-focal tests and reported that this distinction did not materially change his inferences about typical power. In this respect, our hand-coded focal analyses suggest that the inclusion of non-focal tests in large-scale automated extraction is not necessarily a fatal limitation for estimating average evidential strength at the level of a literature, although it remains essential to be transparent about what is being sampled and to supplement automated extraction with focal coding when possible.

Pek et al. accurately describe our automated extraction procedure as relying on reported test statistics (e.g., t, F), which are then converted into z-values for z-curve analysis. However, their subsequent criticism shifts to objections that apply specifically to analyses based on scraped p-values, such as concerns about rounded or imprecise information about p-values (e.g., p < .05) and their suitability for forensic meta-analysis. This criticism is valid, but it is also the reason why we do not use p-values for z-curve analysis when better information is available.

9. Pek et al.’s Simulation Study: What it really shows

Pek et al.’s description of their simulation study is confusing. They call one condition “no bias” and the other “bias.” The problem here is that “no bias” refers to a simulation in which selection bias is present. The bias here assumes that α = .05 serves as the selection mechanism. That is, studies are selected based on statistical significance, but there is no additional selection among statistically significant results. Most importantly, it is assumed that there is no further selection based on effect sizes.

Pek et al.’s simulation of “bias” instead implies that researchers would not publish a result if d = .2, but would publish it if d = .5, consistent with a selection mechanism that favors larger observed effects among statistically significant results. Importantly, their simulation does not generalize to other violations of the assumptions underlying z-curve. In particular, it represents only one specific form of within-significance selection and does not address alternative selection mechanisms that have been widely discussed in the literature.

For example, a major concern about the credibility of psychological research is p-hacking, where researchers use flexibility in data analysis to obtain statistically significant results from studies with low power. P-hacking has the opposite effect of Pek et al.’s simulated bias. Rather than boosting the representation of studies with high power, studies with low power are over-represented among the statistically significant results.

Pek et al. are correct that z-curve estimates depend on assumptions about the selection mechanism, but this is not a fundamental problem. All selection models necessarily rely on assumptions about how studies enter the published literature, and different models make different assumptions (e.g., selection on significance thresholds, on p-value intervals, or on effect sizes). Because the specific practices that generate bias in published results are unknown, no selection model can avoid such assumptions, and z-curve’s assumptions are neither unique nor unusually restrictive.

Pek et al.’s simulations are also confusing because they include scenarios in which all p-values are reported and analyzed. These conditions are not relevant for standard applications of z-curve that assume and usually find evidence of bias. Accordingly, we focus on the simulations that match the usual publication environment, in which z-curve is fitted to the distribution of statistically significant z-values.

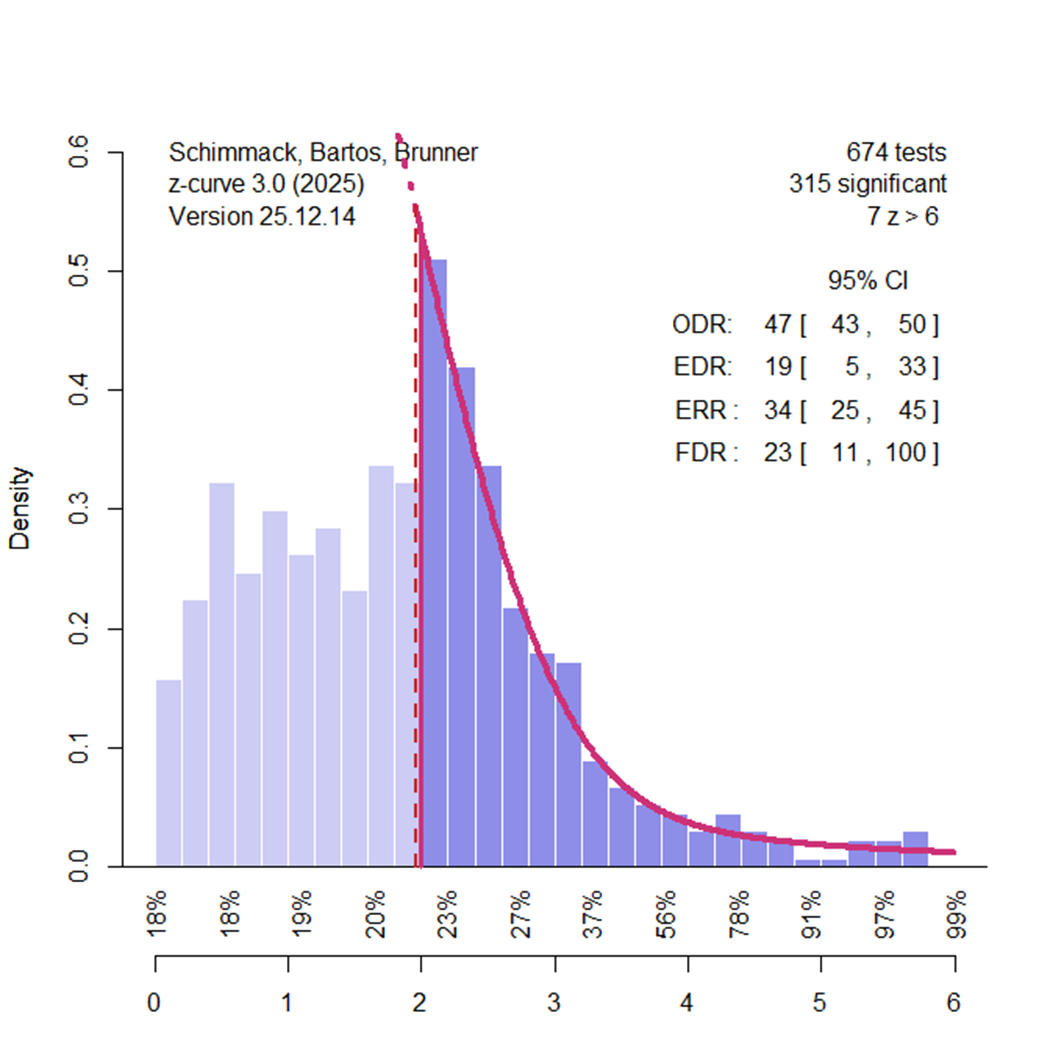
Pek et al.’s figures are also easy to misinterpret because the y-axis is restricted to a very narrow range of values. Although EDR estimates can in principle range from alpha (5% )to 100%, the y-axis in Figure 1a spans only approximately 60% to 85%. This makes estimation errors look big visually, when they are numerically relatively small.

In the relevant condition, the true EDR is 72.5%. For small sets of studies (e.g., K = 100), the estimated EDR falls roughly 10 percentage points below this value, a deviation that is visually exaggerated by the truncated y-axis. As the number of studies increases the point estimate approaches the true value. In short, Pek et al.’s simulation reproduces Bartos and Schimmack’s results that z-curve estimates are fairly accurate when bias is simply selection for significance.

The simulation based on selection by strength of evidence leads to an overestimation of the EDR. Here smaller samples appear more accurate because they underestimated the EDR and the two biases cancel out. More relevant is that with large samples, z-curve overestimates true average power by about 10 percentage points. This value is limited to one specific simulation of bias and could be larger or smaller. The main point of this simulation is to show that z-curve estimates depend on the type of selection bias in a set of studies. The simulation does not tell us the nature of actual selection biases and the amount of bias in z-curve estimates that violations of the selection assumption introduce.

From a practical point of view an overestimation by 10 percentage points is not fatal.  If the EDR estimate is 80% and the true average power is only 70%, the literature is still credible. The problem is bigger with literatures that already have low EDRs like experimental social psychology. With an EDR of 21% a 10 percentage point correction would reduce the EDR to 11% and the lower bound of the CI would include 5% (Schimmack, 2020), implying that all significant results could be false positives. Thus, Pek et al.’s simulation suggests that z-curve estimates may be overly optimistic. In fact, z-curve overestimates replicability compared to actual replication outcomes in the reproducibility project (Open Science Collaboration, 2015). Pek et al.’s simulations suggest that selection for effect sizes could be reason, but other reasons cannot be ruled out.

Simulation results for the False Discovery Risk and bias (Observed Discovery Rate minus Expected Discoery Rate) are the same because they are a direct function of the EDR. The Expected Replication Rate (ERR), average true power of the significant results, is a different parameter, but shows the same pattern.

In short, Pek et al.’s simulations show that z-curve estimates depend on the actual selection processes that are unknown, but that does not invalidate z-curve estimates. Especially important is that z-curve evaluations of credibility are asymmetrical (Schimmack, 2012). Low values raise concerns about a literature, but high values do not ensure credibility (Soto & Schimmack, 2024).

Specific Criticism of the Z-Curve Results in the Emotion Literature

10. Automatic Extraction (Again)

Based on our discussion on the importance of determining independent sampling units, formulating a well-defined research question, establishing rigorous inclusion and exclusion criteria for 𝑝-values, and conducting thorough quality checks on selected 𝑝-values, we have strong reservations about the methods used in SS2024.” (Pek et al.)

As already mentioned, the population of all statistical hypothesis tests reported in a literature is meaningful for researchers in this area. Concerns about low replicability and high false positive rates have undermined the credibility of the empirical foundations of psychological research. We examined this question empirically using all available statistical test results. This defines a clearly specified population of reported results and a well-defined research question. The key limitation remains that automatic extraction does not distinguish focal and non-focal results. We believe that information for all tests is still important. After all, why are they reported if they are entirely useless? Does it not matter whether a manipulation check was important or whether a predicted result was moderated by gender? Moreover, it is well known that focality is often determined only after results are known in order to construct a compelling narrative (Kerr, 1998). A prominent illustration is provided by Cesario, Plaks, and Higgins (2006), where a failure to replicate the original main effect was nonetheless presented as a successful conceptual replication based on a significant moderator effect.

Pek et al. further argue that analyzing all reported tests violates the independence assumption. However, our inference relied on bootstrapping with articles as the clustering unit, which is the appropriate approach when multiple test statistics are nested within articles and directly addresses the dependence they emphasize. In addition, SS2024 reports z-curve analyses based on hand-coded focal tests that are not subject to these objections; these results are not discussed in Pek et al.’s critique.

11. No Bias in Psychology

Even I f the 𝑍-curve estimates and their CIs are unbiased and exhibit proper coverage, SS2024’s claim of selection bias in emotional research – based on observing that.EDR for both journals were not contained within their respective 95% CIs for ODR – is dubious”. 

It is striking that Pek et al. question z-curve evidence of publication bias. Even setting aside z-curve entirely, it is difficult to defend the assumption of honest and unbiased reporting in psychology. Sterling (1959) already noted that success rates approaching those observed in the literature are implausible under unbiased reporting, and subsequent surveys have repeatedly documented overwhelmingly high rates of statistically significant findings (Sterling et al., 1995).

To dismiss z-curve evidence of selection bias as “dubious” would therefore require assuming that average true power in psychology is extraordinarily high. This assumption is inconsistent with longstanding evidence that psychological studies are typically underpowered to detect even moderate effect sizes, with average power estimates far below conventional benchmarks (Cohen, 1988). None of these well-established considerations appear to inform Pek et al.’s evaluation of z-curve, which treats its results in isolation from the broader empirical literature on publication bias and research credibility. In this broader context, the combination of extremely high observed discovery rates for focal tests and low EDR estimates—such as the EDR of 27% reported in SS2024—is neither surprising nor dubious, but aligns with conclusions drawn from independent approaches, including large-scale replication efforts (Open Science Collaboration, 2015).

12. Misunderstanding of Estimation

Inference using these estimators in the presence of bias would be misleading because the estimators converge onto an incorrect value.

This statement repeats the fallacy of drawing general conclusions about the interpretability of z-curve from a specific, stylized simulation. In addition, Pek et al.’s argument effectively treats point estimates as the sole inferential output of z-curve analyses while disregarding uncertainty. Point estimates are never exact representations of unknown population parameters. If this standard were applied consistently, virtually all empirical research would have to be dismissed on the grounds that estimates are imperfect. Instead, estimates must be interpreted in light of their associated uncertainty and reasonable assumptions about error.

For the 227 significant hand-coded focal tests, the point estimate of the EDR was 27%, with a confidence interval ranging from 10% to 67%. Even if one were to assume an overestimation of 10 percentage points, as suggested by Pek et al.’s most pessimistic simulation scenario, the adjusted estimate would be 17%, and the lower bound of the confidence interval would include 5%. Under such conditions, it cannot be ruled out that a substantial proportion—or even all—statistically significant focal results in this literature are false positives. Rather than undermining our conclusions, Pek et al.’s simulation therefore reinforces the concern that many focal findings in the emotion literature may lack evidential value. At the same time, the width of the confidence interval also allows for more optimistic scenarios. The appropriate response to this uncertainty is to code and analyze additional studies, not to dismiss z-curve results simply because they do not yield perfect estimates of unknown population parameters.

13. Conclusion Does Not Follow From the Arguments

𝑍-curve as a tool to index credibility faces fundamental challenges – both at the definitional and interpretational levels as well as in the statistical performance of its estimators.”

This conclusion does not follow from Pek et al.’s analyses. Their critique rests on selective simulations, treats point estimates as decisive while disregarding uncertainty, and evaluates z-curve in isolation from the broader literature on publication bias, statistical power, and replication. Rather than engaging with z-curve’s assumptions, scope, and documented performance under realistic conditions, their argument relies on narrow counterexamples that are then generalized to broad claims about invalidity.

More broadly, the article exemplifies a familiar pattern in which methodological tools are evaluated against unrealistic standards of perfection rather than by their ability to provide informative, uncertainty-qualified evidence under real-world conditions. Such standards would invalidate not only z-curve, but most statistical methods used in empirical science. When competing conclusions are presented about the credibility of a research literature, the appropriate response is not to dismiss imperfect tools, but to weigh the totality of evidence, assumptions, and robustness checks supporting each position.

We can debate whether the average true power of studies in the emotion literature is closer to 5% or 50%, but there is no plausible scenario under which average true power would justify success rates exceeding 90%. We can also debate the appropriate trade-off between false positives and false negatives, but it is equally clear that the standard significance criterion does not warrant the conclusion that no more than 5% of statistically significant results are false positives, especially in the presence of selection bias and low power. One may choose to dismiss z-curve results, but what cannot be justified is a return to uncorrected effect-size meta-analyses that assume unbiased reporting. Such approaches systematically inflate effect-size estimates and can even produce compelling meta-analytic evidence for effects that do not exist, as vividly illustrated by Bem’s (2011) meta-analysis of extrasensory perception findings.

Postscript

Ideally, the Schimmack-Pek controversy will attract some attention from human third parties with sufficient statistical expertise to understand the issues and weigh in on this important issue. As Pek et al. point out, a statistical tool that can distinguish credible and unbelievable research is needed. Effect size meta-analyses are also increasingly recognizing the need to correct for bias and new methods show promise. Z-curve is one tool among others. Rather than dismissing these attempts, we need to improve them, because we cannot go back to the time where psychologists were advised to err on the side of discovery (Bem, 2000).

2025: A Quantitative Review

First, a sigh of relief. We made it through 2025, despite the rise of evil in the world. Let’s all hope or pray that 2026 will be better. In our little and mostly harmless world of psychology, however, things were rather calm. Here are some stats from my blog post to review 2025.

Clicks and Engagement

Many of these stats are bots and 1second visits, but some are real humans who are interested in scientific psychology and how to make it better. As long as I see these levels of engagement, I feel encouraged to keep the blog going. Likes and comments are rare, but very much appreciated. As the saying goes, one comment is worth more than 1,000 visits.

Content

The posts about “Fast and Slow” are still the most viewed pages. Reconstruction of a train wreck is home to Kahneman’s humble response to the z-curve analysis of the priming chapter, but the “Meta-Scientific Perspective” post is a review of all chapters.

The surprising addition is my farewell to personality psychology. It was an emotional rant expressing my frustration with bad measurement practices and unwillingness to improve them in the field.

Personality Psychology: Bye Bye, Au revoir, Auf Wiedersehen – Replicability-Index

I was ready to give up on it entirely, but ironically, I am still teaching an undergraduate course on personality, which I define as the study of personality differences. Fortunately, there is enough research and open data that I can analyze myself that I can teach the course form a coherent scientific perspective. The textbook is now available on the blog.

Personality Science: The Science of Human Diversity – Replicability-Index

Another surprise is that the new post on terror management made the Top 10 list. I thank the author for including z-curve in their meta-analysis. The article shows that an entire literature with more than 800 studies can be made up of studies with low replicability and a high false positive risk. It also shows how z-curve is superior to p-curve that can only reject the null hypothesis that all (100%) of the studies are false positives, but not that 95% are.

R.I.P Terror Management: A Z-Curve Analysis – Replicability-Index

Below the Top 10 are still some noteworthy posts from 2025.

Why Uri Simonsohn is a Jerk – Replicability-Index (967 views)
I found an old email that referred to Uri as a jerk. The complaint was that the datacolada team are all about open science and criticism of others, but do not even allow people who are criticized to post an open response on their blog. No comments, please! I say that is not open science. That is just like legacy journals that do not publish comments they do not like (yes, I mean you Psychological Methods).

Review of “On the Poor Statistical Properties of the P-Curve Meta-Analytic Procedure” – Replicability-Index (657 views)

A related post features a critique of p-curve that later triggered a “no comments allowed” response by Uri on the datacolada blog. After 10 years of p-curve, it is fair to say that it has only produced one notable finding. Most of the time, p-curve shows evidential value; that is, we can reject the null hypothesis that all results are false positives. So, concerns about massive p-hacking in the false positive article are not empirically supported. The area of false positive paranoia is coming to an end. More on this, in a forthcoming post.

The Ideology versus the Science of Evolved Sex Differences – Replicability-Index (649 views)

My personality textbook includes a scientific review of the research on sex-differences. It debunks many stereotypes that are often dressed up as pseudo-scientific evolutionary wet dreams of sexist pseudo-scientists like Roy F. Baumeister, who still is treated by some psychologist as an eminent scholar. To be a science, psychology has to hold psychologists accountable to scientific standards. Otherwise, it is just a cult.

Psychologists really confuse academic freedom with “you can say the stupidest things”, like one article that compared use of AI to dishonest research practices.

Is Using AI in Science Really “Research Misconduct”? A Response to Guest & van Rooij – Replicability-Index (649 views)

Many of these articles could be published as blog posts, saving us (tax payers) money.

Traffic

Most of the traffic still comes from search engines and over 90% of this traffic comes from Google. Next is Facebook, where I maintain the Psychological Methods Discussion Group.
The group was very active during the Replication Crisis times, but little discussion occurs these days. I would love to move it somewhere else, but I have not found an easy and cheap alternative. Interestingly, Open Science advocates also do not seem to see value in hosting an open forum for discussion. I tried to post on APS, but you have to pay to correct their misinformation. So, there you have it. Psychology lacks an open discussion forum (OSF); talk about scientific utopia. I left fascist X a long time ago, but still get traffic from there. I am now posting on Bluesky with little direct engagement, but apparently some people notice the posts and visit.

Most interesting are the visits from ChatGPT. I am fully aware of the ecological problems, but AI will fix many of the problems that psychology faces, and equally environmentally problematic conferences serve more the purpose of taxpayer-paid vacations than advancing science. Nothing wrong with perks for underpaid academics, but let’s not pretend it advances science when talks are just sales pitches for the latest pseudo-innovation. Anyhow, blogging is now more important than publishing in costly peer-reviewed journals because AI does not care about peer-review and is blocked from work behind paywalls.

Some academics rail against AI, but appearently they never used one. ChatGPT constantly finds errors in my drafts and helps me to correct them before I post them. It also finds plenty of mistakes in published articles and we often have a chuckle that this stuff passed human peer review. On that note, human peer-review sucks and can be easily replaced with AI reviews. At least you don’t have to wait months to get some incoherent nonsensical reviews that only show lack of expertise by the reviewers.

The traffic from ChatGPT also underestimates the importance of AI. Few people actually click on links to check information, but ChatGPT’s answer is still influenced by my content. Ultimately, the real criterion for impact will be how much our work influences AI answers.

Location

The United States continues to dominate psychology. Europe has more people, but only a few European countries invest (waste?) money on psychology. A clear North-West vs the rest difference is visible. Former communist East is just poor, but the problem in the South is religion.

One of the highlights of 2025 was my visit of the Winter school in Padua, one of the oldest universities. I learned that it was relatively free and Galileo made important discoveries there, but he ran into “a little problem” when he moved to Florence and clashed with the Catholic church. The lesson is that the broader culture influences science and currently the USA is showing that its values are inconsistent with science. Religious fundamentalism in the Confederate states is incompatible with science, especially a social one. China is on the rise, and it seems more likely that they will be the next home of psychology, unless Europe gets its act together. China is a totalitarian regime, but a communist dictatorship seems better than religious ones for science and for the future of the planet.

Forecast 2026

The main prediction is that traffic from ChatGPT and China will increase. Possibly, traffic from other AIs like Gemini will also emerge. Other developments are harder to predict and that is the fun of blogging. I don’t have to invest months of my limited remaining life span to fight stupid reviewers to be allowed to pay $3,000 or more of Canadian tax-payers money to share my work with the world. I can do so for free and just see whether somebody found the work interesting. Fortunately, I am paid well enough so that I do not have to worry about the incentive structure in academia that everybody knows leads to fast, cheap, and bad science, but nobody is able to change. For those of you who are still a cog in this mindless machine, I can say there is hope. The tyranny of publication cartels is weakening and maybe sometimes it is better to just post a preprint than to try the 10th journal for the stamp of approval in a peer-reviewed (predatory) journal. Academia is a long game. The rewards come at the end when you can do what you want without concerns about approval. Humanist psychologists call this self-actualization. I call it the freedom of not giving a fuck anymore.

See you in 2026,
Ulrich Schimmack

Happy New Year