Concerns about credibility are widespread, but they often do not clearly distinguish between different sciences. One problem is that it is difficult to compare sciences quantitatively. One way to do so is to examine the strength of empirical evidence. We cannot compare effect sizes across sciences, but we can compare how precise effect size estimates are and how often rejections of null hypotheses may be false.
The first “science-wide” study was based on empirical results in medicine (Jager & Leek, 2013). Their methods and results were challenged, and it took some time before alternative methods became available. A better method is z-curve (Bartos & Schimmack, 2022; Brunner & Schimmack, 2020). Z-curve has been mostly used in psychology. A comparison with medicine showed that clinical trials have less power, but report results more honestly than psycholgy, where focal tests confirm predicts with success rates over 90% (Schimmack, 2020; Schimmack & Bartos, 2023).
A recent article extracted confidence intervals from four epidemiology journals.
Ackley, S. F., Andrews, R. M., Seaman, C., Flanders, M., Chen, R., Wang, J., Lopes, G., Sims, K. D., Buto, P., Ferguson, E., Allen, I. E., & Glymour, M. M. (2025). Trends in the distribution of P values in epidemiology journals: A statistical, P-curve, and simulation study. American Journal of Epidemiology, 194(12), 3630–3639. https://doi.org/10.1093/aje/kwaf184
The authors were not aware of z-curve, but I was able to analyze their shared data. I examined trends over time and found no evidence that z-curve parameters correlated with publication year. Thus, the results are representative of the literature. An initial analysis with standard z-curve showed no evidence of selection bias. Therefore, I fitted the full data, including non-significant results.
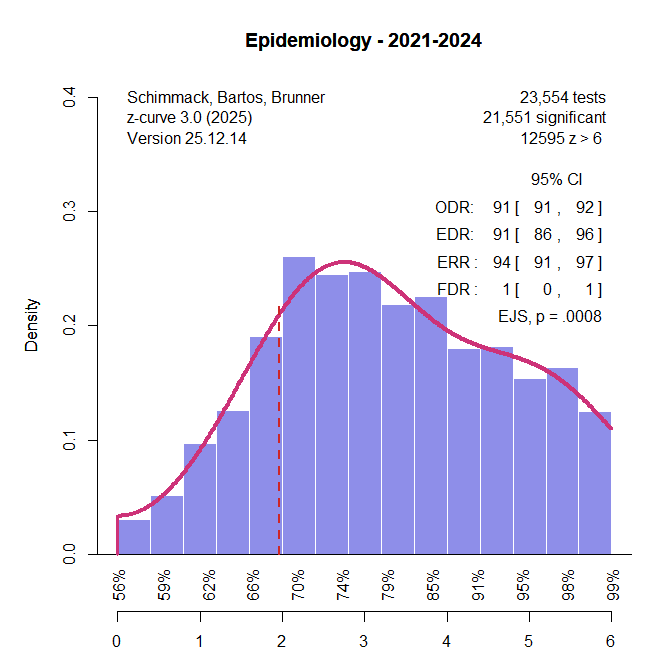
The key findings are: (a) The observed and expected discovery rates are 91%. This means that 91% of the results are significant, but the reason is not selection bias – as it is often in psycholoy – but high power to reject false null hypotheses; (b) a very low false positive risk even with alpha = .05, and a high probability that an exact replication study with a new sample from the same population would produce a significant result again. However, there is some evidence of p-hacking. That is there are more just significant results (2 to 2.4) than the model predicts, Excessive Just Significance Test, p = .0008. Visual inspection of the plot shows, however, that the effect size is small, observed 0.25%, expected 0.24%, and that statistical significance reflects mainly the large sample size.
In short, this is a healthy literature that instills confidence in epidemiological research. The reason is that epidemiological studies typically have large sample sizes and aim for precise effect size estimation. With this goal in mind, studies have high power to reject the null hypothesis of no effect, if only because doing so is not very informative. In contrast, psychologists often use small samples that are sometimes not even large enough to test a null hypothesis properly. Comparing epidemiology with psychology is therefore a bit like comparing apples and oranges, but this false comparison is often made when science as a whole is evaluated. In reality, different sciences face different problems. Low power and replicability are a problem for sciences that invest few resources in many studies, such as psychology. We cannot generalize from replication failures in these sciences to other sciences.
For psychology, effect sizes estimation mostly remains a scientific utopia, but the z-curve of epidemiology shows what that utopia looks like.