Stanley and Doucouliagos (2013) demonstrated how meta-regression can be used to obtain unbiased estimates of effect sizes from a biased set of original studies. The regression approach relies on the fact that small samples often need luck or questionable practices to produce significant results, whereas large samples can show true effects without the help of luck and questionable practices. If questionable practices or publication bias are present, effect sizes in small samples are inflated and this bias is evident in a regression of effect sizes on sampling error. When bias is present, the intercept of the regression equation can provide a better estimate of the average effect size in a set of studies.
One limitation of this approach is that other factors can also produce a correlation between effect size and sampling error. Another problem is that the regression equation can only approximate the effect of bias on effect size estimates.
The R-Index can complement meta-regression in several ways. First, it can be used to examine whether a correlation between effect size and sampling error reflects bias. If small samples have higher effect sizes due to bias, they should also yield more significant results than the power of these studies justifies. If this is not the case, the correlation may simply show that smaller samples examined stronger effects. Second, the R-Index can be used as an alternative way to estimate unbiased effect sizes that does not rely on the relationship between sample size and effect size.
The usefulness of the R-Index is illustrated with Stanley and Doucouliagos (2013) meta-analysis of the effectiveness of nicotine replacement therapy (the patch). Table A1 lists sampling errors and t-values of 42 studies. Stanley and Doucouliagos (2013) found that the 42 studies suggested a reduction in smoking by 93%, but that effectiveness decreased to 22% in a regression that controlled for biased reporting of results. This suggests that published studies inflate the true effect by more than 300%.
I entered the t-values and standard errors into the R-Index spreadsheet. I used sampling error to estimate sample sizes and degrees of freedom (2 / sqrt [N]). I used one-tailed t-tests to allow for negative t-values because the sign of effects is known in a meta-analysis of studies that try to show treatment effects. Significance was tested using p = .025, which is equivalent to using .050 in the test of significance for two-tailed tests (z > 1.96).
The R-Index for all 42 studies was 27%. The low R-Index was mostly explained by the low power of studies with small samples. Median observed power was just 34%. The number of significant results was only slightly higher 40%. The inflation rate was only 7%.
As studies with low power add mostly noise, Stanley (2010) showed that it can be preferable to exclude them from estimates of actual effect sizes. The problem is that it is difficult to find a principled way to determine which studies should be included or excluded. One solution is to retain only studies with large samples. The problem with this approach is that this often limits a meta-analysis to a small set of studies.
One solution is to compute the R-Index for different sets of studies and to base conclusions on the largest unbiased set of studies. For the 42 studies of nicotine replacement therapy, the following effect size estimates were obtained (effect sizes are d-values, d = t * se).
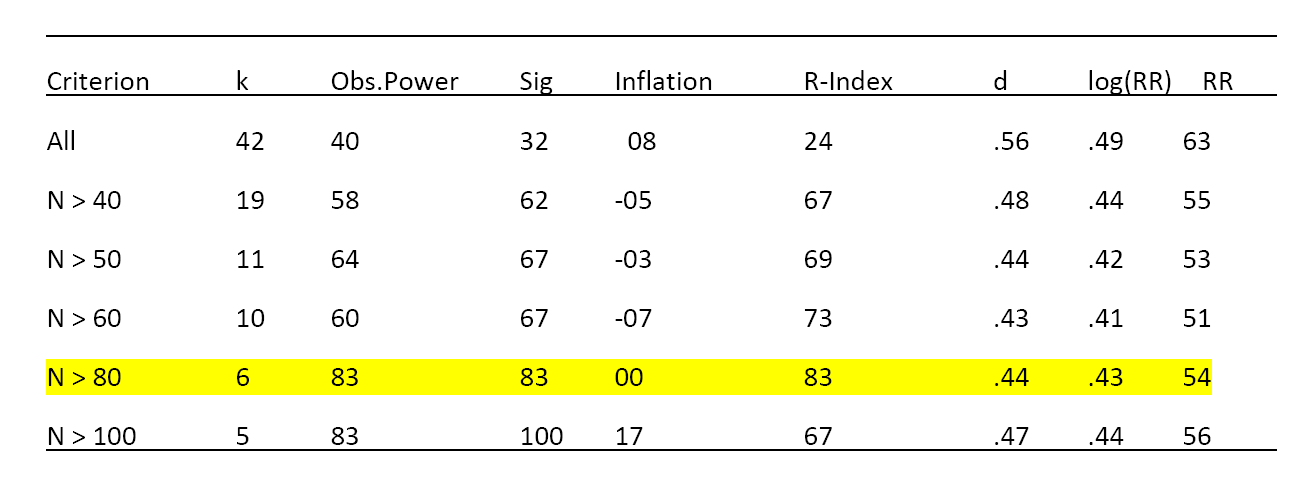
The results show the highest R-Index for studies with more than 80 participants. For these studies, observed power is 83% and the percentage of significant results is also 83%, suggesting that this set of studies is an unbiased sample of studies. The weighted average effect size for this set of studies is d = .44. The results also show that the weighted average effect size does not change much as a function of the selection of studies. When all studies are included, there is evidence of bias (8% inflation) and the weighted average effect size is inflated, but the amount of inflation is small (d = .56 vs. d = .44, difference d = .12).
The small amount of bias appears to be inconsistent with Stanley and Doucouliagos (2013) estimate that an uncorrected meta-analysis overestimates the true effect size by over 300% (93% vs. 22% RR). I therefore also examined the log(RR) values in Table 1a.
The average is .68 (compared to the simple mean reported as .66); the median is .53 and the weighted average is .49. The regression-corrected estimate reported by Stanley and Doucouliagos (2013) is .31. The weighted mean for studies with more than 80 participants is .43. It is now clear why Stanley and Doucouliagos (2013) reported a large effect of the bias correction. First, they used the simple mean as a comparison standard (.68 vs. 31). The effect would be smaller if they had used the weighted mean as a comparison standard (.49 vs. .31). Another factor is that the regression procedure produces a lower estimate than the R-Index approach (.31 vs. 43). More research is needed to compare these results, but the R-Index has a simple logic. When there is no evidence of bias, the weighted average provides a reasonable estimate of the true effect size.
Conclusion
Stanley and Doucouliagos (2013) used regression of effect sizes on sampling error to reveal biases and to obtain an unbiased estimate of the typical effect size in a set of studies. This approach provides a useful tool in the fight against biased reporting of research results. One limitation of this approach is that other factors can produce a correlation between sampling error and effect size. The R-Index can be used to examine how much reporting biases contribute to this correlation. The R-Index can also be used to obtain an unbiased estimate of effect size by computing a weighted average for a select set of studies with a high R-Index.
A meta-analysis of 42 studies of nicotine replacement theory illustrates this approach. The R-Index for the full set of studies was low (24%). This reveals that many studies had low power to demonstrate an effect. These studies provide little information about effectiveness because non-significant results are just as likely to be type-II errors as demonstrations of low effectiveness.
The R-Index increased when studies with larger samples were selected. The maximum R-Index was obtained for studies with at least 80 participants. In this case, observed power was above 80% and there was no evidence of bias. The weighted average effect size for this set of studies was only slightly lower than the weighted average effect size for all studies (log(RR) = .43 vs. .49, RR = 54% vs. 63%, respectively). This finding suggests that smokers who use a nicotine patch are about 50% more likely to quit smoking than smokers without a nicotine patch.
The estimate of 50% risk reduction challenges Stanley and Doucouliagos’s (2013) preferred estimate that bias correction “reduces the efficacy of the patch to only 22%.” The R-Index suggests that this bias-corrected estimate is itself biased.
Another important conclusion is that studies with low power are wasteful and uninformative. They generate a lot of noise and are likely to be systematically biased and they contribute little to a meta-analysis that weights studies by sample size. The best estimate of effect size was based on only 6 out of 42 studies. Researchers should not conduct studies with low power and editors should not publish studies with low power.