Concerns about research credibility have stimulated the growth of meta-science, a field that examines the reproducibility, robustness, and replicability of scientific findings (Ioannidis, 2005; Munafò et al., 2017). This literature has documented publication bias, low statistical power, inflated effect size estimates, and disappointing replication rates in some areas of research (Button et al., 2013; Ioannidis, 2005; Open Science Collaboration, 2015; Tyner et al., 2026). While initial studies focused on psychology and neuroscience, but a recent article suggested that the problems are more general. Tyner et al. (2026) reported that only about 50% of originally significant claims were successfully replicated.
A replication rate of 50% invites different interpretations. An optimistic interpretation is that most original studies detected effects in the correct direction, but that the average probability of obtaining another significant result in a new sample was only about 50%. In this scenario, selective publication of significant results inflates observed effect sizes, so replication studies often fail even when the original studies were not false positives. Many of the failures are therefore false negatives. A pessimistic interpretation is that many original results were false positives, whereas the remaining studies examined true effects with high power. In that case, the same 50% replication rate could arise from a mixture of null effects and highly powered true effects. Thus, the average replication rate alone is consistent with very different underlying realities.
To move beyond average replication rates, it is necessary to avoid reducing results to a dichotomy of significant versus non-significant. A cutoff at z = 1.96 is useful for decision making, but it discards quantitative information about the strength of evidence. A result with z = 6 provides much stronger evidence for a positive effect than a result with z = 2, just as z = -6 provides much stronger evidence for a negative effect than z = -2. This point is straightforward, but broad evaluations of replication outcomes have largely ignored differences in original evidential strength.
I used z-curve to examine heterogeneity in the strength of evidence across the original significant findings included in the two large replication projects (Brunner & Schimmack, 2020; Bartoš & Schimmack, 2022). Z-curve uses the distribution of significant z-values and corrects for the inflation in observed test statistics introduced by selection for significance. It provides two key estimates. The first is the Expected Replication Rate (ERR), which is the average probability that a significant result would be significant again in an exact replication with a new sample of the same size. The second is the Expected Discovery Rate (EDR), which is the estimated proportion of all studies, including unpublished non-significant ones, that would be expected to yield a significant result.
The EDR can be used to evaluate publication bias and to derive an upper bound on the false discovery rate using Sorić’s (1989) formula. Performance of z-curve has been examined in extensive simulation studies, which show that its 95% confidence intervals perform well when at least 100 significant results are available (Bartoš & Schimmack, 2022). Because z-curve is designed to accommodate heterogeneity in evidential strength, it is especially suitable for a diverse set of studies such as those included in the replication projects. Previous applications have shown substantial variation in ERR and EDR across research areas (Schimmack, 2020; Schimmack & Bartoš, 2023; Soto & Schimmack, 2024; Credé & Sotola, 2024; Sotola, 2022, 2024).”One limitation of previous applications is that they sometimes relied on automatically extracted p-values or focused on specific literatures. The replication projects provide gold-standard test statistics from a representative sample of social science research, avoiding both concerns. This makes it possible to examine heterogeneity in replicability across a broad range of research areas.
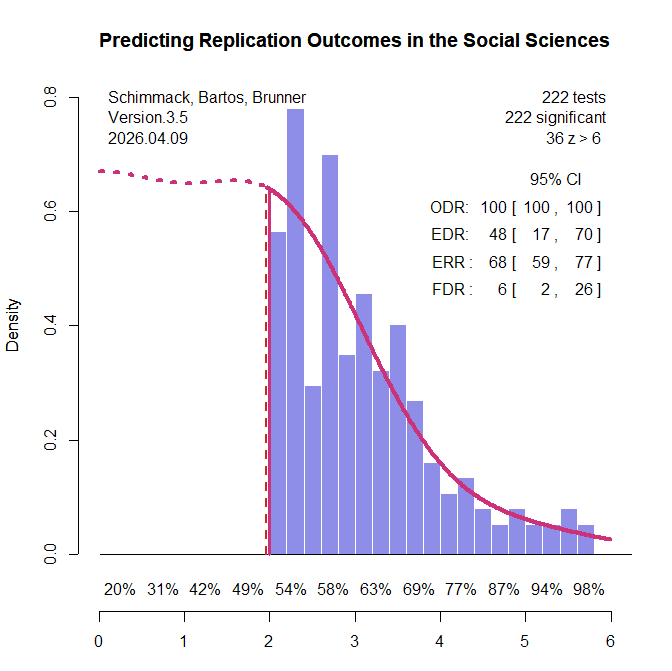
All original studies in the two replication projects were eligible for inclusion. For articles with multiple claims, the focal claim was identified from the abstract using a large language model (see OSF for details and cross-validation). When exact p-values were not reported in the project materials, the original articles were consulted to recover the necessary information. Articles without exact p-values were excluded. Original studies that claimed an effect without meeting the conventional significance threshold of p < .05 were also excluded. A small number of studies were further excluded because the replication reports did not provide sufficient information to evaluate the replication outcome. This screening process yielded k = 222 significant results (k1 = 88, k2 = 134), including k = 130 from psychology and k = 92 from other social sciences. The replication rate in this subset was similar to that in the full set of studies: 43% overall (project 1: 33%, project 2: 49%; psychology: 37%; other social sciences: 51%; see OSF for details). Figure 1 shows the z-curve analysis of these 222 original significant results.
The most striking result is that the expected replication rate (ERR) is substantially higher than the observed replication rate in the replication studies (68% versus 42%). Even the lower bound of the 95% confidence interval for the ERR, 59%, exceeds the observed replication rate. This discrepancy is especially noteworthy because the replication studies often used larger sample sizes than the original studies, which should have increased, not decreased, the probability of obtaining a significant result. Thus, the lower effect sizes observed in the replication studies cannot be attributed to regression to the mean alone. An additional factor appears to be that population effect sizes in the replication studies were systematically smaller than in the original studies.
Z-curve also limits the range of scenarios that are compatible with the data. The estimated EDR of 48% implies that no more than 6% of the significant results can be false positive results (Soric, 1989). Even the lower limit of the EDR confidence interval, 17%, limits the false positive rate to no more than 26%. With 50% replication failures, this suggests that no more than half of the replication failures are false positives. This finding shows the importance of distinguishing clearly between replication rates and false positive rates (Maxwell et al., 2015).
The false positive risk also varies as a function of the significance criterion. Marginally significant results are more likely to be false positives than results with high z-values (Benjamin et al., 2018). Z-curve makes it possible to address Benjamini and Hechtlinger’s (2014) call to control, rather than merely estimate, the science-wise false discovery rate. A stricter alpha criterion reduces the discovery rate, but it reduces the false discovery rate more. Benjamin et al. (2018) suggested reducing the false positive risk by lowering the significance criterion to alpha = .005. A z-curve analysis with this criterion estimated the FDR at 2% and the upper limit of the 95% CI was 6%. This finding provides empirical support for Benjamin et al.’s (2018) suggestion. It also addresses Lakens et al.’s (2018) concern that alpha levels should be justified. Here the strength of evidence provides the justification. In other literatures, alpha = .01 is sufficient to keep the FDR below 5% (Schimmack & Bartoš, 2023; Soto & Schimmack, 2024), but sometimes even alpha = .001 is insufficient to control false positives (Chen et al., 2025; Schimmack, 2025).
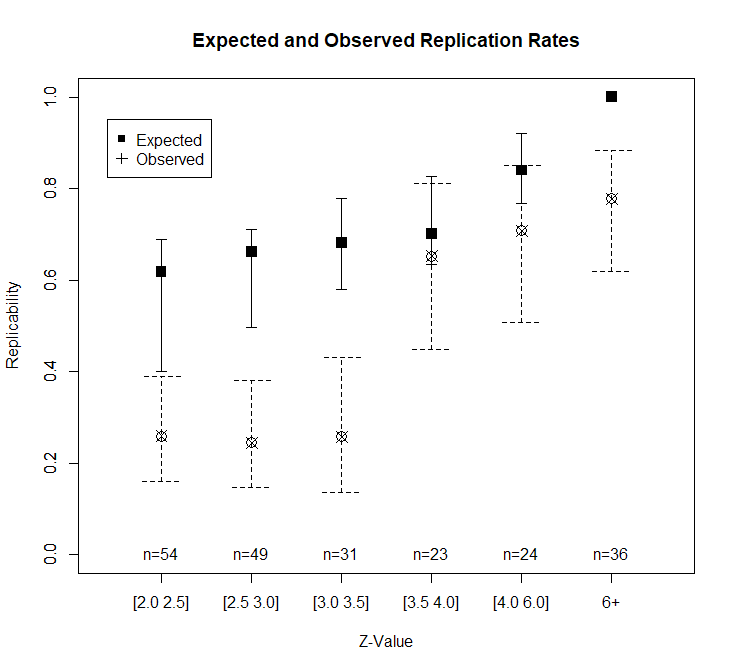
Heterogeneity in strength of evidence also makes it possible to predict replication outcomes as a function of z-values. Figure 1 shows power for z-value intervals below the x-axis. Expected replication rates increase from 54% for just significant results to over 90% for z-values greater than 5. Another 36 z-values have z-values greater than 6 that are practically guaranteed to replicate in exact replication studies. Figure 2 shows the expected replication rates and the observed replication rates for z-value ranges.
Studies with modest evidence (z = 2 to 3.5) replicate at significantly lower rates than expected based on z-curve. As expected, replication rates increase with stronger evidence. Given the small number of observations per bin, it is not possible to test whether z-curve predictions remain too optimistic at moderate z-values. The most surprising finding is that observed replication rates for studies with strong evidence (z > 6) fall below the expected rate.
In exploratory analyses, I examined possible reasons for these surprising replication failures. I used two large language models (ChatGPT and Claude) to score the replication reports of studies with strong original evidence (z > 6). Studies were coded on five dimensions (match of populations, materials, design, time period, and implementation) with scores from 0 to 2 each to produce total scores ranging from 0 to 10. Inter-rater agreement for the total scores was high, ICC(A,1) = .85, 95%CI = .73, .92. I averaged the two scores and used a total of 7 or higher as the criterion for a close match. Of the 24 close replications, 21 were successful (88%). Of the 12 studies that were not close replications, only 6 were successful (50%).
I further examined the three close replications that failed. While Farris et al. (2008) closely matched the original in many aspects, the original participants were from the US and the replication was conducted in the UK. Subsequent studies have replicated the finding with US samples (Farris et al., 2009/2010; Treat et al., 2017), ruling out a simple false positive explanation. The replication failure of Hurst and Kavanagh (2017) likely reflects a sampling problem in the original study. Participants from the general population and users of community mental health services were analyzed in a single analysis, which can inflate effect sizes (Preacher et al., 2005). McDevitt examined the influence of plumbing business names starting with numbers or A to be first in the yellow pages. A replication in 2020 cannot reproduce this effect because google searches replaced yellow pages.
While these exploratory results are based on a small sample, they support the broader claim that original results with strong evidence (z > 6) are likely to replicate in close replications and that failures may stem from meaningful differences in study design.
Conclusion
Z-curve analysis of two major replication projects reveals that replicability in the social sciences is not a single number. The expected replication rate based on the strength of original evidence (68%) substantially exceeds the observed replication rate (42%), indicating that effect size shrinkage beyond statistical regression to the mean contributes to replication failures. The false discovery rate is low (6%), confirming that most replication failures reflect reduced effect sizes rather than false positives. Adjusting the significance criterion to alpha = .005 reduces the estimated false discovery rate to 2%.
The most practically useful finding is that original results with strong evidence (z > 6) are highly replicable when the replication closely matches the original study design (88% success rate). Replication failures among these strong results were attributable to identifiable differences between the original and replication studies — different populations, changed market conditions, or heterogeneous samples. This suggests that the strength of statistical evidence, combined with methodological similarity, is a reliable predictor of replication success.
These findings argue against treating all significant results as equally credible and against interpreting average replication rates as informative about any particular study. Replicability is predictable from information already available in the original publication.
Since 2011, the credibility of psychological science is in doubt. A major concern is that questionable research practices could have produced many false positive results, and it has been suggested that most published results are false. Here we present an empirical estimate of the false discovery risk using a z-curve analysis of randomly selected p-values from a broad range of journals that span most disciplines in psychology. The results suggest that no more than a quarter of published results could be false positives. We also show that the false positive risk can be reduced to less than 5% by using alpha = .01 as the criterion for statistical significance. This remedy can restore confidence in the direction of published effects. However, published effect sizes cannot be trusted because the z-curve analysis shows clear evidence of selection for significance that inflates effect size estimates.
Introduction
Several events in the early 2010s led to a credibility crisis in psychology. As journals selectively publish only statistically significant results, statistical significance loses its, well, significance. Every published focal hypothesis will be statistically significant, and it is unclear which of these results are true positives and which are false positives.
A key article that contributed to the credibility crisis was Simmons, Nelson, & Simonsohn’s article “False Positive Psychology: Undisclosed Flexibility in Data Collection and Analysis Allows Presenting Anything as Significant”
The title made a bold statement that it is easy to obtain statistically significant results even when the null-hypothesis is true. This led to concerns that many, if not most, published results are indeed false positive results. Many meta-psychological articles quoted Simmons et al.’s (2011) article to suggest that there is a high risk or even a high rate of false positive results in the psychological literature; including my own 2012 article.
“Researchers can use questionable research practices (e.g., snooping, not reporting failed studies, dropping dependent variables, etc.; Simmons et al., 2011; Strube, 2006) to dramatically increase the chances of obtaining a false-positive result” (Schimmack, 2012, p. 552, 248 citations)
The Appendix lists citations from influential meta-psychological articles that imply a high false positive risk in the psychological literature. Only one article suggested that fears about high false positive rates may be unwarranted (Strobe & Strack, 2014). In contrast, other articles have suggested that false positive rates might be as high as 50% or more (Szucs & Ioannidis, 2017).
There have been two noteworthy attempts at estimating the false discovery rate in psychology. Szucs and Ioannidis (2017) automatically extracted p-values from five psychology journals and estimated the average power of extracted t-tests. They then used this power estimate in combination with the assumption that psychologists discover one true, non-zero, effect for every 13 true null-hypotheses to suggest that the false discovery rate in psychology exceeds 50%. The problem with this estimate is that it relies on the questionable assumption that psychologists tests a very small percentage of true hypotheses.
The other article tried to estimate the false positive rate based on 70 of the 100 studies that were replicated in the Open Science Collaboration project (Open Science Collaboration, 2015). The statistical model estimated that psychologists test 93 true null-hypotheses for every 7 true effects (true positives), and that true effects are tested with 75% power (Johnson et al., 2017). This yields a false positive rate of about 50%. The main problem with this study is the reliance on a small, unrepresentative sample of studies that focused heavily on experimental social psychology, a field that triggered concerns about the credibility of psychology in general (Schimmack, 2020). Another problem is that point estimates based on a small sample are unreliable.
To provide new and better information about the false positive risk in psychology, we conducted a new investigation that addresses three limitations of the previous studies. First, we used hand-coding of focal hypothesis tests, rather than automatic extraction of all test-statistics. Second, we sampled from a broad range of journals that cover all areas of psychology rather than focusing narrowly on experimental psychology. Third, we used a validated method to estimate the false discovery risk based on an estimate of the expected discovery rate (Bartos & Schimmack, 2021). In short, the false discovery risk decreases as a monotonic function of the number of discoveries (i.e., p-values below .05) (Soric, 1989).
Z-curve relies on the observation that false positives and true positives produce different distributions of p-values. To fit a model to distributions of significant p-values, z-curve transforms p-values into absolute z-scores. We illustrate z-curve with two simulation studies. The first simulation is based on Simmons et al.’s (2011) scenario in which the combination of four questionable research practices inflates the false positive risk from 5% to 60%. In our simulation, we assumed an equal number of true null-hypotheses (effect size d = 0) and true hypotheses with small to moderate effect sizes (d = .2 to .5). The use of questionable research practices also increases the chances of getting a significant result for true hypotheses. In our simulation, the probability to get significance with true H0 was 58%, whereas the probability to get significance with true H1 was .93. Given the 1:1 ratio of H0 and H1 that were tested, this yields a false discovery rate of 39%.
Figure 1 shows that questionable research practices produce a steeply declining z-curve. Based on this shape, z-curve estimates a discovery rate of 5%, with a 95%CI ranging from 5% to 10%. This translates into estimates of the false discovery risk of 100% with a 95%CI ranging from 46% to 100% (Soric, 1989). The reason why z-curve provides a conservative estimate of the false discovery risk is that p-hacking changes the shape of the distribution in a way that produces even more z-values just above 1.96 than mere selection for significance would produce. In other words, p-hacking destroys evidential value when true hypotheses are being tested. It is not necessary to simulate scenarios in which even more true null-hypotheses are being tested because this would make the z-curve even steeper. Thus, Figure 1 provides a prediction for our z-curve analyses based on actual data, if psychologists heavily rely on Simmons et al.’s recipe to produce significant results.
Figure 2 is based on a simulation of Johnson et al.’s (2013) scenario with a 9% discovery rate (9 true hypotheses for very 100 hypothesis tests), a false discovery rate of 50%, and power to detect true effects of 75% (Figure 2). Johnson et al. did not assume or model p-hacking.
The z-curve for this scenario also shows a steep decline that can be attributed to the high percentage of false positive results. However, there is also a notable tail with z-values greater than 3 that reflects the influence of true hypotheses with adequate power. In this scenario, the expected discovery rate is higher with a 95%CI ranging from 7% to 20%. This translates into a 95%CI for the false discovery risk ranging from 21% to 71% (Soric, 1989). This interval contains the true value of 50%, although the point estimate, 34% underestimates the true value. Thus, we recommend to use the upper limit of the 95%CI as an estimate of the maximum false discovery rate that is consistent with data.
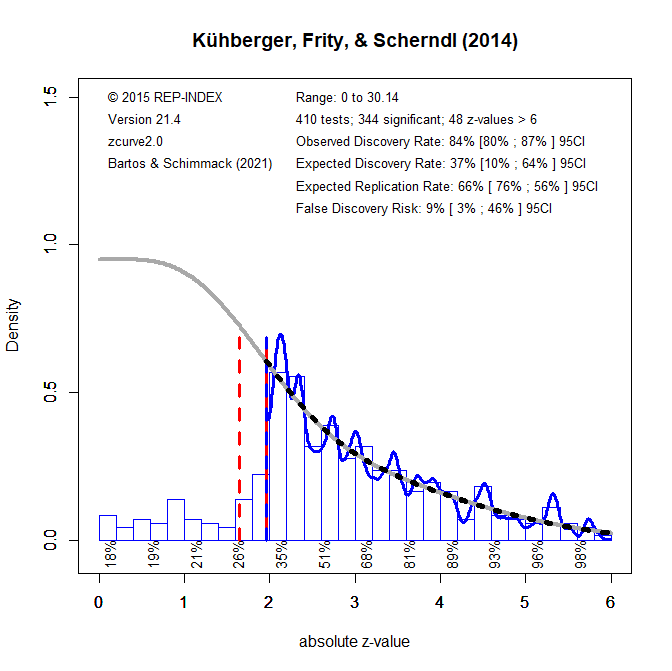
We now turn to real data. Figure 3 shows a z-curve analysis of Kühberger, Frity, and Scherndl (2014) data. The authors conducted an audit of psychological research by randomly sampling 1,000 English language articles published in the year 2007 that were listed in PsychInfo. This audit produced 344 significant p-values that could be subjected to a z-curve analysis. The results differ notably from the previous results. The expected discovery rate is higher and implies a much smaller false discovery risk of only 9%. However, due to the small set of studies, the confidence interval is wide and allows for nearly 50% false positive results.
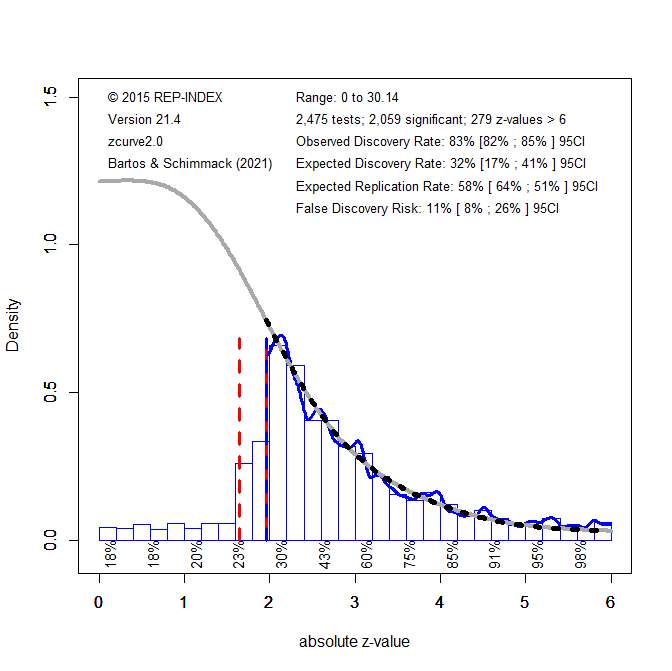
To produce a larger set of test-statistics, my students and I have hand-coded over 1,000 randomly selected articles from a broad range of journals (Schimmack, 2021). These data were combined with Motyl et al.’s (2017) coding of social psychology journals. The time period spans the years 2008 to 2014, with a focus on the year 2010 and 2009. This dataset produced 1,715 significant p-values. The estimated false discovery risk is similar to the estimate for Kühberger et al.’s (2014) studies. Although the point estimate for the false discovery risk is a bit higher, 12%, the upper bound of the 95%CI is lower because the confidence interval is tighter.
Given the similarity of the results, we combined the two datasets to obtain an even more precise estimate of the false discovery risk based on 2,059 significant p-values. However, the upper limit of the 95%CI decreased only slightly from 30% to 26%.
The most important conclusion from these findings is that concerns about the amount of false positive results have exaggerated assumptions about the prevalence of false positive results in psychology journals. The present results suggest that at most a quarter of published results are false positives and that actual z-curves are very different from those implied by the influential simulation studies of Simmons et al. (2011). Our empirical results show no evidence that massive p-hacking is a common practice.
However, a false positive rate of 25% is still unacceptably high. Fortunately, there is an easy solution to this problem because the false discovery rate depends on the significance threshold. Based on their pessimistic estimates, Johnson et al. (2015) suggested to lower alpha to .005 or even .001. However, these stringent criteria would render most published results statistically non-significant. We suggest to lower alpha to .01. Figure 6 shows the rational for this recommendation by fitting z-curve with alpha = .01 (i.e., the red vertical line that represents the significance criterion is moved from 1.96 to 2.58.
Lowering alpha to .01, lowers the percentage of significant results from 83% (not counting marginally significant, p < .1, results) to 53%. Thus, the expected discovery decreases, but the more stringent criterion for significance lowers the false discovery risk to 4% and even the upper limit of the 95%CI is just 4%.
It is likely that discovery rates vary across journals and disciplines (Schimmack, 2021). In the future, it may be possible to make more specific recommendations for different disciplines or journals based on their discovery rates. Journals that publish riskier hypotheses tests or studies with modest power would need a more stringent significance criterion to maintain an acceptable false discovery risk.
An alpha level of .01 is also recommended by Simmons et al.’s (2011) simulation studies of p-hacking. Massive p-hacking that inflates the false positive risk from 5% to 61% produces only 22% false positives with alpha = .01. Milder forms of p-hacking inflates the false positive risk produces only a probability of 8% to obtain a p-value below .01. Ideally, open science practices like pre-registration will curb the use of questionable practices in the future. Increasing sample sizes will also help to lower the false positive risk. A z-curve analysis of new studies can be used to estimate the current false discovery risk and may suggest that even the traditional alpha level of .05 is able to maintain a false discovery risk below 5%.
While the present results may be considered good news relative to the scenario that most published results cannot be trusted, the results do not change the fact that some areas of psychology have a replication crisis (Open Science Collaboration, 2015). The z-curve results show clear evidence of selection for significance, which leads to inflated effect size estimates. Studies suggest that effect sizes are often inflated by more than 100% (Open Science Collaboration, 2015). Thus, published effect size estimates cannot be trusted even if p-values below .01 show the correct sign of an effect. The present results also imply that effect size meta-analyses that did not correct for publication bias produce inflated effect size estimates. For these reasons, many meta-analyses have to be reexamined and use statistical tools that correct for publication bias.
Appendix
“Given that these publishing biases are pervasive across scientific practice, it is possible that false positives heavily contaminate the neuroscience literature as well, and this problem may affect at least as much, if not even more so, the most prominent journals” (Button et al., 2013; 3,316 citations).
“In a theoretical analysis, Ioannidis estimated that publishing and analytic practices make it likely that more than half of research results are false and therefore irreproducible” (Open Science Collaboration, 2015, aac4716-1)
“There is increasing concern that most current published research findings are false. (Ioannidis, 2005, abstract)” (Cumming, 2014, p7, 1,633 citations).
“In a recent article, Simmons, Nelson, and Simonsohn (2011) showed how, due to the misuse of statistical tools, significant results could easily turn out to be false positives (i.e., effects considered significant whereas the null hypothesis is actually true). (Leys et al., 2013, p. 765, 1,406 citations)
“During data analysis it can be difficult for researchers to recognize P-hacking or data dredging because confirmation and hindsight biases can encourage the acceptance of outcomes that fit expectations or desires as appropriate, and the rejection of outcomes that do not as the result of suboptimal designs or analyses. Hypotheses may emerge that fit the data and are then reported without indication or recognition of their post hoc origin. This, unfortunately, is not scientific discovery, but self-deception. Uncontrolled, it can dramatically increase the false discovery rate” (Munafò et al., 2017, p. 2, 1,010 citations)
Just how dramatic these effects can be was demonstrated by Simmons, Nelson, and Simonsohn (2011) in a series of experiments and simulations that showed how greatly QRPs increase the likelihood of finding support for a false hypothesis. (John et al., 2012, p. 524, 877 citations).
“Simonsohn’s simulations have shown that changes in a few data-analysis decisions can increase thefalse-positive rate in a single study to 60%” (Nuzzo, 2014, 799 citations).
“the publication of an important article in Psychological Science showing how easily researchers can, in the absence of any real effects, nonetheless obtain statistically significant differences through various questionable research practices (QRPs) such as exploring multiple dependent variables or covariates and only reporting these when they yield significant results (Simmons, Nelson, & Simonsohn, 2011)” (Pashler & Wagenmakers, 2012, p. 528, 736 citations)
“Even seemingly conservative levels of p-hacking make it easy for researchers to find statistically significant support for nonexistent effects. Indeed, p-hacking can allow researchers to get most studies to reveal significant relationships between truly unrelated variables (Simmons et al., 2011).” (Simonsohn, Nelson, & Simmons, 2014, p. 534, 656 citations)
“Recent years have seen intense interest in the reproducibility of scientific results and the degree to which some problematic, but common, research practices may be responsible for high rates of false findings in the scientific literature, particularly within psychology but also more generally” (Poldrack et al., 2017, p. 115, 475 citations)
“especially in an environment in which multiple comparisons or researcher dfs (Simmons, Nelson, & Simonsohn, 2011) make it easy for researchers to find large and statistically significant effects that could arise from noise alone” (Gelman & Carlin,
“In an influential recent study, Simmons and colleagues demonstrated that even a moderate amount of flexibility in analysis choice—for example, selecting from among two DVs or optionally including covariates in a regression analysis— could easily produce false-positive rates in excess of 60%, a figure they convincingly argue is probably a conservative estimate (Simmons et al., 2011).” (Yarkoni & Westfall, 2017, p. 1103, 457 citations)
“In the face of human biases and the vested interest of the experimenter, such freedom of analysis provides access to a Pandora’s box of tricks that can be used to achieve any desired result (e.g., John et al., 2012; Simmons, Nelson, & Simonsohn, 2011″ (Wagenmakers et al., 2012, p. 633, 425 citations)
“Simmons et al. (2011) illustrated how easy it is to inflate Type I error rates when researchers employ hidden degrees of freedom in their analyses and design of studies (e.g., selecting the most desirable outcomes, letting the sample size depend on results of significance tests).” (Bakker et al., 2012, p. 545, 394 citations).
“Psychologists have recently become increasingly concerned about the likely overabundance of false positive results in the scientific literature. For example, Simmons, Nelson, and Simonsohn (2011) state that “In many cases, a researcher is more likely to falsely find evidence that an effect exists than to correctly find evidence that it does not” (p. 1359)” (Maxwell, Lau, & Howard, 2015, p. 487,
“More-over, the highest impact journals famously tend to favor highly surprising results; this makes it easy to see how the proportion of false positive findings could be even higher in such journals.” (Pashler & Harris, 2012, p. 532, 373 citations)
“There is increasing concern that many published results are false positives [1,2] (but see [3]).” (Head et al., 2015, p. 1, 356 citations)
“Quantifying p-hacking is important because publication of false positives hinders scientific progress” (Head et al., 2015, p. 2, 356 citations).
“To be sure, methodological discussions are important for any discipline, and both fraud and dubious research procedures are damaging to the image of any field and potentially undermine confidence in the validity of social psychological research findings. Thus far, however, no solid data exist on the prevalence of such research practices in either social or any other area of psychology.” (Strobe & Strack, 2014, p. 60, 291 citations)
“Assuming a realistic range of prior probabilities for null hypotheses, false report probability is likely to exceed 50% for the whole literature” (Szucs & Ioannidis, 2017, p. 1, 269 citations)
“Notably, if we consider the recent estimate of 13:1 H0:H1 odds [30], then FRP exceeds 50% even in the absence of bias” (Szucs & Ioannidis, 2017, p. 12, 269 citations)
“In all, the combination of low power, selective reporting, and other biases and errors that have been well documented suggest that high FRP can be expected in cognitive neuroscience and psychology. For example, if we consider the recent estimate of 13:1 H0:H1 odds [30], then FRP exceeds 50% even in the absence of bias.” (Szucs & Ioannidis, 2017, p. 15, 269 citations)
“Many prominent researchers believe that as much as half of the scientific literature—not only in medicine, by also in psychology and other fields—may be wrong [11,13–15]” (Smaldino & McElreath, 2016, p. 2, 251 citations).
“Researchers can use questionable research practices (e.g., snooping, not reporting failed studies, dropping dependent variables, etc.; Simmons et al., 2011; Strube, 2006) to dramatically increase the chances of obtaining a false-positive result” (Schimmack, 2012, p. 552, 248 citations)
“A more recent article compellingly demonstrated how flexibility in data collection, analysis, and reporting can dramatically increase false-positive rates (Simmons, Nelson, & Simonsohn, 2011).” (Dick et al., 2015, p. 43, 208 citations)
“In 2011, we wrote “False-Positive Psychology” (Simmons et al. 2011), an article reporting the surprisingly severe consequences of selectively reporting data and analyses, a practice that we later called p-hacking. In that article, we showed that conducting multiple analyses on the same data set and then reporting only the one(s) that obtained statistical significance (e.g., analyzing multiple measures but reporting only one) can dramatically increase the likelihood of publishing a false-positive finding. Independently and nearly simultaneously, John et al. (2012) documented that a large fraction of psychological researchers admitted engaging in precisely the forms of p-hacking that we had considered. Identifying these realities—that researchers engage in p-hacking and that p-hacking makes it trivially easy to accumulate significant evidence for a false hypothesis—opened psychologists’ eyes to the fact that many published findings, and even whole literatures, could be false positive.” (Nelson, Simmons, & Simonsohn, 2018, 204 citations).
“As Simmons et al.(2011) concluded—reflecting broadly on the state of the discipline—“it is unacceptably easy to publish ‘statistically significant’ evidence consistent with any hypothesis”(p.1359)” (Earp & Trafimov, 2015, p. 4, 200 citations)
“The second, related set of events was the publication of articles by a series of authors (Ioannidis 2005, Kerr 1998, Simmons et al. 2011, Vul et al. 2009) criticizing questionable research practices (QRPs) that result in grossly inflated false positive error rates in the psychological literature” (Shrout & Rodgers, 2018, p. 489, 195 citations).
“Let us add a new dimension, which was brought up in a seminal publication of Simmons, Nelson & Simonsohn (2011). They stated that researchers actually have so much flexibility in deciding how to analyse their data that this flexibility allows them to coax statistically significant results from nearly any data set” (Forstmeier, Wagenmakers, & Parker, 2017, p. 1945, 173 citations)
“Publication bias (Ioannidis, 2005) and flexibility during data analyses (Simmons, Nelson, & Simonsohn, 2011) create a situation in which false positives are easy to publish, whereas contradictory null findings do not reach scientific journals (but see Nosek & Lakens, in press)” (Lakens & Evers, 2014, p. 278, 139 citations)
“Recent reports hold that allegedly common research practices allow psychologists to support just about any conclusion (Ioannidis, 2005; Simmons, Nelson, & Simonsohn, 2011).” (Koole & Lakens, 2012, p. 608, 139 citations)
“Researchers then may be tempted to write up and concoct papers around the significant results and send them to journals for publication. This outcome selection seems to be widespread practice in psychology [12], which implies a lot of false positive results in the literature and a massive overestimation of ES, especially in meta-analyses” (
“Researcher df, or researchers’ behavior directed at obtaining statistically significant results (Simonsohn, Nelson, & Simmons, 2013), which is also known as p-hacking or questionable research practices in the context of null hypothesis significance testing (e.g., O’Boyle, Banks, & Gonzalez-Mulé, 2014), results in a higher frequency of studies with false positives (Simmons et al., 2011) and inflates genuine effects (Bakker et al., 2012).” (van Assen, van Aert, & Wicherts, p. 294, 133 citations)
“The scientific community has witnessed growing concern about the high rate of false positives and unreliable results within the psychological literature, but the harmful impact of false negatives has been largely ignored” (Vadillo, Konstantinidis, & Shanks, p. 87, 131 citations)
“Much of the debate has concerned habits (such as “phacking” and the filedrawer effect) which can boost the prevalence of false positives in the published literature (Ioannidis, Munafò, Fusar-Poli, Nosek, & David, 2014; Simmons, Nelson, & Simonsohn, 2011).” (Vadillo, Konstantinidis, & Shanks, p. 87, 131 citations)
“Simmons, Nelson, and Simonsohn (2011) showed that researchers without scruples can nearly always find a p < .05 in a data set if they set their minds to it.” (Crandall & Sherman, 2014, p. 96, 114 citations)
Cookie Consent
We use cookies to improve your experience on our site. By using our site, you consent to cookies.