Concerns about research credibility have stimulated the growth of meta-science, a field that examines the reproducibility, robustness, and replicability of scientific findings (Ioannidis, 2005; Munafò et al., 2017). This literature has documented publication bias, low statistical power, inflated effect size estimates, and disappointing replication rates in some areas of research (Button et al., 2013; Ioannidis, 2005; Open Science Collaboration, 2015; Tyner et al., 2026). While initial studies focused on psychology and neuroscience, but a recent article suggested that the problems are more general. Tyner et al. (2026) reported that only about 50% of originally significant claims were successfully replicated.
A replication rate of 50% invites different interpretations. An optimistic interpretation is that most original studies detected effects in the correct direction, but that the average probability of obtaining another significant result in a new sample was only about 50%. In this scenario, selective publication of significant results inflates observed effect sizes, so replication studies often fail even when the original studies were not false positives. Many of the failures are therefore false negatives. A pessimistic interpretation is that many original results were false positives, whereas the remaining studies examined true effects with high power. In that case, the same 50% replication rate could arise from a mixture of null effects and highly powered true effects. Thus, the average replication rate alone is consistent with very different underlying realities.
To move beyond average replication rates, it is necessary to avoid reducing results to a dichotomy of significant versus non-significant. A cutoff at z = 1.96 is useful for decision making, but it discards quantitative information about the strength of evidence. A result with z = 6 provides much stronger evidence for a positive effect than a result with z = 2, just as z = -6 provides much stronger evidence for a negative effect than z = -2. This point is straightforward, but broad evaluations of replication outcomes have largely ignored differences in original evidential strength.
I used z-curve to examine heterogeneity in the strength of evidence across the original significant findings included in the two large replication projects (Brunner & Schimmack, 2020; Bartoš & Schimmack, 2022). Z-curve uses the distribution of significant z-values and corrects for the inflation in observed test statistics introduced by selection for significance. It provides two key estimates. The first is the Expected Replication Rate (ERR), which is the average probability that a significant result would be significant again in an exact replication with a new sample of the same size. The second is the Expected Discovery Rate (EDR), which is the estimated proportion of all studies, including unpublished non-significant ones, that would be expected to yield a significant result.
The EDR can be used to evaluate publication bias and to derive an upper bound on the false discovery rate using Sorić’s (1989) formula. Performance of z-curve has been examined in extensive simulation studies, which show that its 95% confidence intervals perform well when at least 100 significant results are available (Bartoš & Schimmack, 2022). Because z-curve is designed to accommodate heterogeneity in evidential strength, it is especially suitable for a diverse set of studies such as those included in the replication projects. Previous applications have shown substantial variation in ERR and EDR across research areas (Schimmack, 2020; Schimmack & Bartoš, 2023; Soto & Schimmack, 2024; Credé & Sotola, 2024; Sotola, 2022, 2024).”One limitation of previous applications is that they sometimes relied on automatically extracted p-values or focused on specific literatures. The replication projects provide gold-standard test statistics from a representative sample of social science research, avoiding both concerns. This makes it possible to examine heterogeneity in replicability across a broad range of research areas.
All original studies in the two replication projects were eligible for inclusion. For articles with multiple claims, the focal claim was identified from the abstract using a large language model (see OSF for details and cross-validation). When exact p-values were not reported in the project materials, the original articles were consulted to recover the necessary information. Articles without exact p-values were excluded. Original studies that claimed an effect without meeting the conventional significance threshold of p < .05 were also excluded. A small number of studies were further excluded because the replication reports did not provide sufficient information to evaluate the replication outcome. This screening process yielded k = 222 significant results (k1 = 88, k2 = 134), including k = 130 from psychology and k = 92 from other social sciences. The replication rate in this subset was similar to that in the full set of studies: 43% overall (project 1: 33%, project 2: 49%; psychology: 37%; other social sciences: 51%; see OSF for details). Figure 1 shows the z-curve analysis of these 222 original significant results.
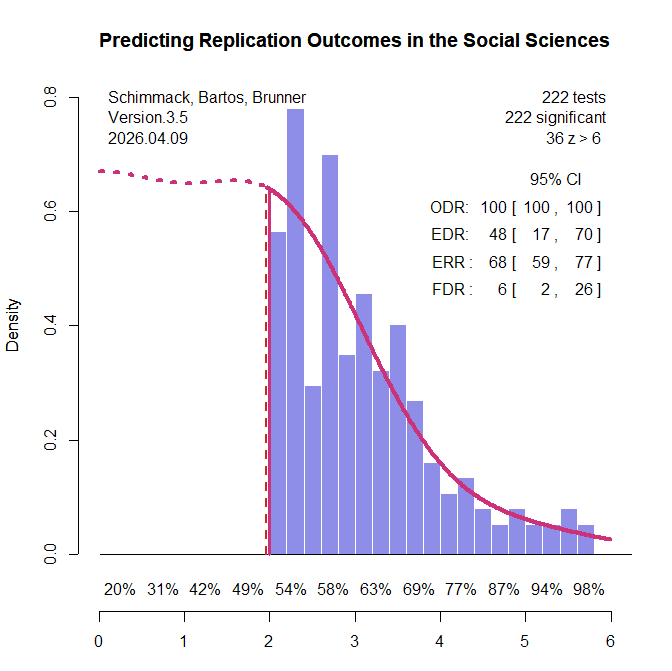
The most striking result is that the expected replication rate (ERR) is substantially higher than the observed replication rate in the replication studies (68% versus 42%). Even the lower bound of the 95% confidence interval for the ERR, 59%, exceeds the observed replication rate. This discrepancy is especially noteworthy because the replication studies often used larger sample sizes than the original studies, which should have increased, not decreased, the probability of obtaining a significant result. Thus, the lower effect sizes observed in the replication studies cannot be attributed to regression to the mean alone. An additional factor appears to be that population effect sizes in the replication studies were systematically smaller than in the original studies.
Z-curve also limits the range of scenarios that are compatible with the data. The estimated EDR of 48% implies that no more than 6% of the significant results can be false positive results (Soric, 1989). Even the lower limit of the EDR confidence interval, 17%, limits the false positive rate to no more than 26%. With 50% replication failures, this suggests that no more than half of the replication failures are false positives. This finding shows the importance of distinguishing clearly between replication rates and false positive rates (Maxwell et al., 2015).
The false positive risk also varies as a function of the significance criterion. Marginally significant results are more likely to be false positives than results with high z-values (Benjamin et al., 2018). Z-curve makes it possible to address Benjamini and Hechtlinger’s (2014) call to control, rather than merely estimate, the science-wise false discovery rate. A stricter alpha criterion reduces the discovery rate, but it reduces the false discovery rate more. Benjamin et al. (2018) suggested reducing the false positive risk by lowering the significance criterion to alpha = .005. A z-curve analysis with this criterion estimated the FDR at 2% and the upper limit of the 95% CI was 6%. This finding provides empirical support for Benjamin et al.’s (2018) suggestion. It also addresses Lakens et al.’s (2018) concern that alpha levels should be justified. Here the strength of evidence provides the justification. In other literatures, alpha = .01 is sufficient to keep the FDR below 5% (Schimmack & Bartoš, 2023; Soto & Schimmack, 2024), but sometimes even alpha = .001 is insufficient to control false positives (Chen et al., 2025; Schimmack, 2025).
Heterogeneity in strength of evidence also makes it possible to predict replication outcomes as a function of z-values. Figure 1 shows power for z-value intervals below the x-axis. Expected replication rates increase from 54% for just significant results to over 90% for z-values greater than 5. Another 36 z-values have z-values greater than 6 that are practically guaranteed to replicate in exact replication studies. Figure 2 shows the expected replication rates and the observed replication rates for z-value ranges.
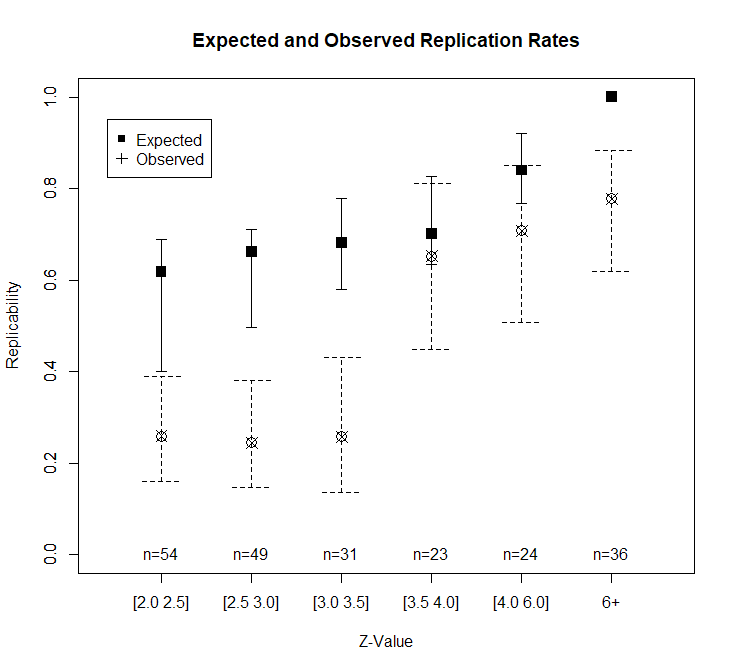
Studies with modest evidence (z = 2 to 3.5) replicate at significantly lower rates than expected based on z-curve. As expected, replication rates increase with stronger evidence. Given the small number of observations per bin, it is not possible to test whether z-curve predictions remain too optimistic at moderate z-values. The most surprising finding is that observed replication rates for studies with strong evidence (z > 6) fall below the expected rate.
In exploratory analyses, I examined possible reasons for these surprising replication failures. I used two large language models (ChatGPT and Claude) to score the replication reports of studies with strong original evidence (z > 6). Studies were coded on five dimensions (match of populations, materials, design, time period, and implementation) with scores from 0 to 2 each to produce total scores ranging from 0 to 10. Inter-rater agreement for the total scores was high, ICC(A,1) = .85, 95%CI = .73, .92. I averaged the two scores and used a total of 7 or higher as the criterion for a close match. Of the 24 close replications, 21 were successful (88%). Of the 12 studies that were not close replications, only 6 were successful (50%).
I further examined the three close replications that failed. While Farris et al. (2008) closely matched the original in many aspects, the original participants were from the US and the replication was conducted in the UK. Subsequent studies have replicated the finding with US samples (Farris et al., 2009/2010; Treat et al., 2017), ruling out a simple false positive explanation. The replication failure of Hurst and Kavanagh (2017) likely reflects a sampling problem in the original study. Participants from the general population and users of community mental health services were analyzed in a single analysis, which can inflate effect sizes (Preacher et al., 2005). McDevitt examined the influence of plumbing business names starting with numbers or A to be first in the yellow pages. A replication in 2020 cannot reproduce this effect because google searches replaced yellow pages.
While these exploratory results are based on a small sample, they support the broader claim that original results with strong evidence (z > 6) are likely to replicate in close replications and that failures may stem from meaningful differences in study design.
Conclusion
Z-curve analysis of two major replication projects reveals that replicability in the social sciences is not a single number. The expected replication rate based on the strength of original evidence (68%) substantially exceeds the observed replication rate (42%), indicating that effect size shrinkage beyond statistical regression to the mean contributes to replication failures. The false discovery rate is low (6%), confirming that most replication failures reflect reduced effect sizes rather than false positives. Adjusting the significance criterion to alpha = .005 reduces the estimated false discovery rate to 2%.
The most practically useful finding is that original results with strong evidence (z > 6) are highly replicable when the replication closely matches the original study design (88% success rate). Replication failures among these strong results were attributable to identifiable differences between the original and replication studies — different populations, changed market conditions, or heterogeneous samples. This suggests that the strength of statistical evidence, combined with methodological similarity, is a reliable predictor of replication success.
These findings argue against treating all significant results as equally credible and against interpreting average replication rates as informative about any particular study. Replicability is predictable from information already available in the original publication.