Debates about sex differences often swing between extremes. One narrative, familiar from strands of radical feminism, portrays masculinity as dangerous—a legacy of male violence and domination. The opposite story, popularized by Roy F. Baumeister’s Is There Anything Good About Men? (2010), recasts men as civilization’s heroic builders, unfairly maligned by modern culture. Both stories appeal to emotion and morality more than data.
This essay contrasts Baumeister’s narrative with the actual empirical evidence about evolution and sex (Evolution and Sex Differences in 2025). Unlike dramatic claims that men and women are fundamentally different (“Women are from Venus, Men Are from Mars”), scientific evidence shows that men and women evolved together with shared goals to maximize adaptive fitness. There are likely biological differences related to genetic variation in the sex-chromosomes (XX vs. XY), but even for traits that are strongly influenced by these genes, men and women are not fundamentally different.
2. Baumeister’s Core Thesis
Baumeister’s book advances a provocative claim: cultures “flourish by exploiting men.” He argues that throughout history men have been socially conditioned—and biologically predisposed—to take greater risks, work harder, and sacrifice themselves for collective benefit.
In his telling, male dominance in politics, science, and business reflects expendability and service, not privilege.
He describes men as driven by status and competition, while women, protected and valued for reproduction, focus on relationships and security.
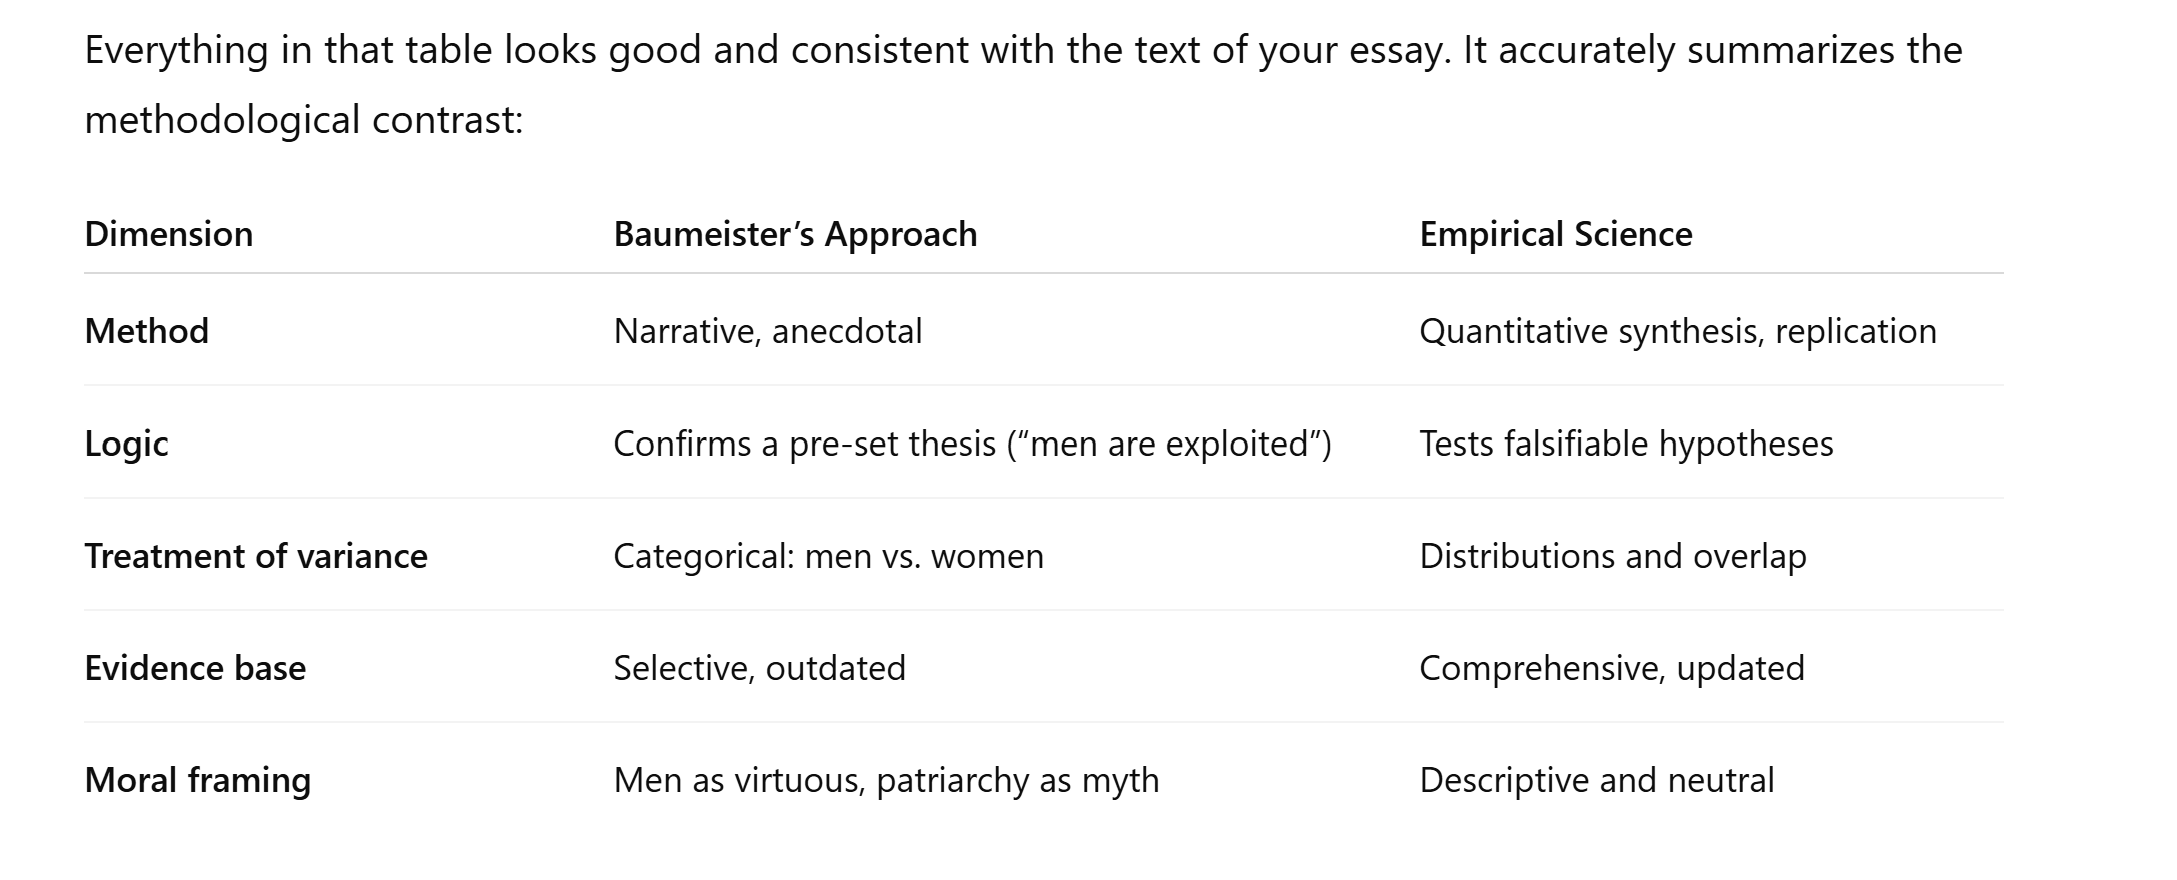
The argument is moral as much as evolutionary. Baumeister insists he speaks “as a scientist,” yet the book only mentions data that support his ideology. The story drives the data, not the data shape the theory. Data are only used when they verify a claim, never to falsify one—a hallmark of pseudoscience, as Karl Popper argued that genuine science advances by subjecting its theories to potential falsification.
He rarely quantifies differences or cites effect sizes, and he dismisses feminism and patriarchy as conspiracy theories. Instead, he offers anecdotes about male teachers, childbirth, and marital infidelity as evidence of “how the world works.”
3. What Empirical Science Shows
The cumulative evidence from behavioral genetics, developmental endocrinology, and cross-cultural psychology paints a more complex picture (Schimmack, 2025).
1. Magnitude of differences. An undisputed evolved sex difference is the height difference between men and women. The standardized effect size is about 1.5 standard deviations. While this number is abstract, it can serve as a benchmark for potentially evolved sex differences. Most psychological sex differences are small to moderate in size (average d ≈ 0.3–0.5). Distributions overlap substantially—typically more than 70%.
2. Outdated evolutionary theories also ignore that most traits are influenced by genes on the 22 pairs of autosomes that are mixed during reproduction and do not allow for biological sex differences. Any biological differences like those in height are rooted in the fact that men have a Y-chromosome and only one X-chromosome. For example, red-green color blindness is recessive on the X-chromosome and more common in men because the expression of this gene is more likely if only one X-chromosome is present.
3. Claims about achievement are especially fragile. First, sex differences in achievement related traits (Conscientiousness) are very small and tend to favor women, and once women are given a chance to compete they are doing as well as men. Baumeister, in psychology, should know that because the sex-ratio in psychology departments has shifted dramatically since the 1950s when gender-biases made it difficult for women in academia.
In short, scientific evidence shows that men and women as probabilistically different yet fundamentally similar; two overlapping variations of one cooperative species. Baumeister may not realize this because we all suffer from consensus bias; that is, we overestimate how many people are like us: Baumeister may overestimate how many men are like him.
4. Ideological Versus Scientific Reasoning
Baumeister’s reasoning resembles moral storytelling: good men, misunderstood by society, suffer for others. Science, by contrast, treats sex differences as empirical questions about magnitude, mechanism, and context. Men are not good or bad, but evolutionary theory explains why men are more likely to be bad people: rapists, murderers than women. This is one of the strongest sex differences that have been scientifically documented (Archer, 2019). They exist because small differences in mean levels of aggression and selfishness can produce large differences in the extremes of a trait. Toxic masculinity is real, but it is limited to a small number of toxic males.
5. Scientifically False Claims
The book makes many scientifically false claims that are ideologically motivated and risk normalizing or excusing abusive behavior.
1. “Research has suggested that most women have said ‘no’ when they meant ‘yes’ at least occasionally, which introduces a further element of confusion to even the most well-intentioned young man.”
Truth: Baumeister misrepresents the original study (Muehlenhard & Hollabaugh, 1988), which found that 39 percent of college women reported ever engaging in token resistance—not “most.” Later research shows this behavior is rare, context-dependent, and declining with improved sexual-education and consent norms (Humphreys, 2004). In contrast, sexual aggression is one of the largest documented sex differences: men are far more likely to be offenders and women to be victims (Archer, 2019). Baumeister’s framing inverts this reality.
2. Baumeister: “women are plenty aggressive—if anything, more violent than men.”
Truth:A meta-analysis of heterosexual partner aggression finds d ≈ –0.05 for act frequency, meaning women report slightly more minor acts—but men cause far more serious injuries (Archer, 2000). Across all forms of violence, the difference reverses dramatically: men commit the vast majority of homicides and serious assaults worldwide (Archer, 2019). Baumeister’s claim ignores the scale and severity of male violence and misrepresents the empirical record.
3. Baumeister “From the unfeeling perspective of the system, it could be worth it to restrict female access to education.” (p. 209)
Truth: Every cross-national dataset shows the opposite: female education increases social stability, child survival, and economic growth (UNESCO, 2019; World Bank, 2020). There is no conceivable “systemic advantage” to restricting women’s education—historically or evolutionarily. This statement is not only unsupported but directly contradicted by global evidence.
4. Baumeister: “After witnessing childbirth, many men find their wives sexually disgusting and thus cheat.” (pp. 246–247)
Truth: No scientific data link childbirth observation to marital infidelity. Longitudinal studies show that relationship satisfaction and communication, not childbirth disgust, predict sexual desire and fidelity (Lawson & Mullett, 2018). Baumeister’s anecdote pathologizes normal experiences of fatherhood without evidence.
5. Baumeister: There was and is no oppression of women; patriarchy is a conspiracy theory.
Truth: “Patriarchy” in social science refers to structural male advantage, not a secret male conspiracy. Historical and economic research documents centuries of legal, educational, and occupational exclusion of women (Goldin, 1990; England, 2010). Dismissing these constraints as myth denies overwhelming empirical documentation.
6. Baumeister: “Men are exploited by society; progress depends on male expendability.”
Truth: Men historically faced higher mortality in war and dangerous work, but these risks were tightly linked to male political and economic power. Men had the benefit of minimal investment in their reproductive success, while leaving women with the risk and costs of childbirth and child rearing. Baumeister’s framing ignores male exploitation by males, not women.
6. Ideological Consequences
Research confirms that exposure to Baumeister’s own Sexual Economics Theory—which portrays sex as a female resource traded for male investment—can shape social attitudes. Fetterolf & Rudman (2016) found that participants who viewed a video based on this theory endorsed more adversarial beliefs about heterosexual relationships, even after reading feminist rebuttals. This shows that ideas presented as neutral “science” can increase cynicism and hostility between the sexes.
Moreover, the book’s framing has been widely circulated in manosphere communities and cited on forums linked to misogynistic radicalization. In these contexts, Baumeister’s evolutionary language becomes moral ammunition, used to rationalize resentment toward women. Such diffusion illustrates how ideological narratives dressed as science can travel far beyond academia.
7. Why Scientific Caution Matters
Scientific reasoning differs from ideological rhetoric in three ways:
Falsifiability. Claims must be open to disconfirmation; Baumeister’s narrative is not.
Updating. Science revises itself when evidence changes; ideology repeats itself even when data contradict it.
Value neutrality. Science describes what is, not what ought to be. Moralizing about gender—positive or negative—distorts understanding.
In modern personality and evolutionary psychology, the consensus is clear: Men and women evolved under shared pressures for cooperation, mutual dependency, and parental investment, not perpetual conflict or one-sided exploitation.
8. Conclusion I: Men and Women Evolved on Earth
Baumeister’s Is There Anything Good About Men? invites sympathy for men but mistakes ideological comfort for scientific truth. By glorifying masculine extremes and dismissing opposing evidence, it replaces inquiry with mythmaking.
The scientific picture that emerges from decades of research is subtler and more interesting. Sex differences are real yet modest, biologically rooted yet culturally flexible. Both sexes show extraordinary variability, and both contributed to the survival of our species. Men and women did not evolve on separate planets; they evolved together, on Earth, as cooperative partners in a shared evolutionary story.
Baumeister’s research record reveals a consistent pattern of selective evidence use—choosing studies that support his claims while ignoring or concealing results that do not. His once-famous ego-depletion hypothesis—the idea that self-control operates like a limited resource—was based on publication-biased evidence.
Re-analyses of his own data show that the average effect size is close to zero once unpublished or failed studies are included (Schimmack, 2014, 2016, 2018, 2019, 2025). Meta-scientific investigations further document that his lab withheld null results, giving a misleading impression of robust support.
Baumeister himself admitted this practice in a personal email communication quoted by Schimmack:
“We did run multiple studies, some of which did not work, and some of which worked better than others. You may think that not reporting the less successful studies is wrong, but that is how the field works.”
This admission confirms that his work exemplified the publication-bias culture that triggered psychology’s credibility crisis. Rather than using data to test hypotheses, Baumeister routinely used them to confirm preconceived beliefs—the same confirmatory pattern visible in Is There Anything Good About Men?
Scientific integrity requires falsifiability, transparency, and full reporting. When these norms are ignored, claims cease to be scientific, even if they borrow the language of science. Authors who present untested opinions as empirical conclusions engage in narrative persuasion rather than data-driven inquiry—a form of writing closer to literature than to science.
Freedom of speech entitles Baumeister to publish ideological opinions, even offensive ones. But academic freedom is different: it protects the search for truth through open, verifiable evidence. Baumeister’s gender arguments, like his ego-depletion studies, fail that test. They are expressions of belief, not findings of science. The actual evidence shows not only that men and women are far more similar than his book suggests, but also that Baumeister’s own practices demonstrate a departure from scientific standards.
Key References
Archer, J. (2000). Sex differences in aggression between heterosexual partners: A meta-analytic review.Psychological Bulletin, 126(5), 651–680. Archer, J. (2019). The reality and evolutionary significance of human psychological sex differences. Biological Reviews, 94(4), 1381–1415. https://doi.org/10.1111/brv.12507 Baumeister, R. F. (2010). Is There Anything Good About Men? Oxford University Press. Popper, K. R. (1959). The logic of scientific discovery. London: Hutchinson. (Original work published 1934) Schimmack, U. (2014). Roy Baumeister’s R-Index – Replicability-Index
Personality psychology is built on the discovery that humans are not blank slates that can be programmed by reinforcement schedules; the strong, situationistic version of human nature that dominated psychology during the area of behaviorism and was maintained by experimental social psychologists.
Instead humans have personality that is reflected in everyday terms like kind, assertive, fearful, courageous, punctual, spontaneous, sociable, curious, or creative. Personality psychologists developed the Five Factor Model to describe the variation in people’s personalities at an abstract level. This model has been the dominant framework to study personality since the 1980s. Longitudinal and twin studies have shown that these personality traits are partially heritable, not much influenced by parenting, and highly stable in adulthood.
Not everybody is happy with the existence of stable personality traits, especially because some traits are considered to be undesirable. Many people would like to be less prone to anxiety and other negative thoughts and feelings. Others want to be more outgoing and sociable. Companies want their workers to be more achievement motivated and hard working. Teachers and professors would like their students to be more curious. This has led to research programs that make change of personality attainable.
One line of research examines voluntary personality change. Just like loosing weight is possible, changing personality is possible if you just want it and are willing to work on it. The evidence suggests that small changes of personality are possible, but even this evidence is not conclusive and limited to short follow-up periods.
This blog post is about the second line of research into personality change. The basic idea is that behaviors require skills and skills can be learned. Making eye contact with a stranger is just like riding a bike. The first time without training wheels, it can be scary, but then it gets easier. So people who are shy can just learn social skills to become more sociable. Some people are always late, but being on time is a skill that can be learned. Soto et al. (2022) call these social, emotional, and behavioral skills, and introduced the Behavioral, Emotional, and Social Skills Inventory (BESSI) to measure these skills.
The BESSI aims to measure 37 skills. The key difference between the measurement of skills and personality traits is the framing of self-report questions. Personality is typically measured by asking participants about their typical tendencies or behaviors. In contrast, the skills measure asks participants about their level of expertise.
“Its instructions asked participants to rate how well they could perform each behavior, reflecting their current level of expertise, on a scale ranging from 1 = not at all well (beginner) to 5 = extremely well (expert).” (Soto et al., 2022).
The rest of the question is often similar for skills and personality traits. For example, the Big Five Inventory item “Stays optimistic after experiencing a setback” is nearly identical to the BESSI item “Stay optimistic when things go wrong.”
The high similarity between personality and skill items raises concerns about participants’ willingness or ability to distinguish between these two questions. To demonstrate that they do, we need evidence of discriminant validity. That is, participants’ answers to the two questions should differ in a predictable manner.
In addition, the idea of personality skills raises some theoretical questions. If some people have optimism skills, why do they have a pessimistic personality that lowers their wellbeing. Why are these people not use the skills that they apparently posses to make themselves happier?
Evidence of Construct Validity
I am focusing on wellbeing because I study wellbeing/happiness. Personality skills may have benefits for other outcomes (e.g., better time management skills may help with productivity), but I was intrigued by the idea that people can learn specific skills that increase their wellbeing because other attempts to do so have not been very successful.
Soto et al. (2022) examined the relationship between BESSI scales and wellbeing in a study with 492 high-school students. Wellbeing was measured with Diener’s Satisfaction With Life Scale, a valid measure of subjective wellbeing. The 37 skill scales used to create five broader (domain) scales. Simple correlations were positive for all five skill domains. However, these simple correlations can be inflated by response styles like socially desirable responding. More informative are regression results. The regression results in Table 15 show the strongest unique positive relationship for Emotional Resilience skills, b = .3. Self-management and social engagement showed weaker positive relationships, b ~ .15. Cooperation skills were unrelated and innovation skills were negative related to wellbeing, b = -.23.
Further analyses suggested that two specific skill scales account for most of the variation in life-satisfaction, namely confidence regulation, b = .30, and capacity for optimism, b = .23. Together, these two scales imply that people who are above average on these two skills have a 75% chance of being above average in life-satisfaction. This effect size is stronger than the effect size for extraversion or income. Taken at face value, the results suggest that learning emotional resilience skills could make people happier.
Own Analyses
Study 1
In the new spirit of open science, Soto and colleagues shared their data (https://osf.io/4zgyr/) to allow independent researchers to critically examine the evidence. In the same spirit, I used their data to fit a measurement model to their data. The difference between this analysis and Soto et al.’s published result is that correlations with scale scores assume that scales are perfectly valid measures of the construct that they aim to measure. For example, it is assumed that the BESSI “Capacity for Optimism” scale is a perfect measure of individuals’ skills to maintain an optimistic attitude even during difficult times. Personality psychologists use scale scores even though they are aware that scales are not perfect measures. For example, Soto et al. (2022) note that “This positive manifold [positive correlations among all scales] likely reflects, at least in part, measurement artifacts (e.g., evaluative bias, response style, use of unipolar scales; Anusic et al., 2009; Goldberg, 1992; Rammstedt et al., 2013). However, it may also partly reflect a substantive individual difference (e.g., in people’s overall levels of functioning; Musek, 2007). Future research can test these possibilities” (p. 217).
My own analyses take up this request for future research using their own data to demonstrate and control for the influence of desirability bias in skill ratings on correlations between skills and life-satisfaction.
I also included other outcome variables in my analysis. The purpose of including other outcome variables is to explore how skills might influence life-satisfaction. For example, Soto et al. also included measures about relationships with parents and GPA. It is possible that some skills help to raise GPA which in turn might increase students’ life-satisfaction. Other skills might help to have better relationship with parents, which could also increase life-satisfaction of high school students.
In short, I use advanced statistical methods that have been around for 60 years to provide a better understanding of the relationship between personality skills and wellbeing, using Soto et al.’s data to test Soto et al.’s (2022) claim that the BESSI scales are valid measures of personality skills that predict – and possibly cause – variation in important life outcomes like life-satisfaction.
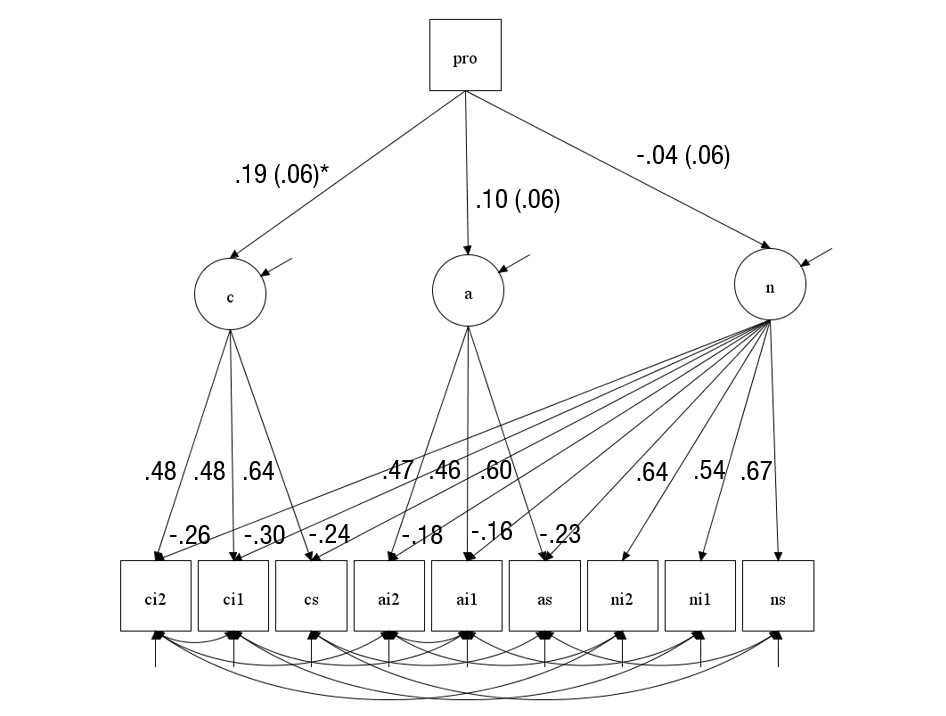
The BESSI has 192 items. It is not possible to fit a measurement model for 192 items with just 492 participants. Fortunately, it is not necessary to use all items to create a measurement model. A minimum of two items per construct is sufficient to create a measurement model. Initial analysis confirmed Soto et al.’s findings that life-satisfaction is mainly related to emotion regulation skills. Thus, these constructs were measured with more than two items to get more stable parameter estimates. The full results are reported on OSF (https://osf.io/5dqzv/). The key finding was that confidence skills were the only direct predictor of life-satisfaction with a strong effect size, b = .40, SE = .06. Additional unique predictors were relationship satisfaction with father, b = .35, SE = .06, relationship satisfaction with mother, b = .21, SE = .06, GPA, b = .16, SE = .06, and relationship with peers, b = 15, SE = .06. The only skill predictor of these life-satisfaction predictors was a negative effect of warmth skills on GPA. This produced a weak indirect relationship with life-satisfaction. Thus, the key finding is that confidence skills are the only reliable predictor of life-satisfaction. Of course, these results are limited to Soto et al.’s high-school student sample, but the other datasets did not include life-satisfaction measures to examine the generalizability of this finding.
Study 2
Study 1 assumed that the desirability factor reflects a rating bias. However, it may also partially reflect some real differences in skills. Study 2 examines this possibility by modeling personality and skill items in a single model. The data are from Soto et al.’s (2022) Study 4 with N = 313 university students. Students completed the BESSI and the BFI-2, a Big Five personality questionnaire developed by Soto and John (2017). The BFI-2 uses three facets for each of the Big Five traits and each facet is measured with four items.
I developed a measurement model for the BFI 2 with a desirability bias and an acquiescence bias factor. In Study 2, I used this model to examine convergent validity between the desirability factors for the BESSI and the BFI-2. In addition, I examine discriminant validity of the BESSI scales by examining the unique variance in BESSI scales that is not explained by desirability bias or the personality traits measured with the BFI-2.
The detailed results of the model and the code to reproduce the results are posed on OSF (https://osf.io/5dqzv/). The key finding is that the desirability factor of the BFI-2 was correlated very highly with the desirability factor of the BESSI scales, r = .84. In addition, the BESSI desirability factor was related to the acquiescence factor of the BFI-2, r = .22.
The following results show the factor loadings of the BESSI scales on the desirability factor, the relationship to the strongest personality predictor from the BFI-2, and the amount of explained and unique variance in the BESSI scales.
BESSI Scale
DESIRABILITY
PRED
Effect Size
EV
UV
SM-Time Management
0.39
RES
0.62
0.75
0.25
SM-Organizational Skills
0.48
ORG
0.80
0.86
0.14
SM-Capacity for Consistency
0.48
RES
0.63
0.63
0.37
SM-Task Management
0.45
PRO
0.83
0.89
0.11
SM-Detail Management
0.57
RES
0.56
0.65
0.35
SM-Rule Following Skill
0.45
RES
0.96
0.74
0.26
SM-Responsibility Management
0.61
RES
0.58
0.72
0.28
SM-Goal Regulation
0.71
RES
0.29
0.77
0.23
SM-Decision Making Skill
0.68
RES
0.45
0.66
0.34
SE-Leadership Skill
0.53
ASS
0.76
0.87
0.13
SE-Persuasive Skill
0.49
ASS
0.39
0.68
0.32
SE-Expressive Skill
0.59
SOC
0.36
0.48
0.52
SE-Conversational Skill
0.56
SOC
0.65
0.74
0.26
SE/SM-Energy Regulation
0.60
PRO
0.50
0.73
0.27
CO-Perspective Taking Skill
0.71
SYM
0.52
0.82
0.18
CO-Capacity for Trust
0.54
TRU
0.71
0.79
0.21
CO-Capacity for Social Warmth
0.68
EXT
0.43
0.75
0.25
CO-Teamwork Skill
0.66
POL
0.33
0.58
0.42
CO/SM-Ethical Competence
0.69
RES
0.30
0.60
0.40
ER-Stress Regulation
0.52
ANX
-0.62
0.84
0.16
ER-Capacity for Optimism
0.52
DEP
-0.68
0.77
0.23
ER-Anger Management
0.56
EMO
-0.51
0.70
0.30
ER-Confidence Regulation
0.52
DEP
-0.64
0.68
0.32
ER/SM-Impulse Regulation
0.55
CON
0.40
0.60
0.40
IN-Abstract Thinking Skill
0.73
INT
0.53
0.82
0.18
IN-Creative Skill
0.59
INV
0.70
0.84
0.16
IN-Artistic Skill
0.42
ART
0.48
0.65
0.35
IN-Cultural Competence
0.63
OPE
0.22
0.45
0.55
IN/SM Information Processing Skill
0.62
CON
0.32
0.48
0.52
XX-Self Reflection Skill
0.69
–
–
0.48
0.52
XX-Adaptability
0.63
ANX
-0.22
0.55
0.45
XX-Capacity For Independence
0.66
CON
0.33
0.58
0.42
The most important finding is that the confidence skill scale had a strong loading on the desirability factor, b = .52 and is strongly negatively related to the Depression facet of the BFI-2, r = -.64. Only 32% of the variance in this scale is unique variance that could add to the prediction of life-satisfaction above and beyond the variance explained by a depressive disposition. Previous studies have shown that a depressive personality is a strong predictor of life-satisfaction (Anglim et al., 2020; Røysamb, Nes Czajkowski, & Vassend, 2018; Schimmack, Oishi, Furr, & Funder, 2004). A latent variable analysis of Anglim et al.’s data showed an effect size of b = .6 for the depression facet of the IPIP-300. With effect sizes of r = -.64 between depressiveness and confidence skills and r = .6 for depressiveness and life-satisfaction, depressiveness accounts for most of the correlation between confidence skills and life-satisfaction in Study 1, r = .40. Thus, the existing data suggest that confidence skills do not make a strong unique contribution to life-satisfaction. However, it remains possible that confidence skills have an indirect effect on life-satisfaction under the assumption that confidence skills reduce the disposition to experience depressive affect. However, this is an unproven causal assumption and it is equally possible that people who are prone to depression rate themselves as low on confidence skill items.
In conclusion, Soto et al.’s article provides no evidence for the claim that personality skills measured with the BESSI influence life-satisfaction or that improving these skills would produce an increase in life-satisfaction.
Study 3: Multi-Method Study
The most important form of construct validity examines convergent validity across different methods. In personality psychology, the most common approach to provide this information is to complement self-ratings with informant ratings by knowledgeable others like parents, spouses, or close friends. Soto et al. (2022) did not provide information about convergent validity, but a large project by the OECD (Organization for Economic Cooperation and Development) obtained data on children’s personality skills, using self-ratings, ratings by a caregiver (mostly mothers), and a teacher. These data were used in a JPSP article by Guo, Tang, Marsh et al. (2022) to relate personality skills to life-satisfaction.
The abstract claims that the “inclusion of multi-informant ratings substantially enhanced the ability of social–emotional skills in predicting outcome variables, with parent- and self-rated skills playing important, unique roles” (p. 1079). The results section reports that personality skills explained 70% of the variance in life-satisfaction! This is an unbelievable result because the outcome measure was a single life-satisfaction rating that have at best 70% reliable variance. Thus, the authors are claiming that life-satisfaction is fully determined by personality skills. This is implausible because 40% of the reliable variance in life-satisfaction judgments is heritable and stable over long periods of time, whereas skills are by definition learned behaviors. The estimate is also vastly larger than the effect size estimate based on Soto et al.’s (2022) data.
Another major problem of their analysis was that they used ratings by all three raters as predictor variables. This decision implies that each skill measure measures a unique construct without measurement error. However, the authors’ do not explain how self-reported skills are conceptually different from informant rated skills. Theoretically, a skill is a skill is a skill and does not depend on the observer of a skill. Either I can ride a bike or I cannot ride a bike. Thus, it makes more sense to treat unique variance in ratings by a single rater as systematic measurement error and to use the shared variance among raters as a measure of the actual skill. This use of multi-method data is the most commonly used approach to separate construct variance from method variance. I therefore conducted a proper multi-method analyses of the openly accessible OECD data. The complete results are posted on OSF.
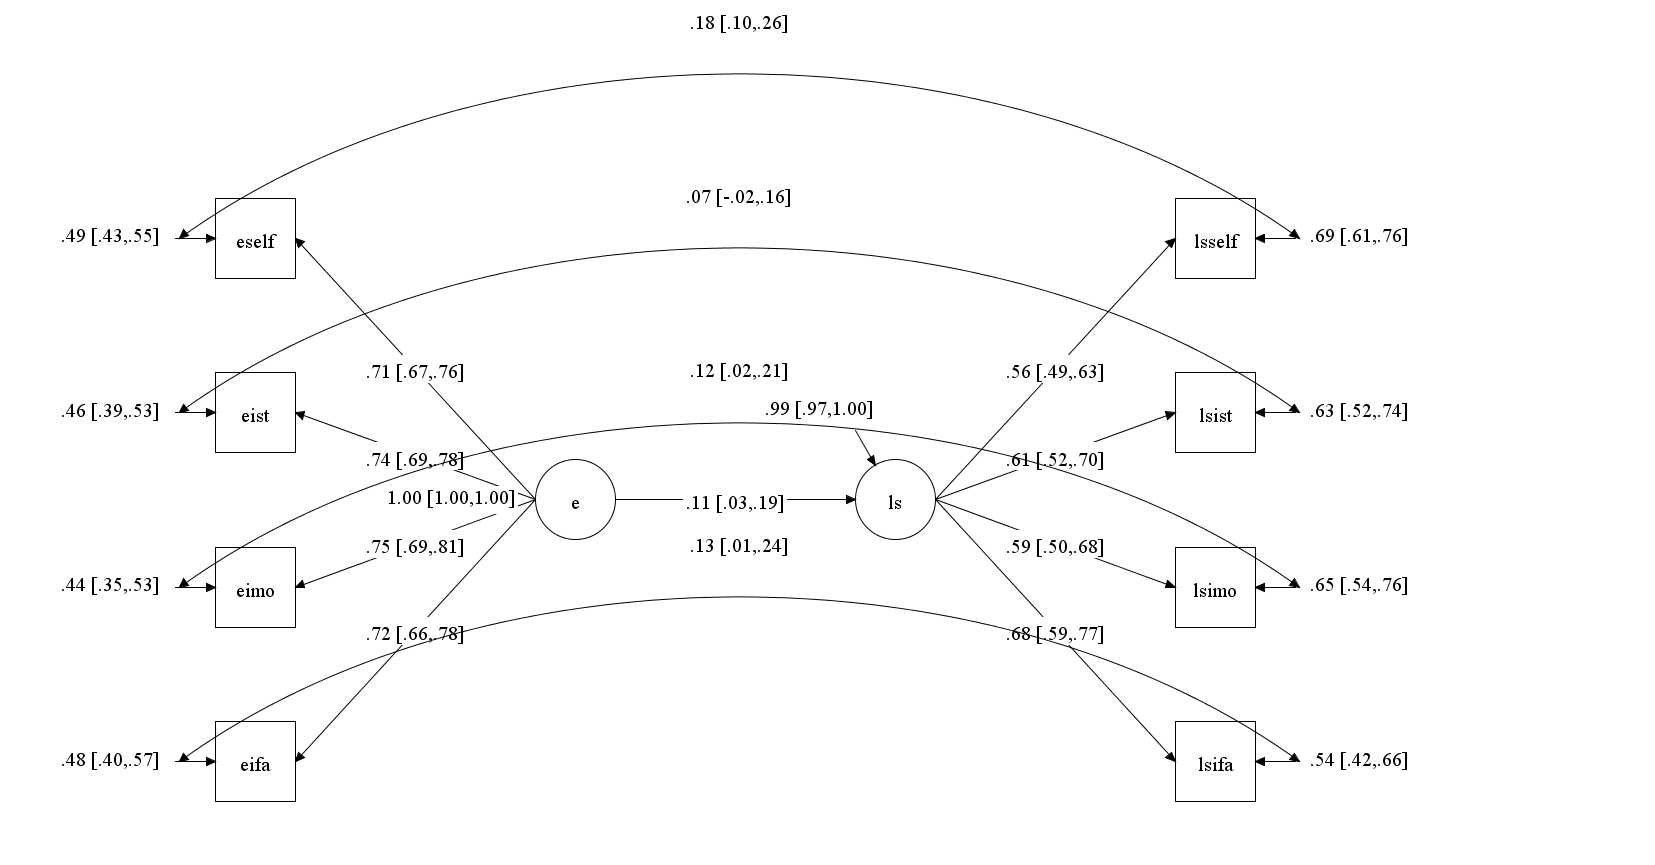
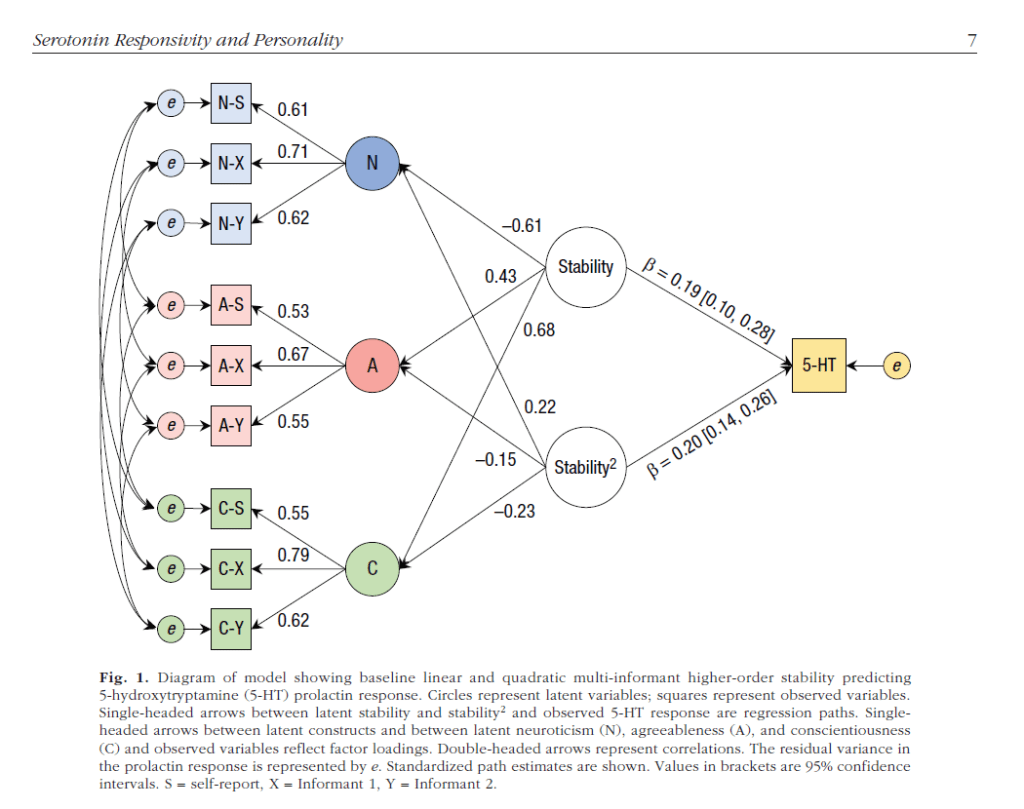
I used a multi-group model to distinguish between younger ((10y) and older (15y) cohorts. The measurement model assumed equal validity for parent ratings, but allowed for different validity of self-ratings, under the assumption that cognitive abilities to make self-ratings increase from age 10 to 15. Method variance was modeled with residual correlations among ratings by the same rater. Correlations showed the strongest simple correlation for the Optimism skill factor followed by the Energy skill factor. I followed up on this model with a regression model. The only statistically significant predictor was the Optimism skill factor. The effect size was smaller for the younger cohort, b = .27, than for the older cohort, b = .44. One possible explanation for this finding is that skills become more important as children become more autonomous. Another explanation could be that life-satisfaction ratings of younger children are less valid. However, even the strong effect size of b = .44 in the older cohort implies that skills explain only 20% of the variance in life-satisfaction, not 70% as claimed in Guo et al.’s article.
For some unknown reason, Guo et al. limited their analysis to the Finish sample. Table 2 reports the results for the Finish and the other samples. The results for the Finish sample produced somewhat stronger effect sizes with b = .42 in the younger cohort and b = .53 in the older cohort. Thus, while skills may play a bigger role in Finland, the authors failed to point out that data from other nations were available and produce weaker effect size estimates.
Sample
Younger
Older
Canada (Ottowa)
0.58
0.33
USA (Huston)
0.40
0.41
Columbia (Bogota)
0.26
0.49
Columbia (Manizales)
0.36
0.44
Finland (Helsinki)
0.43
0.53
Russia (Moscow)
0.32
0.48
Turkey (Istanbul)
0.34
0.54
Sout Korea (Daegu)
0.37
0.44
China (Suzhou)
0.20
0.21
Importantly, even the strong effect sizes of b > .5 for the younger cohort in Canada and the older cohorts in Finland and Turkey do not provide strong evidence that optimism skills can be learned and increase life-satisfaction. A plausible alternative explanation is that skill measures are confounded with inherited personality traits.
General Discussion
The scientific search for predictors of life-satisfaction is nearly 100-years old (Hartmann, 1936). If these predictors are causes of life-satisfaction, changes in the predictors would result in changes in life-satisfaction. Decades of research have identified some predictors of life-satisfaction that are stable and others that can change. Twin studies suggest that stable predictors like personality traits are partially inherited and difficult to change. Twin studies and longitudinal studies also show that other factors can change and predict changes in wellbeing. For example, marriage and divorce produce changes in life-satisfaction.
The concept of personality – socio-emotional -skills is relatively knew and aims to bridge stable and changing predictors of life-satisfaction. The key distinction between a personality trait and a personality skill is that personality skills are learned behaviors. It is assumed that they are “social–emotional skills are more malleable than cognitive skills through targeted interventions, programs, and policies” (p. 1080). This assumption implies that it is possible to teach children skills that can improve their life-satisfaction. Two studies suggest that the key skills that predict life-satisfaction are related to self-esteem, confidence, and optimism. This finding is consistent with evidence that personality traits related to self-esteem are strong predictors of life-satisfaction. However, the existing evidence makes it impossible to assess whether skill measures are valid measures of learned skills or whether these measures merely reflect differences in personality traits.
Future research needs to validate skill measures and demonstrate that interventions can actually change self-esteem and life-satisfaction. At present, the assumption that happiness is a skill that can be learned lacks empirical support, contrary to the sweeping and invalid claims in prominent publications that suggest skill measures are valid and that skills have a strong influence on life-satisfaction.
This is a critique of the unscientific backwards way to study hierarchical structures advocated in Goldberg’s (2006) article “Doing it all Bass-Ackwards: The development of hierarchical factor structures from the top down”
“Bass-ackward” is an informal, euphemistic, and idiomatic term that means in a backward or inept way. It is an anagram of the phrase “ass-backward
The main problem with this article is that it presents a misleading and false way to examine hierarchical structures that has impeded the use of a proper method to do so. Many articles have used this method to presented meaningless results. Goldberg even noted in his original article.
To many factor theorists, the structural representations included in this article are not truly “hierarchical,” in the sense that this term is most often used in the methodological literature (e.g., Yung, Thissen, & McLeod, 1999).
However, the proper method requires thinking and some understanding of covariance structures. This is typically not taught in psychology programs and few personality psychologists have the intrinsic motivation or ability to learn these techniques on their own. Moreover, reviewers would not understand these article. Therefore they rather use a backwards method that doesn’t care whether the results actually match the data.
Introduction
One important scientific activity is to find common elements among objects. Well-known scientific examples are the color wheel in physics, the periodic table in chemistry, and the Linnaean Taxonomy in biology. A key feature of these systems is the assumption that objects are more or less similar along some fundamental features. For example, similar animals in the Linnaean Taxonomy share prototypical features because they have a more recent common ancestor.
The prominences of classification systems in mature sciences suggests that psychology could also benefit from classification of psychological objects. A key goal of psychological science is to understand human’s experiences and behaviors. At a very abstract level, the causes of experiences and behaviors can be separated into situational and personality factors (Lewin, 1935). The influence of personality factors can be observed when individuals act differently in the same situation. The influence of situations is visible when the same person acts differently in differently situations.
Personality psychologists have worked on a classification system of personality factors for nearly a century, starting with Allport and Odbert (1936) catalogue of trait words, and Thurstone’s (1934) invention of factor analysis. Factor analysis has evolved and there are many different options to conduct a factor analyses. The most important development was the invention of confirmatory factor analysis (Joreskog, 1969). Confirmatory factor analysis has several advantages over traditional factor analytic models that are called exploratory factor analyses to distinguish them from confirmatory analyses. Confirmatory factor analysis has several advantages over exploratory factor analysis. The most important advantage is the ability to test hierarchical models of personality traits (Marsh & Myers, 1986). The specification of hierarchical models with CFA is called hierarchical factor analysis. Despite the popularity of hierarchical trait models, personality researchers continue to rely on exploratory factor analysis as the method of choice. This methodological choice impedes progress in the search for a structural model of personality traits.
Metaphorical Science
A key difference between EFA and CFA is that EFA is atheoretical. The main goal is to capture the most variance in observed variables with a minimum of factors. This purely data driven criterion implies that the number of factors and the nature of factors is arbitrary. In contrast, CFA models aim to fit the data and it is possible to compare models with different numbers of factors. For example, EFA would have no problem of showing a single first factor, even if feminine and masculine traits were independent (Marsh & Myers, 1986). However, such a model might show bad fit, and model comparison could show that a model with two factors fits the data better. The lack of model fit in traditional EFA applications may explain Goldberg’s attempt to explore hierarchical structures with a series of EFA models that specify different numbers of factors, starting with a single factor and adding one more factor at each step. For all solutions, factors are rotated based on some arbitrary criterion. Goldberg prefers Varimax rotation. As a consequence, factors within the same model are uncorrelated. His Figure 2 shows the results when this approach was used for a large number of personality items.
To reinforce the impression that this method reveals a hierarchical structure, factors at different levels are connected with arrows that point from the higher levels to the lower levels. Furthermore, correlations between factor scores are used to show how strong factors at different levels are related. Readers may falsely interpret the image as evidence for a hierarchical model with a general factor on top. Goldberg openly admits that his method does not hierarchical causal models and that none of the levels may correspond to actual personality factors.
‘To many factor theorists, the structural representations included in this article are not truly “hierarchical,” in the sense that this term is most often used in the methodological literature (e.g., Yung, Thissen, & McLeod, 1999). For those who define hierarchies in conventional ways, one might think of the present procedure in a metaphorical sense” (p. 356).
The difference between a conventional and unconventional hierarchical model is best explained by the meaning of a directed arrow in a hierarchical model. In a conventional model, an arrow implies a causal effect and causal effects of a common cause produce a correlation between the variables that share a common cause (PSY100). For example, in Figure 1 , the general factor correlates r = .79 with the first factor a level 2 and r = .62 with the second factor at level 2. The causal interpretation of these path coefficients would imply that the correlation between the two level-2 factors is .79 x .62 = .49. Yet, it is clear that this prediction is false because factors at the same level were specified to be independent. It therefore makes no sense to draw the arrows in this direction. Goldberg realizes this, but does it anyways.
“While the author has found it useful to speak of the correlations between factor scores at different levels as “path coefficients,” strictly speaking they are akin to part-whole correlations, but again the non-traditional usage can be construed metaphorically” .
It would have been better to draw the arrows in the opposite direction because we can interpret the reversed path coefficients as information about the loss of information when the number of factors is reduced by one. For example, the correlation of r = .79 between the first level 2 factor and the general factor implies that the general factor sill captures .79^2 = 62% of the variance of the first level 2 factor and 38% of the variance is lost in the one-factor model. Goldberg fittingly called his approach ass-backwards and that means the arrows need be interpreted in the reverse direction.
The key advantages of Goldberg’s approach is that researchers did not need to buy additional software before R made CFA free of charge, did no have to learn structural equation modeling, and did not have to worry about model fit. A hierarchical structure with a general factor could always be found, even if the first factor is unrelated to some of the lower factors (see Figure 3 in Goldberg).
There is also no need to demonstrate consistency across datasets. The factors in he two models show different relations to the five factors at the lowest level. This is the beauty of metaphorical science. Every analysis provides a new metaphor that reflects personality without any ambition to reveal fundamental factors that influence human behavior.
Metaphorical Pathological Traits
It would be unnecessary to mention Goldberg’s metaphorical hierarchical models, if personality researchers had ignored his approach and used CFA to test hierarchical models. in fact, there have been no notable applications of Goldberg’s approach in mainstream personality psychology. However, the method has gained popularity among clinical psychologists interested in personality disorders. A highly cited article by Kotov et al. (2017) claims that Goldberg’s method “supported the presence of a p factor, but also suggested that multiple meaningful structures of different generality exist between the six spectra and a p factor” (p. 463). I do not doubt that meaningful metaphors can be found to describe maladaptive traits, but it is problematic that interpretability is the sole criterion to justify the claim of a hierarchical structure of personality factors that may cause intrapersonal and interpersonal problems. Although Kotov et al. (2017) mention confirmatory factor analysis as a potential research tool, they do not mention that Goldberg’s method is fundamentally different from hierarchical CFA.
The most highly cited application of Goldberg’s method is published in an article by Wright, Thomas, Hopwood, Markon, Pincus, and Krueger (2012). The data are undergraduate (N = 2,461) self-ratings on the 220 items of the Personality Inventory for DSM-5. The 220 items are scored to provide information about 25 maladaptive traits that are correlated with each other. Wright et al. show that the correlations among the 25 scales can be represented with five correlated factors, but they do not provide fit indices of the five-factor solution. Correlations among the five factors ranged from r = .043 to .437.
Figure 1 in Wright et al. (2012 shows Goldberg’s hierarchical structure.
Naive interpretation of the structure and path coefficient seems to suggest the presence of a strong general factor that contributes to personality pathology. This general factor appears to explain a large amount of variance in internalizing and externalizing personality problems. Internalizing and externalizing factors explain considerable variance in four of the five primary factors, but psychoticism appears to be rather weakly related to the other traits and the p-factor. However, this interpretation of the results is only metaphorical.
A proper interpretation of the hierarchy focuses on the variance that is lost when five factors are reduced to fewer factors. For example, by combining the internal and external factors into a single p-factor implies that 72% of the variance in internalizing traits is retrained and 28% are lost. For externalizing traits, only 32% of the variance is retained and 68% is lost. Combined the reduction of two factors to one factors leads to a loss of 96% of the variance. This implies that the two factors are orthogonal because reducing two independent factors to one leads to a loss of 50% of the variance in each and a loss of 100% of the variance in both (200% total). Thus, rather than supporting the presence of a strong p-factor, Figure 1 actually suggests that there is no strong general factor. This is not surprising when we look at the correlations among the factors. Negative affect (internalizing) correlated weakly with the externalizing factors antagonism, r = .04, and disinhibition, r = .09. These correlations suggest that internalizing and externalizing traits are independent, rather than sharing a common influence of a general pathology factor.
Hierarchical Confirmatory Factor Analysis
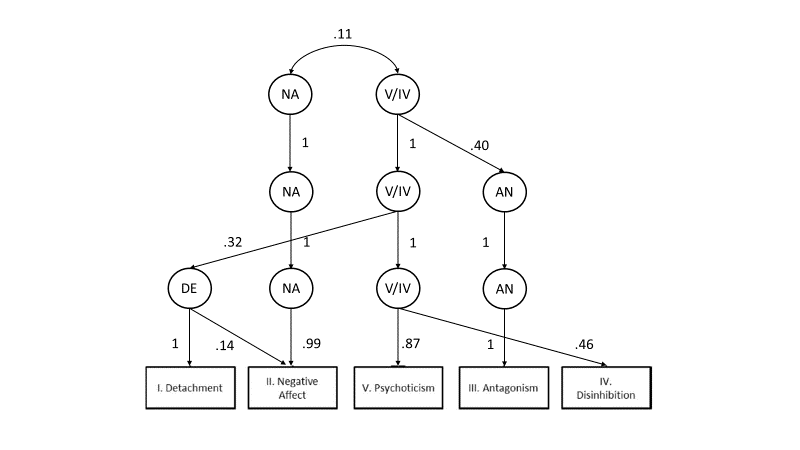
I used the correlation matrix in Wright et al.’s (2012) Table 1 to build a hierarchical model with CFA. The first model imposed a hierarchical structure with 4 levels and a correlation between the top two factors. It would have been possible to specify a general factor, but the loadings of the two factors on this general factor are not determined. The model had good fit, chi2 (2) = 2.51, CFI = 1.000, RMSEA = .010.
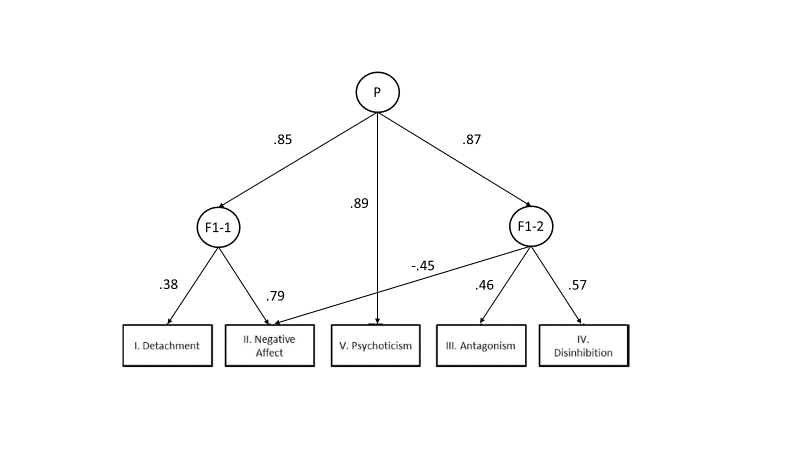
The first observation is that the top two factors are only weakly correlated, r = .11. This supports the conclusion that there is no evidence for a general factor of personality pathology that contributes substantially to correlations among specific PID-5 scales. The second observation is that many factors at higher levels are identical to lower level traits. Thus, the observation that there are factors at all levels is illusory. The NA factor at the highest level is practically identical with the NA factor at the lowest level. The duplication of factors at various levels is unnecessary and confusing. Therefore I built a truly hierarchical CFA model that does not specify the number of levels in the hierarchy a priori. This model also had good fit, chi2(df = 2) = 2.51, CFI = 1.000, RMSEA = .010.
The model shows that detachment and negative affect are related to each other by a shared factor (F1-1) that could be interpreted as internalizing. Similarly, Antagonism and Disinhibition share a common factor (F1-2) that could be labeled externalizing. At a higher level, a general factor relates these two factors as well as psychoticism. The loadings on the general factor are high, suggesting that scores on the PID-5 scales are correlated with each other because they share a single common factor. The low correlations between Negative Affect and externalizing are attributed to a negative relationship of the externalizing factor (F1-2) and Negative Affect.
The good fit of these models does not imply that they capture the true nature of the relationships among PID-5 scales. It is also not clear whether the p-factor is a substantive factor or reflects response styles. However, unlike Goldberg’s method, HCFA can be used to test hierarchical models of personality traits. Thus, researchers who are speculating about hierarchical structures need to subject their models to empirical tests with HCFA. Goldberg’s method is metaphorical, unsuitable, and unscientific. It creates the illusion that it reveals hierarchical structures, but it merely shows which variances are lost in models with fewer factors. In contrast, HCFA can be used to test models that aim to explain variance rather than throwing it away.
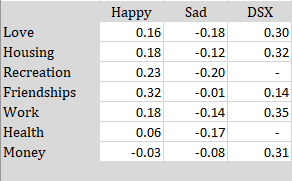
This is the third part in a mini-series of building a monster-model of well-being. The first part (Part1) introduced the measurement of well-being and the relationship between affect and well-being. The second part added measures of satisfaction with life-domains (Part 2). Part 2 ended with the finding that most of the variance in global life-satisfaction judgments is based on evaluations of important life domains. Satisfaction in important life domains also influences the amount of happiness and sadness individuals experience, but affect had relatively small unique effects on global life-satisfaction judgments. In fact, happiness made a trivial, non-significant unique contribution.
The effects of the various life domains on happiness, sadness, and the weighted average of domain satisfactions is shown in the table below. Regarding happy affective experiences, the results showed that friendships and recreations are important for high levels of positive affect (experiencing happiness), but health or money are relatively unimportant.
In part 3, I am examining how we can add the personality trait extraversion to the model. Evidence that extraverts have higher well-being was first reviewed by Wilson (1967). An influential article by Costa and McCrae (1980) showed that this relationship is stable over a period of 10 years, suggesting that stable dispositions contribute to this relationship. Since then, meta-analyses have repeatedly reaffirmed that extraversion is related to well-being (DeNeve & Cooper, 1998; Heller et al., 2004; Horwood, Smillie, Marrero, Wood, 2020).
Here, I am examining the question how extraversion influences well-being. One criticism of structural equation modeling of correlational, cross-sectional data is that causal arrows are arbitrary and that the results do not provide evidence of causality. This is nonsense. Whether a causal model is plausible or not depends on what we know about the constructs and measures that are being used in a study. Not every study can test all assumptions, but we can build models that make plausible assumptions given well-established findings in the literature. Fortunately, personality psychology has established some robust findings about extraversion and well-being.
First, personality traits and well-being measures show evidence of heritability in twin studies. If well-being showed no evidence of heritability, we could not postulate that a heritable trait like extraversion influences well-being because genetic variance in a cause would produce genetic variance in an outcome.
Second, both personality and well-being have a highly stable variance component. However, the stable variance in extraversion is larger than the stable variance in well-being (Anusic & Schimmack, 2016). This implies that extraversion causes well-being rather than the other way-around because causality goes from the more stable variable to the less stable variable (Conley, 1984). The reasoning is that a variable that changes quickly and influences another variable would produce changes, which contradicts the finding that the outcome is stable. For example, if height were correlated with mood, we would know that height causes variation in mood rather than the other way around because mood changes daily, but height does not. We also have direct evidence that life events that influence well-being such as unemployment can change well-being without changing extraversion (Schimmack, Wagner, & Schupp, 2008). This implies that well-being does not cause extraversion because the changes in well-being due to unemployment would then produce changes in extraversion, which is contradicted by evidence. In short, even though the cross-sectional data used here cannot test the assumption that extraversion causes well-being, the broader literature makes it very likely that causality runs from extraversion to well-being rather than the other way around.
Despite 50-years of research, it is still unknown how extraversion influences well-being. “It is widely appreciated that extraversion is associated with greater subjective well-being. What is not yet clear is what processes relate the two” ((Harris, English, Harms, Gross, & Jackson, 2017, p. 170). Costa and McCrae (1980) proposed that extraversion is a disposition to experience more pleasant affective experiences independent of actual stimuli or life circumstances. That is, extraverts are disposed to be happier than introverts. A key problem with this affect-level model is that it is difficult to test. One way of doing so is to falsify alternative models. One alternative model is the affective reactivity model. Accordingly, extraverts are only happier in situations with rewarding stimuli. This model implies personality x situation interactions that can be tested. So far, however, the affective reactivity model has received very little support in several attempts (Lucas & Baird, 2004). Another model assumes that extraversion is related to situation selection. Extraverts may spend more time in situations that elicit pleasure. Accordingly, both introverts and extraverts enjoy socializing, but extraverts actually spend more time socializing than introverts. This model implies person-situation correlations that can be tested.
Nearly 20 yeas ago, I proposed a mediation model that assumes extraversion has a direct influence on affective experiences and the amount of affective experiences is used to evaluate life-satisfaction (Schimmack, Diener, & Oishi, 2002). Although cited relatively frequently, none of these citations are replication studies. The findings above cast doubt on this model because there is no direct influence of positive affect (happiness) on life-satisfaction judgments.
The following analyses examine how extraversion is related to well-being in the Mississauga Family Study dataset.
1. A multi-method study of extraversion and well-being
I start with a very simple model that predicts well-being from extraversion, CFI = .989, RMSEA = .027. The correlated residuals show some rater-specific correlations between ratings of extraversion and life-satisfaction. Most important, the correlation between the extraversion and well-being factors is only r = .11, 95%CI = .03 to .19.
The effect size is noteworthy because extraversion is often considered to be a very powerful predictor of well-being. For example, Kesebir and Diener (2008) write “Other than extraversion and neuroticism, personality traits such as extraversion … have been found to be strong predictors of happiness” (p. 123)
There are several explanations for the week relationship in this model. First, many studies did not control for shared method variance. Even McCrae and Costa (1991) found a weak relationship when they used informant ratings of extraversion to predict self-ratings of well-being, but they ignored the effect size estimate.
Another possible explanation is that Mississauga is a highly diverse community and that the influence of extraversion on well-being can be weaker in non-Western samples (r ~ .2, Kim et al. , 2017.
I next added the two affect factors (happiness and sadness) to the model to test the mediation model. This model had good fit, CFI = .986, RMSEA = .026. The moderate to strong relationships from extraversion to happy feelings and happy feelings to life-satisfaction were highly significant, z > 5. Thus, without taking domain satisfaction into account, the results appear to replicate Schimmack et al.’s (2002) findings.
However, including domain satisfaction changes the results, CFI = .988, RMSEA = .015.
Although extraversion is a direct predictor of happy feelings, b = .25, z = 6.5, the non-significant path from happy feelings to life-satisfaction implies that extraversion does not influence life-satisfaction via this path, indirect effect b = .00, z = 0.2. Thus, the total effect of b = .14, z = 3.7, is fully mediated by the domain satisfactions.
A broad affective disposition model would predict that extraversion enhances positive affect across all domains, including work. However, the path coefficients show that extraversion is a stronger predictor of satisfaction with some domains than others. The strongest coefficients are obtained for satisfaction with friendships and recreation. In contrast, extraversion has only very small relationships with financial satisfaction, health satisfaction, or housing satisfaction that are not statistically significant. Inspection of the indirect effects shows that friendship (b = .026), leisure (.022), romance (.026), and work (.024) account for most of the total effect. However, power is too low to test significance of individual path coefficients.
Conclusion
The results replicate previous work. First, extraversion is a statistically significant predictor of life-satisfaction, even when method variance is controlled, but the effect size is small. Second, extraversion is a stronger predictor of happy feelings than life-satisfaction and unrelated to sad feelings. However, the inclusion of domain satisfaction judgments shows that happy feelings do not mediate the influence of extraversion on life-satisfaction. Rather, extraversion predicts higher satisfaction with some life domains. It may seem surprising that this is a new finding in 2021, 40-years after Costa and McCrae (1980) emphasized the importance of extraversion for well-being. The reason is that few psychological studies of well-being include measures of domain satisfaction and few sociological studies of well-being include personality measures (Schimmack, Schupp, & Wagner, 2008). The present results show that it would be fruitful to examine how extraversion is related to satisfaction with friendships, romantic relationships, and recreation. This is an important avenue for future research. However, for the monster model of well-being the next step will be to include neuroticism in the model. Continue here to go to Part 4
With 4,366 citations in WebOfScience, Taylor and Brown’s article “ILLUSIONS AND WELL-BEING: A SOCIAL PSYCHOLOGICAL PERSPECTIVE ON MENTAL-HEALTH” is one of the most cited articles in social psychology.
The key premises of the article is that human information processing is faulty and that mistakes are not random. Rather human information processing is systematically biased.
Taylor and Brown (1988) quote Fiske and Taylor’s (1984) book about social cognitions to support this assumption. “Instead of a naïve scientist entering the environment in search of the truth, we find the rather unflattering picture of a charlatan trying to make the data come out in a manner most advantageous to his or her already-held theories” (p. 88).
30 years later, a different picture emerges. First, evidence has accumulated that human information processing is not as faulty as social psychologists assumed in the early 1980s. For example, personality psychologists have shown that self-ratings of personality have some validity (Funder, 1995). Second, it has also become apparent that social psychologists have acted like charlatans in their research articles, when they used questionable research practices to make unfounded claims about human behavior. For example, Bem (2011) used these methods to show that extrasensory perception is real. This turned out to be a false claim based on shoddy use of the scientific method.
Of course, a literature with thousands of citations also has produced a mountain of new evidence. This might suggest that Taylor and Brown’s claims have been subjected to rigorous tests. However, this is actually not the case. Most studies that examined the benefits of positive illusions relied on self-ratings of well-being, mental-health, or adjustment to demonstrate that positive illusions are beneficial. The problem is evident. When self-ratings are used to measure the predictor and the criterion, shared method variance alone is sufficient to produce a positive correlation. The vast majority of self-enhancement studies relied on this flawed method to examine the benefits of positive illusions (see meta-analysis by Dufner, Gebauer, & Sedikides, 2019).
However, there are a few attempts to demonstrate that positive illusions about the self predict well-being measures is measured by informant ratings to reduce the influence of shared method variance. The most prominent example is Taylor et al. (2003) article ” Portrait of the self-enhancer: Well adjusted and well liked or maladjusted and friendless.” [Sadly, this was published in the Personality section of JPSP]
The abstract gives the impression that the results clearly favored Taylor’s positive illusions model. However, a closer inspection of reality shows that the abstract is itself illusory and disconnected from reality.
First, the study had a small sample size (N = 92). Second, only about half of these participants . Informant ratings were obtained from a single friend, but only 55 participants identified a friend who provided informant ratings. Even in 2003, it was common to use larger samples and more informants to measure well-being (e.g., Schimmack, & Diener, 2003). Moreover, friends are not as good as family members to report on well-being (Schneider & Schimmack, 2009). It only attests to Taylor’s social power that such a crappy, underpowered study was published in JPSP.
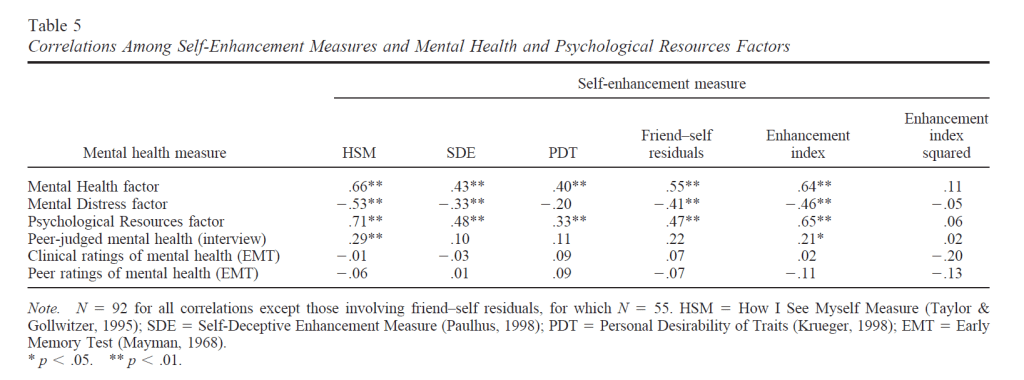
The results showed no significant correlations between various measures of positive illusions (self-enhancement) and peer-ratings of mental health (last row).
Thus, the study provided no evidence for the claim in the abstract that positive illusions about the self predict well-being or mental health without the confound of shared method variance.
Meta-Analysis
Dufner, Gebauer, Sedikides, and Denissen (2019) conducted a meta-analysis of the literature. The abstract gives the impression that there is a clear positive effect of positive illusions on well-being.
Not surprisingly, studies that used self-ratings of adjustment/well-being/mental health showed positive association. The more interesting question is how self-enhancement measures are related to non-self-report measures of well-being. Table 3 shows that the meta-analysis identified 22 studies with an informant-rating of well-being and that these studies showed a small positive relationship, r = .12.
I was surprised that the authors found 22 studies because my own literature research uncovered fewer studies. So, I took a closer look at the 22 studies included in the meta-analysis (see APPENDIX).
Many of the studies relied on measures of social desirable responding (Marlow-Crowne Social Desirability Scale, Balanced -Inventory-of-Desirable Responding) as a measure of positive illusions. The problem with these studies is that social desirability scales also contain a notable portion of real personality variance. Thus, these studies do not conclusively demonstrate that illusions are related to informant ratings of adjustment. Paulhus’s studies are problematic because adjustment ratings were based on first-impressions in a zero-acquaintance relationship, and the results changed over time. Self-enhancers were perceived as better adjusted in the beginning, but as less adjusted later on. The problem here is that well-being ratings in this context have low validity. Finally, most studies were underpowered given the estimated population effect size of r = .12. The only reasonably powered study by Church et al. with 900 participants produced a correlation of r = .17 with an unweighted measure and r = .08 with a weighted measure. Overall, this evidence does not provide clear evidence that positive illusions about the self have positive effects. They actually show that any beneficial effects would be small.
New Evidence
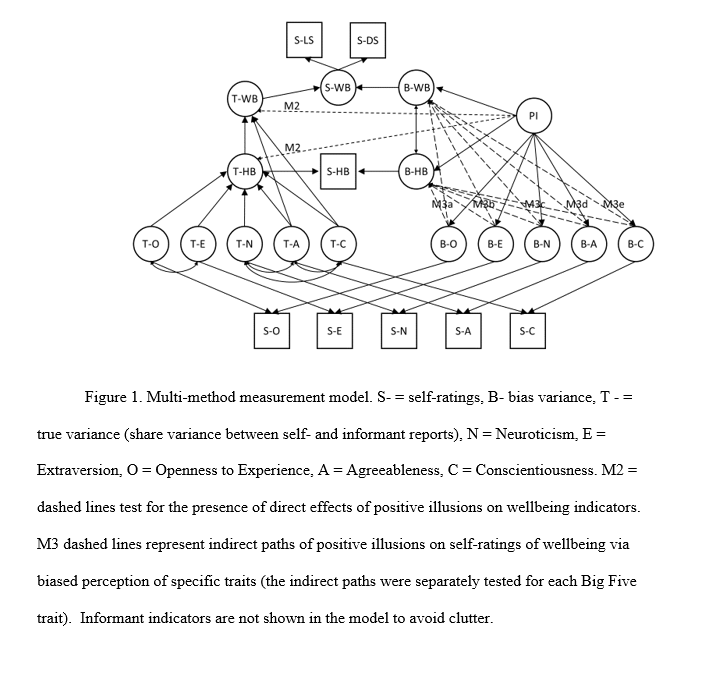
In a forthcoming JRP article, Hyunji Kim and I present the most comprehensive test of Taylor’s positive illusion hypothesis (Schimmack & Kim, 2019). We collected data from 458 triads (students with both biological parents living together). We estimated separate models for students, mothers, and fathers as targets. In each model, targets self-ratings of the Big Five personality ratings were modelled with the halo-alpha-beta model, where the halo factor represents positive illusions about the self (Anusic et al., 2009). The halo factor was then allowed to predict the shared variance in well-being ratings by all three raters, and well-being ratings were based on three indicators (global life-satisfaction, average domain satisfaction, and hedonic balance, cf. Zou, Schimmack, & Gere, 2013).
The structural equation model is shown in Figure 1. The complete data, MPLUS syntax and output files and a preprint of the article are available on OSF ( https://osf.io/6z34w/).
The key findings are reported in Table 6. There were no significant relationships between self-rated halo bias and the shared variance among ratings of well-being across the three raters. Although this finding does not prove that positive illusions are not beneficial, the results suggest that it is rather difficult to demonstrate these benefits even in reasonably powered studies to detect moderate effect sizes.
The study did replicate much stronger relationships with self-ratings of well-being. However, this finding begs the question whether positive illusions are beneficial only in ways that are not visible to close others or whether these relationships simply reflect shared method variance.
Conclusion
Over 30 years ago, Taylor and Brown made the controversial proposal that humans benefit from distorted perceptions of reality. Only this year, a meta-analysis claimed that there is strong evidence to support this claim. I argue that the evidence in support of the illusion model is itself illusory because it rests on studies that relate self-ratings to self-ratings. Given the pervasive influence of rating biases on self-ratings, shared method variance alone is sufficient to explain positive correlations in these studies (Campbell & Fiske, 1959). Only a few studies have attempted to address this problem by using informant ratings of well-being as an outcome measure. These studies tend to find weak relationships that are often not significant. Thus, there is currently no scientific evidence to support Taylor and Brown’s social psychological perspective on mental health. Rather, the literature on positive illusions provides further evidence that social and personality psychologists have been unable to subject the positive illusions hypothesis to a rigorous test. To make progress in the study of well-being it is important to move beyond the use of self-ratings to reduce the influence of method variance that can produce spurious correlations among self-report measures.
APPENDIX
Article#
Title
Study
Informants
N
SR
IR
1
Do Chinese Self-Enhance or Self-Efface?
It’s a Matter of Domain
1
Table 4
helpfulness
neuroticism
130
0.48
0.01
2
How self-enhancers adapt well to loss: the mediational role of loneliness
and social functioning
1
BIDR-SD
SR symptoms (reversed) / IR mental health
57
0.24
0.34
3
Portrait of the self- enhancer:Well- adjusted and well- liked or
maladjusted and friendless?
1
4
Social Desirability Scales: More Substance Than Style
1
Table 2
MCSD
depression (reversed)
215
0.49
0.31
5
Substance and bias in social desirability responding.
1
2 Friends
Table 2
SDE
neuroticism (reversed)
67
0.39
0.26
6
Interpersonal and intrapsychic adaptiveness of trait self-enhancement: A
mixed blessing
1a
Zero-Aquaintance
Table 2 Time 1
Trait SE
Adjustment
124
NA
0.36
6
Interpersonal and intrapsychic adaptiveness of trait self-enhancement: A
mixed blessing
1b
Zero-Aquaintance
Table 2 Time 2
Trait SE
Adjustment
124
NA
-0.11
6
Interpersonal and intrapsychic adaptiveness of trait self-enhancement: A
mixed blessing
2
Zero-Aquaintance
Table 4 Time 1
Trait SE
Adjustment
89
NA
0.35
6
Interpersonal and intrapsychic adaptiveness of trait self-enhancement: A
mixed blessing
2
Zero-Aquaintance
Table 4 Time 1
Trait SE
Adjustment
89
NA
-0.22
7
A test of the construct validity of the Five-Factor Narcissism Inventory
1
1 Peer
Table 1
FFNI Vulnerability
Neuroticism
287
0.5
0.33
8
Moderators of the adaptiveness of self-enhancement: Operationalization,
motivational domain, adjustment facet, and evaluator
1
3 Peers/Family Members
Self-Residuals
Adjustment
123
0.22
-0.2
9
Grandiose and Vulnerable Narcissism: A Nomological Network Analysis
1
NA
NA
10
Socially desirable responding in personality assessment: Still more
substance than style
1a
1 Roommate
Table 1
MCSD
neuroticism (reversed)
128
0.41
0.06
10
Socially desirable responding in personality assessment: Still more
substance than style
1b
Parents
Table 1
MCSD
neuroticism (reversed)
128
0.41
0.09
11
Two faces of human happiness: Explicit and implicit life-satisfaction
1a
1 Peer
Table 1
BIDR-SD
PANAS
159
0.45
0.17
11
Two faces of human happiness: Explicit and implicit life-satisfaction
1b
1 Peer
Table 1
BIDR-SD
LS
159
0.36
-0.03
12
Socially desirable responding in personality assessment: Not necessarily
faking and not necessarily substance
1
1 roommate
Table 2
BIDR-SD
neuroticism (reversed)
602
0.26
0.02
13
Depression and the chronic pain experience
1
none
MCSD
NA
NA
14
Trait self-enhancement as a buffer against potentially traumatic events:
A prospective study
1
Friends
Table 5
BIDR-SD
mental health
32
NA
-0.01
15
Big Tales and Cool Heads: Academic Exaggeration Is Related to Cardiac
Vagal Reactivity
1
62
NA
NA
16
Are Actual and Perceived Intellectual Self-enhancers Evaluated
Differently bySocial Perceivers?
1
1 Friend
Table 1 / above diagonal
SE intelligence
neuroticism (reversed)
337
0.17
0.15
16
Are Actual and Perceived Intellectual Self-enhancers Evaluated
Differently bySocial Perceivers?
3
Zero-Aquaintance
Table 1 / below diagonal
SE intelligence
neuroticism (reversed)
183
0.19
0.38
17
Response artifacts in the measurement of subjective well-being
1
7 friends / family
Table 1
MCSD
LS
108
0.3
0.36
18
A Four-Culture Study of Self-Enhancement and Adjustment Using the
1a
6 friends/ family
Table 6 SRM unweighted
SRM
LS
900
0.53
0.17
18
A Four-Culture Study of Self-Enhancement and Adjustment Using the
1b
6 friends/ family
Table 6 SRM weighted
SRM
LS
900
0.49
0.08
19
You Probably Think This Paper’s About You: Narcissists’ Perceptions of
Their Personality and Reputation
1
NA
NA
20
What Does the Narcissistic Personality Inventory Really Measure?
4
Roommates
NPI-Grandiose
College Adjustment
200
0.48
0.27
21
Self-enhancement as a buffer against extreme adversity: Civil war in
Bosnia and traumatic loss in the United States
1
Mental Health Experts
Self-Peer Dis
adjustment difficulties (reversed)
78
0.47
0.27
21
Self-enhancement as a buffer against extreme adversity: Civil war in
Bosnia and traumatic loss in the United States
2
Mental Health Experts
Table 2 25 months
BIDR-SD
self distress / MHE PTSD
74
0.3
0.35
22
Self-enhancement among high-exposure survivors of the September 11th
terrorist attack: Resilience or social maladjustment
1
Friend/Family
BIDR-SD
self depression 18 months / mental health
45
0.29
0.33
23
Decomposing a Sense of Superiority: The Differential Social Impact of
Self-Regard and Regard for Others
1
Zero-Aquaintance
SRM
neuroticism (reversed)
235
NA
0.02
24
Personality, Emotionality, and Risk Prediction
1
94
NA
NA
24
Personality, Emotionality, and Risk Prediction
2
119
NA
NA
25
Social desirability scales as moderator and suppressor variables
Most psychologists have at least a vague understanding of the scientific method. Somewhere they probably heard about Popper and the idea that empirical data can be used to test theories. As all theories are false, these tests should at some point lead to an empirical outcome that is inconsistent with a theory. This outcome is not a failure. It is an expected outcome of good science. It also does not mean that the theory was bad. Rather it was a temporary theory that is now modified or replaced by a better theory. And so, science makes progress….
However, psychologists do not use the scientific method popperly. Null-hypothesis significance testing adds some confusion here. After all, psychologists publish over 90% successful rejections of the nil-hypothesis. Doesn’t that show they are good Popperians? The answer is no because the nil-hypothesis is not predicted by a theory. The nil-hypothesis is only useful to reject it to claim that there is a predicted relationship between two variables. Thus, psychology journals are filled with over 90% reports of findings that confirm theoretical predictions. While this may look like a major success, it actually shows a major problems. Psychologists never publish results that disconfirm a theoretical prediction. As a result, there is never a need to develop better theories. Thus, a root evil that prevents psychology from being a real science is verificationism.
The need to provide evidence for, rather than against, a theory led to the use of questionable research practices. Questionable research practices are used to report results that confirm theoretical predictions. For example, researchers may simply not report results of studies that did not reject the nil-hypothesis. Other practices can help to produce significant results by inflating the risk of a false positive result. The use of QRPs explains why psychology journals have been publishing over 90% results that confirm theoretical predictions for 60 years (Sterling, 1959). Only recently, it has become more acceptable to report studies that failed to support a theoretical prediction and question the validity of a theory. However, these studies are still a small minority. Thus, psychological science suffers from confirmation bias.
Structural Equation Modelling
Multivariate, correlational studies are different from univariate experiments. In a univariate experiment, a result is either significant or not. Thus, only tempering with the evidence can produce confirmation bias. In multivariate statistics, data are analyzed with complex statistical tools that provide researchers with flexibility in their data analysis. Thus, it is not necessary to alter the data to produce confirmatory results. Sometimes it is sufficient to analyze the data in a way that confirm a theoretical prediction without showing that alternative models fit the data equally well or better.
It is also easier to combat confirmation bias in multivariate research by fitting alternative models to the same data. Model comparison also avoids the problem of significance testing, where non-significant results are considered inconclusive, while significant results are used to confirm and cement a theory. In SEM, statistical inferences work the other way around. A model with good fit (non-significant chi-square or acceptable fit) is a possible model that can explain the data, while a model with significant deviation from the data is rejected. The reason is that the significance test (or model fit) is used to test an actual theoretical model rather than the nil-hypothesis. This forces researchers to specify an actual set of predictions and subject them to an empirical test. Thus, SEM is ideally suited to test theories popperly.
Confirmation Bias in SEM Research
Although SEM is ideally suited to test competing theories against each other, psychology journals are not used to model comparisons and tend to publish SEM research in the same flawed confirmatory way as other research is conducted and reported. For example, an article in Psychological Science this year published an investigation of the structure of personality and the hypothesis that several personality traits are linked to a bio-marker (Wright et al., 2019).
Their preferred model assumes that the Big Five traits neuroticism, agreeableness, and conscientiousness are not independent, but systematically linked by a higher-order triat called alpha or stability (Digman, 1997; DeYoung, 2007). In their model, the stability factor is linked to a marker of the serotonin (5-HT) prolactin response. This model implies that all three traits are related to the biomarker as there are indirect paths from all three traits to the biomarker that are “mediated” by the stability factor (for technical reasons the path goes from stabilty to the biomarker, but theoretically, we would expect the relationship to go the other way from a neurological mechanism to behaviour).
Thanks to the new world of open science, the authors shared actual MPLUS outputs of their models on OSF ( https://osf.io/h5nbu/ ). All the outputs also included the covariance matrix among the predictor variables, which made it possible to fit alternative models to the data.
Alternative Models
Another source of confirmation bias in psychology is that literature reviews fail to mention evidence that contradicts the theory that authors try to confirm. This is pervasive and by no means a specific criticism of the authors. Contrary to the claims in the article, the existence of a meta-trait of stability is actually controversial. Digman (1997) reported some SEM results that were false and could not be reproduced (cf. Anusic et al., 2009). Moreover, alpha could not be identified when the Big Five were modelled as latent factors (Anusic et al., 2009). This led me to propose that meta-traits may be an artifact of using impure Big Five scales as indicators of the Big Five. For example, if some agreeableness items have negative secondary loadings on neuroticism, the agreeableness scale is contaminated with valid variance in neuroticism. Thus, we would observe a negative correlation between neuroticism and agreeableness even across raters (e.g., self-ratings of neuroticism and informant ratings of agreeableness). Here I fitted a model with secondary loadings and independent Big Five factors to the data. I also examined the prediction that the biomarker is related to all three Big Five traits. The alternative model had acceptable fit, CFI = .976, RMSEA = .056.
The main finding of this model is that the biomarker shows only a significant relationship with conscientiousness, while the relationship with agreeableness trended in the right direction, but was not significant (p = .089) and the relationship for neuroticism was even weaker (p = .474). Aside from the question about significance, we also have to take effect sizes into account. Given the parameter estimates, the bimarker would produce very small correlations among the Big Five traits (e.g., r(A,C) = .19 * .10 = .019. Thus, even if these relationships were significant, they would not provide compelling evidence that a source of shared variance among the three traits has been identified.
The next model shows that the authors’s model ignored the stronger relationship between conscientiousness and the biomarker. When this relationship is added to the model, there is no significant relationship between the stability factor and the biomarker.
Thus, the main original finding of this study was that a serotonin related bio-marker was significantly related to conscientiousness, but not significantly related to neuroticism. This finding is inconsistent with theories that link neuroticism to serotonin, and evidence that serotonin reuptake inhibitors reduce neuroticism (at least in depressed patients). However, such results are difficult to publish because a single study with a non-significant results does not provide sufficient evidence to falsify a theory. However, fitting data to a theory only leads to confirmation bias.
The good news is that the authors were able to publish the results of an impressive study and that their data are openly available and can provide credible information for meta-analytic evaluations of structural models of personality, while the results of this study alone are inconclusive and compatible with many different theories of personality.
One way to take more advantage of these data would be to share the covariance matrix of items to model personality structure with a proper measurement model of the Big Five traits and to avoid the problem of contaminated scale scores, which is the best practice for the use of structural equation models. These models provide no evidence for Digman’s meta-traits (Schimmack, 2019a, Schimmack, 2019b).
In conclusion, the main point of this post is that (a) SEM can be used to test and falsify models, (b) SEM can be used to realize that data are consistent with multiple models and that better data are needed to find the better model, (c) studies of Big Five factors require a measurement model with Big Five factors and cannot rely on messy scale scores as indicators of the Big Five, and (d) personality psychologists need better training in the use of SEM.
Personality psychology is dominated by dimensional models of personality (Funder, 2019). There is a good reason for this. Most personality characteristics vary along a continuum like height rather than being categorical like eye color. Thus, a system of personality types requires some arbitrary decisions about a cutoff point. For example, a taxonomy of body types could do a median split on height and weight to assign people to the tall-heavy or the tall-light type.
The notion that there are only three personality types is puzzling. The dominant framework in personality psychology is the Big Five model that conceptualizes personality traits as five independent continuous dimensions. If we were to create personality types by splitting each dimension at the median, it would create 32 personality types, where individuals are either above or below the median on neuroticism, extraversion, openness, agreeableness, and conscientiousness. if these five dimensions were perfectly independent of each other, we would see that individuals are equally likely to be assigned to one of the 32 types. There is no obvious way to reduce these 32 types to just 3.
Figure 1. small caps = below median, capitals = above mean
So, how did Robins et al. (1996) come to the conclusion that there are only three personality types? The data were Q-sorts. A Q-sort is similar to personality ratings on a series of attributes. The main difference is that the sorting task imposes a constraint on the scores that can be given to an individual. As a result, all individuals have the same overall mean across items. That is, nobody could be above average on all attributes. These kind of data are known as ipsative data. An alternative way to obtain ipsative data would be to subtract the overall mean of ratings from individual ratings. Although the distinction between ipsative and non-ipsative data is technically important, it has no implications for the broader understanding of Robins et al.’s work. The study could also have used ratings.
Robins et al. then performed a factor analysis. However, this factor analysis is different from a typical factor analysis that relies on correlations among items. Rather, the data matrix is transposed and the factor analysis is run on participants. With N = 300, there are three hundred variables and factor analysis is used to reduce this set of variables to a smaller set of factors, while minimizing the loss of information.
Everybody knows that the number of factors in a factor analysis is arbitrary and that a smaller number of factors implies a loss of information.
“Empirical research on personality typologies has been hampered by the lack of clear criteria for determining the number of types in a given sample. Thus, the costs and benefits of having a large number of types must be weighed against those of having relatively few types” (Robins et al., 1996).
The authors do not report Eigenvalues or other indicators of how much variance their three factor solution explained.
The three types are described in terms of the most and least descriptive items. Type 1 can be identified by high conscientiousness (“He is determined in what he does”), high extraversion (“He is energetic and full of life”), low neuroticism (reversed: “When he is under stress, he gives up and backs off”), high agreeableness (“He is open and straightforward”), and high openness (“He has a way with words”). In short, Type 1 is everybody’s dream child; a little Superman in the making.
Type 2 is characterized by high neuroticism (“He gets nervous in uncertain situations”), introversion (reversed: “He tries to be the center of attention”), low openness (reversed: he has a way with words,” but high agreeableness (“He is considerate and thoughtful of other people” ). Conscientiousness doesn’t define this type one way or the other.
Type 3 is characterized by low neuroticism (rerversed: “He is calm and relaxed; easy going”), high extraversion (“He tries to be the center of attention”), low conscientiousness (reversed: He plans things ahead; he thinks before he does something) and low agreeableness (He is stubborn”).
The main problem with this approach is that these personality profiles are not types. Take Profile 1 for example. While some participants’ profile correlated highly positively with Profile 1, some participants profile correlates highly negatively with Profile 1. What personality type are they? We might say that they are the opposite of Superman, but that would imply that we need another personality type for the Anti-Supermans. The problem doesn’t end here. As there are three profiles, each individual is identified by their correlations with all three profiles. Thus, we end up with eight different types depending on whether the correlation with the three profiles are positive or negative.
In short, profiles are not types. Thus, the claim that there are only three personality types is fundamentally flawed because the authors confused profiles with types. Even the claim that there are only 8 types would rest on the arbitrary choice of extracting only three factors. Four factors would have produced 16 types and five factors would have produced 32 types, just as the Big Five model predicted.
Asendorph et al. (2001) also found three profiles that they considered to be similar to those found by Robins et al. (1996). Moreover, they examined profiles in a sample of adult with a Big Five questionnaire (i.e., the NEO-FFI). Importantly, Asendorpf et al. (2001) use better terminology and refer to profiles as prototypes rather than types.
The notion of a prototype is that there are no clear defining features that determine class membership. For example, on average mammals are heavier than birds. So we can distinguish birds and mammals by their prototypical weight (how close their weight is to the average weight of a bird or mammal) rather than on the basis of a defining feature (lays eggs, has a uterus). Figure 2 shows the prototypical Big Five profile for the three groups of participants, when participants were assigned to three groups.
The problem is once more that the grouping into three groups is arbitrary. Clearly there are individuals with high scores on agreeableness and on openness, but this variation in personality was not used to create the three groups. Based on this figure, groupings are based on low N and high C, high N and low E, and low C. It is not clear what we should do with individuals who do not match any of these prototypical profiles. What type are individuals who are high in N and high in C?
In sum, a closer inspection of studies of personality types suggests that these studies failed to address the question. Searching for prototypical item-profiles is not the same thing as searching for personality types. In addition, the question may not be a good question. If personality attributes vary mostly quantitatively and if the number of personality traits is large, the number of personality types is infinite. Every individual is unique.
Are Some Personality Types More Common Than Others?
As noted above, the number of personality types that are theoretically possible is determined by the number of attributes and the levels of each attribute. If we describe personality with the Big Five and limit the levels to being above or below the median, we have 32 theoretical patterns. However, this does not mean that we actually observe all patterns. Maybe some types never occur or are at least rare. The absence of some personality types could provide some interesting insights into the structure of personality. For example, high conscientiousness might suppress neuroticism and we would see very few individuals who are high in C and low in N (Digman, 1997). However, when C is low, we could see equal numbers of individuals with high N and low N because conscientiousness only inhibits high N, while low conscientiousness does not lead to high N. It is impossible to examine such patterns with bivariate correlations (Feger, 1988).
A simple way to examine this question is to count the frequencies of personality traits (Anusic & Schimmack, unpublished manuscript that was killed in peer-review). Here, I present the results of this analysis based on Sam Gosling’s large internet survey with millions of visitors who completed the BFI (John, Naumann, & Soto, 2008).
Figure 3 simply shows the relative frequencies of the 32 personality types.
Figure 4 shows the results only for US residents. The results are very similar to those for the total sample.
The most notable finding is that the types nEOAC and Neoac are more frequent than all other types. These types are evaluatively positive or negative. However, it is important to realize that these types are not real personality types. Other research has demonstrated that the evaluative dimension in self-ratings of personality is mostly a rating or a perception bias (Anusic et al., 2009). Thus, individuals with a nEOAC profile do not have a better personality. Whether they simply rate themselves (other-deception) or actually see themselves (self-deception) as better than they are is currently unknown.
The next two types with above average frequency are nEoAC and NeOac. A simple explanation for this pattern is that openness is not highly evaluative and so some people will not inflate their openness scores, while they are still responding in a desirable way on the other four traits.
The third complementary pair are the neoAC and the NEOac types. This pattern can also be explained with rating biases because some people do not consider openness and extraversion desirable; so they will only show bias on neuroticism, agreeableness and conscientiousness. These people were called “Saints” by Paulhus and John (1998).
In short, one plausible explanation of the results is that all 32 personality types that can be created by combining high and low scores on the Big Five exists. Some types are more frequent than others, but at least some of this variation is explained by rating biases rather than by actual differences in personality.
Conclusion
The main contribution of this new look at personality types is to clarify some confusion about the notion of personality types. Previous researchers used the term types for prototypical personality profiles. This is unfortunate because it led to the misleading impression that there are only three personality types. You are either resilient, over-controlled, or under-controlled. In fact, even three profiles create more than three types. Moreover, the profiles are based on exploratory factor analyses of personality ratings and it is not clear why there are only three profiles. Big Five theory would predict five profiles where each profile is defined by items belonging to one of the Big Five factors. It is not clear why profile analyses yielded only three factors. One explanation could be that the item set did not capture some personality dimensions. For example, Robins et al.’s (1996) Q-sort did not seem to include many openness items.
Based on Big Five theory, one would expect 32 personality types that are about equally frequent. An analysis of a large data set showed that all 32 types exists, which is consistent with the idea that the Big Five are fairly independent dimensions that can occur in any combination. However, some types were more frequent than others. The most frequent combination was either desirable (nEOAC) or undesirable (Neoac). This finding is consistent with previous evidence that personality ratings are influenced by a general evaluative bias (Anusic et al., 2009). Additional types with higher frequencies can be attributed to variations in desirability. Openness and extraversion are not as desirable, on average, as low neuroticism and high agreeableness and conscientiousness. Thus, the patterns nEoAC and neoAC may also reflect desirability rather than actual personality structure. Multi-method studies or low evaluative items would be needed to examine this question.
Implications
Personality psychologists are frustrated that they have discovered the Big Five factors and created a scientific model of personality, but in applied settings the Myers-Briggs Type Indicator (MBTI) dominates personality assessment (Funder, 2019).
One possible reason is that the MBTI provides simple information about personality by classifying individuals into 16 types. These 16 types are defined by being high or low on four dimensions.
There is no reason, why personality psychologists could not provide simplified feedback about personality using a median split on the Big Five and assigning individuals to the 32 types that can be created by the Big Five factors. For example, I would be the NEOac type. Instead of using small caps and capitals, one could also use letters for both poles of the dimension, neurotic (N) vs. stable (S), extraverted (E) vs. introverted (I), variable (V) versus regular (R), agreeable (A) vs. dominant (D), and conscientious (C) vs. laid back (L). This would make me an NEVDL type. My son would be an SIRAC.
I see no reason why individuals would prefer Myer-Briggs types over Big Five types, given that the Big Five types are based on a well-established scientific theory. I believe the main problem in giving individuals feedback with Big Five scores is that many people do not think in terms of dimensions.
The main problem might be that we are assigning individuals to types even when their scores are close to the median and their classification is arbitrary. For example, I am not very high on E or low on C and it is not clear whether I am really an NEVDL or an NIVDC type. One possibility would be to use only scores that are one standard deviation above or below then mean or median. This would make me an N-VD- type.
To conclude, research on personality types has not made much progress for a good reason. The number of personality types depends on the number of attributes that are being considered and it is no longer an empirical question which types exists. With fairly independent dimensions all types exist and the number of types increases exponentially with the number of attributes. The Big Five are widely considered the optimal trade-off between accuracy and complexity. Thus, they provide an appealing basis for the creation of personality type and a viable alternative to the Myer-Briggs Type Indicator.
If you want to know what type you are, you can take the BFI online ( https://www.outofservice.com/bigfive/ ). It provides feedback about your personality in terms of percentiles. To create your personality type, you only have to convert the percentiles into letters.
Negative Emotionality P < 50 = S P > 50 = N Extraversion P < 50 = I P > 50 = E Open-Mindedness P < 50 = R P > 50 = V Agreeableness P < 50 = D P > 50 = A Conscientiousness P < 50 = L P > 50 = C
However, keep in mind that your ratings and those of the comparison group are influenced by desirability.
If you are a NIRDL, you may have a bias to rate yourself as less desirable than you actually are
If you are an SEVAC, you may have a tendency to overrate your desirability.
Galileo had the clever idea to turn a microscope into a telescope and to point it towards the night sky. His first discovery was that Jupiter had four massive moons that are now known as the Galilean moons (Space.com).
Now imagine what would have happened if Galileo had an a priori theory that Jupiter has five moons and after looking through the telescope, Galileo decided that the telescope was faulty because he could see only four moons. Surely, there must be five moons and if the telescope doesn’t show them, it is a problem of the telescope. Astronomers made progress because they created credible methods and let empirical data drive their theories. Eventually even better telescopes discovered many more, smaller moons orbiting around Jupiter. This is scientific progress.
Alas, psychologists don’t follow the footsteps of natural sciences. They mainly use the scientific method to provide evidence that confirms their theories and dismiss or hide evidence that disconfirms their theories. They also show little appreciation for methodological improvements and often use methods that are outdated. As a result, psychology has made little progress in developing theories that rest of solid empirical foundations.
An example of this ill-fated approach to science is McCrae et al.’s (1996) attempt to confirm their five factor model with structural equation modeling (SEM). When they failed to find a fitting model, they decided that SEM is not an appropriate method to study personality traits because SEM didn’t confirm their theory. One might think that other personality psychologists realized this mistake. However, other personality psychologists were also motivated to find evidence for the Big Five. Personality psychologists had just recovered from an attack by social psychologists that personality traits does not even exist, and they were all too happy to rally around the Big Five as a unifying foundation for personality research. Early warnings were ignored (Block, 1995). As a result, the Big Five have become the dominant model of personality without subjecting the theory to rigorous tests and even dismissing evidence that theoretical models do not fit the data (McCrae et al., 1996). It is time to correct this and to subject Big Five theory to a proper empirical test by means of a method that can falsify bad models.
I have demonstrated that it is possible to recover five personality factors, and two method factors, from Big Five questionnaires (Schimmack, 2019a, 2019b, 2019c). These analyses were limited by the fact that the questionnaires were designed to measure the Big Five factors. A real test of Big Five theory requires to demonstrate that the Big Five factors explain the covariations among a large set of a personality traits. This is what McCrae et al. (1996) tried and failed to do. Here I replicate their attempt to fit a structural equation model to the 30 personality traits (facets) in Costa and McCrae’s NEO-PI-R.
In a previous analysis I was able to fit an SEM model to the 30 facet-scales of the NEO-PI-R (Schimmack, 2019d). The results only partially supported the Big Five model. However, these results are inconclusive because facet-scales are only imperfect indicators of the 30 personality traits that the facets are intended to measure. A more appropriate way to test Big Five theory is to fit a hierarchical model to the data. The first level of the hierarchy uses items as indicators of 30 facet factors. The second level in the hierarchy tries to explain the correlations among the 30 facets with the Big Five. Only structural equation modeling is able to test hierarchical measurement models. Thus, the present analyses provide the first rigorous test of the five-factor model that underlies the use of the NEO-PI-R for personality assessment.
The complete results and the MPLUS syntax can be found on OSF (https://osf.io/23k8v/). The NEO-PI-R data are from Lew Goldberg’s Eugene-Springfield community sample. Theyu are publicly available at the Harvard Dataverse.
Results
Items
The NEO-PI-R has 240 items. There are two reasons why I analyzed only a subset of items. First, 240 variables produce 28,680 covariances, which is too much for a latent variable model, especially with a modest sample size of 800 participants. Second, a reflective measurement model requires that all items measure the same construct. However, it is often not possible to fit a reflective measurement model to the eight items of a NEO-facet. Thus, I selected three core-items that captured the content of a facet and that were moderately positively correlated with each other after reversing reverse-scored items. Thus, the results are based on 3 * 30 = 90 items. It has to be noted that the item-selection process was data-driven and needs to be cross-validated in a different dataset. I also provide information about the psychometric properties of the excluded items in an Appendix.
The first model did not impose a structural model on the correlations among the thirty facets. In this model, all facets were allowed to correlate freely with each other. A model with only primary factor loadings had poor fit to the data. This is not surprising because it is virtually impossible to create pure items that reflect only one trait. Thus, I added secondary loadings to the model until acceptable model fit was achieved and modification indices suggested no further secondary loadings greater than .10. This model had acceptable fit, considering the use of single-items as indicators, CFI = .924, RMSEA = .025, .035. Further improvement of fit could only be achieved by adding secondary loadings below .10, which have no practical significance. Model fit of this baseline model was used to evaluate the fit of a model with the Big Five factors as second-order factors.
To build the actual model, I started with a model with five content factors and two method factors. Item loadings on the evaluative bias factor were constrained to 1. Item loadings for on the acquiescence factor were constrained to 1 or -1 depending on the scoring of the item. This model had poor fit. I then added secondary loadings. Finally, I allowed for some correlations among residual variances of facet factors. Finally, I freed some loadings on the evaluative bias factor to allow for variation in desirability across items. This way, I was able to obtain a model with acceptable model fit, CFI = .926, RMSEA = .024, SRMR = .045. This model should not be interpreted as the best or final model of personality structure. Given the exploratory nature of the model, it merely serves as a baseline model for future studies of personality structure with SEM. That being said, it is also important to take effect sizes into account. Parameters with substantial loadings are likely to replicate well, especially in replication studies with similar populations.
Item Loadings
Table 1 shows the item-loadings for the six neuroticism facets. All primary loadings exceed .4, indicating that the three indicators of a facet measure a common construct. Loadings on the evaluative bias factors were surprisingly small and smaller than in other studies (Anusic et al., 2009; Schimmack, 2009a). It is not clear whether this is a property of the items or unique to this dataset. Consistent with other studies, the influence of acquiescence bias was weak (Rorer, 1965). Secondary loadings also tended to be small and showed no consistent pattern. These results show that the model identified the intended neuroticism facet-factors.
Table 2 shows the results for the six extraversion facets. All primary factor loadings exceed .40 and most are more substantial. Loadings on the evaluative bias factor tend to be below .20 for most items. Only a few items have secondary loadings greater than .2. Overall, this shows that the six extraversion facets are clearly identified in the measurement model.
Table 3 shows the results for Openness. Primary loadings are all above .4 and the six openness factors are clearly identified.
Table 4 shows the results for the agreeableness facets. In general, the results also show that the six factors represent the agreeableness facets. The exception is the Altruism facet, where only two items show a substantial loadings. Other items also had low loadings on this factor (see Appendix). This raises some concerns about the validity of this factor. However, the high-loading items suggest that the factor represents variation in selfishness versus selflessness.
Table 5 shows the results for the conscientiousness facets. With one exception, all items have primary loadings greater than .4. The problematic item is the item “produce and common sense” (#5) of the competence facet. However, none of the remaining five items were suitable (Appendix).
In conclusion, for most of the 30 facets it was possible to build a measurement model with three indicators. To achieve fit, the model included 76 out of 2,610 (3%) secondary loadings. Many of these secondary loadings were between .1 and .2, indicating that they have no substantial influence on the correlations of factors with each other.
Facet Loadings on Big Five Factors
Table 6 shows the loadings of the 30 facets on the Big Five factors. Broadly speaking the results provide support for the Big Five factors. 24 of the 30 facets (80%) have a loading greater than .4 on the predicted Big Five factor, and 22 of the 30 facets (73%) have the highest loading on the predicted Big Five factor. Many of the secondary loadings are small (< .3). Moreover, secondary loadings are not inconsistent with Big Five theory as facet factors can be related to more than one Big Five factor. For example, assertiveness has been related to extraversion and (low) agreeableness. However, some findings are inconsistent with McCrae et al.’s (1996) Five factor model. Some facets do not have the highest loading on the intended factor. Anger-hostility is more strongly related to low agreeableness than to neuroticism (-.50 vs. .42). Assertiveness is also more strongly related to low agreeableness than to extraversion (-.50 vs. .43). Activity is nearly equally related to extraversion and low agreeableness (-.43). Fantasy is more strongly related to low conscientiousness than to openness (-.58 vs. .40). Openness to feelings is more strongly related to neuroticism (.38) and extraversion (.54) than to openness (.23). Finally, trust is more strongly related to extraversion (.34) than to agreeableness (.28). Another problem is that some of the primary loadings are weak. The biggest problem is that excitement seeking is independent of extraversion (-.01). However, even the loadings for impulsivity (.30), vulnerability (.35), openness to feelings (.23), openness to actions (.31), and trust (.28) are low and imply that most of the variance in this facet-factors is not explained by the primary Big Five factor.
The present results have important implications for theories of the Big Five, which differ in the interpretation of the Big Five factors. For example, there is some debate about the nature of extraversion. To make progress in this research area it is necessary to have a clear and replicable pattern of factor loadings. Given the present results, extraversion seems to be strongly related to experiences of positive emotions (cheerfulness), while the relationship with goal-driven or reward-driven behavior (action, assertiveness, excitement seeking) is weaker. This would suggest that extraversion is tight to individual differences in positive affect or energetic arousal (Watson et al., 1988). As factor loadings can be biased by measurement error, much more research with proper measurement models is needed to advance personality theory. The main contribution of this work is to show that it is possible to use SEM for this purpose.
The last column in Table 6 shows the amount of residual (unexplained) variance in the 30 facets. The average residual variance is 58%. This finding shows that the Big Five are an abstract level of describing personality, but many important differences between individuals are not captured by the Big Five. For example, measurement of the Big Five captures very little of the personality differences in Excitement Seeking or Impulsivity. Personality psychologists should therefore reconsider how they measure personality with few items. Rather than measuring only five dimensions with high reliability, it may be more important to cover a broad range of personality traits at the expense of reliability. This approach is especially recommended for studies with large samples where reliability is less of an issue.
Residual Facet Correlations
Traditional factor analysis can produce misleading results because the model does not allow for correlated residuals. When such residual correlations are present, they will distort the pattern of factor loadings; that is, two facets with a residual correlation will show higher factor loadings. The factor loadings in Table 6 do not have this problem because the model allowed for residual correlations. However, allowing for residual correlations can also be a problem because freeing different parameters can also affect the factor loadings. It is therefore crucial to examine the nature of residual correlations and to explore the robustness of factor loadings across different models. The present results are based on a model that appeared to be the best model in my explorations. These results should not be treated as a final answer to a difficult problem. Rather, they should encourage further exploration with the same and other datasets.
Table 7 shows the residual correlation. First appear the correlations among facets assigned to the same Big Five factor. These correlations have the strongest influence on the factor loading pattern. For example, there is a strong correlation between the warmth and gregariousness facets. Removing this correlation would increase the loadings of these two facets on the extraversion factor. In the present model, this would also produce lower fit, but in other models this might not be the case. Thus, it is unclear how central these two facets are to extraversion. The same is also true for anxiety and self-consciousness. However, here removing the residual correlation would further increase the loading of anxiety, which is already the highest loading facet. This justifies the use of anxiety as the most commonly used indicator of neuroticism.
Table 7. Residual Factor Correlations
It is also interesting to explore the substantive implications of these residual correlations. For example, warmth and gregariousness are both negatively related to self-consciousness. This suggests another factor that influences behavior in social situations (shyness/social anxiety). Thus, social anxiety would be not just high neuroticism and low extraversion, but a distinct trait that cannot be reduced to the Big Five.
Other relationships are make sense. Modesty is negatively related to competence beliefs; excitement seeking is negatively related to compliance, and positive emotions is positively related to openness to feelings (on top of the relationship between extraversion and openness to feelings).
Future research needs to replicate these relationships, but this is only possible with latent variable models. In comparison, network models rely on item levels and confound measurement error with substantial correlations, whereas exploratory factor analysis does not allow for correlated residuals (Schimmack & Grere, 2010).
Conclusion
Personality psychology has a proud tradition of psychometric research. The invention and application of exploratory factor analysis led to the discovery of the Big Five. However, since the 1990s, research on the structure of personality has been stagnating. Several attempts to use SEM (confirmatory factor analysis) in the 1990s failed and led to the impression that SEM is not a suitable method for personality psychologists. Even worse, some researchers even concluded that the Big Five do not exist and that factor analysis of personality items is fundamentally flawed (Borsboom, 2006). As a result, personality psychologists receive no systematic training in the most suitable statistical tool for the analysis of personality and for the testing of measurement models. At present, personality psychologists are like astronomers who have telescopes, but don’t point them to the stars. Imagine what discoveries can be made by those who dare to point SEM at personality data. I hope this post encourages young researchers to try. They have the advantage of unbelievable computational power, free software (lavaan), and open data. As they say, better late than never.
Appendix
Running the model with additional items is time consuming even on my powerful computer. I will add these results when they are ready.
Any mature science classifies the objects that it studies. Chemists classify atoms. Biologists classify organisms. It is therefore not surprising that personalty psychologists have spent a lot of their effort on classifying personality traits; that is psychological attributes that distinguish individuals from each other.
[It is more surprising that social psychologists have spent very little effort on classifying situations; a task that is now being carried out by personality psychologists (Rauthmann et al., 2014)]
After decades of analyzing correlations among self-ratings of personality items, personality psychologists came to a consensus that five broad factors can be reliably identified. Since the 1980s, the so-called Big Five have dominated theories and measurement of personality. However, most theories of personality also recognize that the Big Five are not a comprehensive description of personality. That is, unlike colors that can be produced by mixing three basic colors, specific personality traits are not just a mixture of the Big Five. Rather, the Big Five represent an abstract level in a hierarchy of personality traits. It is possible to compare the Big Five to the distinction of five classes of vertebrate animals: mammals, birds, reptiles, fish, and amphibians. Although there are important distinctions between these groups, there are also important distinctions among the animals within each class; cats are not dogs.
Although the Big Five are a major achievement in personality psychology, it also has some drawbacks. As early as 1995, personality psychologists warned that focusing on the Big Five would be a mistake because the Big Five are too broad to be good predictors of important life outcomes (Block, 1995). However, this criticism has been ignored and many researchers seem to assume that they measure personality when they administer a Big Five questionnaire. To warrant the reliance on the Big Five would require that the Big Five capture most of the meaningful variation in personality. In this blog post, I use open data to test this implicit assumption that is prevalent in contemporary personality science.
Confirmatory Factor Analysis
In 1996, McCrae et al. (1995) published an article that may have contributed to the stagnation in research on the structure of personality. In this article, the authors argued that structural equation modeling (SEM), specifically confirmatory factor analysis (CFA), is not suitable for personality researchers. However, CFA is the only method that can be used to test structural theories and to falsify structural theories that are wrong. Even worse, McCrae et al. (1995) demonstrated that a simple-structure model did not fit their data. However, rather than concluding that personality structure is not simple, they concluded that CFA is the wrong method to study personality traits. The problem with this line of reasoning is self-evident and was harshly criticized by Borsboom (2006). If we dismiss methods because they do not show a theoretically predicted pattern, we loose the ability to test theories empirically.
To understand McCrae et al.’s (1995) reaction to CFA, it is necessary to understand the development of CFA and how it was used in psychology. In theory, CFA is a very flexible method that can fit any dataset. The main empirical challenge is to find plausible models and to find data that can distinguish between competing plausible models. However, when CFA was introduced, certain restrictions were imposed on models that could be tested. The most restrictive model imposed that a measurement model should have only primary loadings and no correlated residuals. Imposing these restrictions led to the foregone conclusions that the data are inconsistent with the model. At this point, researchers were supposed to give up, create a new questionnaire with better items, retest it with CFA and find out that there were still secondary loadings that produced poor fit to the data. The idea that actual data could have a perfect structure must have been invented by an anal-retentive statistician who never analyzed real data. Thus, CFA was doomed to be useless because it could only show that data do not fit a model.
It took some time and courage to decide that the straight-jacket of simple structure has to go. Rather than giving up after a simple-structure model was rejected, the finding should encourage further exploration of the data to find models that actually fit the data. Maybe biologists initially classified whales as fish, but so what. Over time, further testing suggested that they are mammals. However, if we never get started in the first place, we will never be able to develop a structure of personality traits. So, here I present a reflective measurement model of personality traits. I don’t call it CFA, because I am not confirming anything. I also don’t call it EFA because this term is used for a different statistical technique that imposes other restrictions (e.g., no correlated residuals, local independence). We might call it exploratory modeling (EM) or because it relies on structural equation modeling, we could call it ESEM. However, ESEM is already been used for a blind computer-based version of CFA. Thus, the term EM seems appropriate.
The Big Five and the 30 Facets
Costa and McCrae developed a personality questionnaire that assesses personality at two levels. One level are the Big Five. The other level are 30 more specific personality traits.
The 30 facets are often presented as if they are members of a domain, just like dogs, cats, pigs, horses, elephants, and tigers are mammals and have nothing to do with reptiles or bird. However, this is an oversimplification. Actual empirical data show that personality structure is more complex and that specific facets can be related to more than one Big Five factor. In fact, McCrae et al. (1996) published the correlations of the 30 facets with the Big Five factors and the table shows many, and a few substantial, secondary loadings; that is, correlations with a factor other than the main domain. For example, Impulsive is not just positively related to Neuroticism. It is also positively related to extraversion, and negatively related to conscientiousness.
Thus, McCrae et al.’s (1996) results show that Big Five data do not have a simple structure. It is therefore not clear what model a CONFIRMATORY factor analysis tries to confirm, when the CFA model imposes a simple structure. McCrae et al. (1995) agree: “If, however, small loadings are in fact meaningful, CFA with a simple structure model may not fit well” (p. 553). In other words, if an exploratory factor analysis shows a secondary loading of Anger/Hostility on Agreeableness (r = -.40), indicating that agreeable people are less likely to get angry, it makes no sense to confirm a model that sets this parameter to zero. McCrae et al. also point out that simple structure makes no theoretical sense for personality traits. “There is no theoretical reason why traits should not have meaningful loadings on three, four, or five factors:” (p. 553). The logical consequence of this insight is to fit models that allow for meaningful secondary loadings; not to dismiss modeling personality data with structural equations.
However, McCrae et al. (1996) were wrong about the correct way of modeling secondary loadings. “It is possible to make allowances for secondary loadings in CFA by fixing the loadings at a priori values other than zero” (p. 553). Of course, it is possible to fix loadings to a non-zero value, but even for primary loadings, the actual magnitude of a loading is estimated by the data. It is not clear why this approach could not be used for secondary loadings. It is only impossible to let all secondary loadings to be freely estimated, but there is no need to fix the loading of anger/hostilty on the agreeableness factor to a fixed value to model the structure of personality.
Personality psychologists in the 1990s also seemed to not fully understand how sensitive SEM is to deviations between model parameters and actual data. McCrae et al. (1996) critically discuss a model by Church and Burke (1994) because it “regarded loadings as small as ± .20 as salient secondaries” (p. 553). However, fixing a loading of .20 to a value of 0, introduces a large discrepancy that will hurt overall fit. One either has to free parameters or lower the criterion for acceptable fit. However, fixing loadings greater than .10 to zero and hoping to met standard criteria of acceptable fit is impossible. Effect sizes of r = .2 (d = .4) are not zero, and treating them as such will hurt model fit.
In short, exploratory studies of the relationship between the Big Five and facets show a complex pattern with many non-trivial (r > .1) secondary loadings. Any attempt to model these data with SEM needs to be able to account for this finding. As many of these secondary loadings are theoretically expected and replicable, allowing for these secondary loadings makes theoretical sense and cannot be dismissed as overfitting of data. Rather, imposing a simple structure that makes no theoretical sense should be considered underfiting of the data, which of course results in bad fit.
Correlated Residuals are not Correlated Errors
Another confusion in the use of structural equation modeling is the interpretation of residual variances. In the present context, residuals represent the variance in a facet scale that is not explained by the Big Five factors. Residuals are interesting for two reasons. First, they provide information about unique aspects of personality that are not explained by the Big Five. To use the analogy of animals, although cats and dogs are both animals, they also have distinct features. Residuals are analogous to these distinct features, and we would think that personality psychologists would be very interested in exploring this question. However, statistics textbooks tend to present residual variances as error variance in the context of measurement models where items are artifacts that were created to measure a specific construct. As the only purpose of the item is to measure a construct, any variance that does not reflect the intended construct is error variance. If we were only interested in measuring the Big Five, we would think about residual facet-variance as error variance. It does not matter how depressed people are. We only care about their neuroticism. However, the notion of a hierarchy implies that we do care about the valid variance in facets that is not explained by the Big Five. Thus, residual variance is not error variance.
The mistake of treating residual variance as error variance becomes especially problematic when residual variance in one facet is related to residual variance in another facet. For example, how angry people get (the residual variance in anger) could be related to how compliant people are (the residual variance in compliance). After all, anger could be elicit by a request to comply to some silly norms (e.g., no secondary loadings) that make no sense. There is no theoretical reason, why facets could only be linked by means of the Big Five. In fact, a group of researchers has attempted to explain all relations among personality facet without the Big Five because they don’t belief in broader factors (cf. Schimmack, 2019b). However, this approach has difficulties explaining the constistent primary loadings of facets on their predicted Big Five factor.
The confusion of residuals with errors accounts at least partially for McCrae et al.’s (1996) failure to fit a measurement model to the correlations among the 30 facets.
“It would be possible to specify a correlated error term between these two scales, but the interpretation of such a term is unclear. Correlated error usually refers to a nonsubstantive source of variance. If Activity and Achievement Striving were, say, observer ratings, whereas all other variables were self-reports, it would make sense to control for this difference in method by introducing a correlated error term. But there are no obvious sources of correlated error among the NEO-PI-R facet scales in the present study” (p. 555).
The Big Five Are Independent Factors, but Evaluative Bias produces correlations among Big Five Scales
Another decision researchers have to make is whether they specify models with independent factors or whether they allow factors to be correlated. That is, are extraversion and openness independent factors or are extraversion and openness correlated. A model with correlated Big Five factors has 10 additional free parameters to fit the data. Thus, the model will is likely to fit better than a model with independent factors. However, the Big Five were discovered using a method that imposed independence (EFA and Varimax rotation). Thus, allowing for correlations among the factors seems atheoretical, unless an explanation for these correlations can be found. On this front, personality researchers have made some progress by using multi-method data (self-ratings and ratings by informants). As it turns out, correlations among the Big Five are only found in ratings by a single rater, but not in correlations across raters (e.g., self-rated Extraversion and informant-rated Agreeableness). Additional research has further validated that most of this variance reflects response styles in ratings by a single rater. These biases can be modeled with two method factors. One factor is an acquiescence factor that leads to higher or lower ratings independent of item content. The other factor is an evaluative bias (halo) factor. It represent responses to the desirability of items. I have demonstrated in several datasets that it is possible to model the Big Five as independent factors and that correlations among Big Five Scales are mostly due to the contamination of scale scores with evaluative bias. As a result, neuroticism scales tend to be negatively related to the other scales because neuroticism is undesirable and the other traits are desirable (see Schimmack, 2019a). Although the presence of evaluative biases in personality ratings has been known for decades, previous attempts at modeling Big Five data with SEM often failed to specify method factors; not surprisingly they failed to find good fit (McCrae et al., 1996. In contrast, models with method factors can have good fit (Schimmack, 2019a).
Other Problems in McCrae et al.’s Attempt
There are other problems with McCrae et al.’s (1996) conclusion that CFA cannot be used to test personality structure. First, the sample size was small for a rigorous study of personality structure with 30 observed variables (N = 229). Second, the evaluation of model fit was still evolving and some of the fit indices that they reported would be considered acceptable fit today. Most importantly, an exploratory Maximum Likelihood model produced reasonable fit, chi2/df = 1.57, RMS = .04, TLI = .92, CFI = .92. Their best fitting CFA model, however, did not fit the data. This merely shows a lack of effort and not the inability of fitting a CFA model to the 30 facets. In fact, McCrae et al. (1996) note “a long list of problems with the technique [SEM], ranging from technical difficulties in estimation of some models to the cost in time and effort involved.” However, no science has made progress by choosing cheap and quick methods over costly and time-consuming methods simply because researchers lack the patients to learn a more complex method. I have been working on developing measurement models of personality for over a decade (Anusic et al., 2009). I am happy to demonstrate that it is possible to fit an SEM model to the Big Five data, to separate content variance from method variance, and to examine how big the Big Five factors really are.
The Data
One new development in psychology is that data are becoming more accessible and are openly shared. Low Goldberg has collected an amazing dataset of personality data with a sample from Oregon (the Eugene-Springfield community sample). The data are now publicly available at the Harvard Dataverse. With N = 857 participants the dataset is nearly four times larger than the dataset used by McCrae et al. (1996), and the ratio 857 observations and 30 variables (28:1) is considered good for structural equation modeling.
It is often advised to use different samples for exploration and then for cross-validation. However, I used the full sample for a mix of confirmation and exploration. The reason is that there is little doubt about the robustness of the data structure (the covariance/correlation matrix). The bigger issue is that a well-fitting model does not mean that it is the right model. Alternative models could also account for the same pattern of correlations. Cross-validation does not help with this bigger problem. The only way to address this is a systematic program of research that develops and tests different models. I see the present model as the beginning of such a line of research. Other researchers can use the same data to fit alternative models and they can use new data to test model assumptions. The goal is merely to boot a new era of research on the structure of personality with structural equation modeling, which could have started 20 years ago, if McCrae et al. (1996) had been more positive about the benefits of testing models and being able to falsify them (a.k.a. doing science).
Results
I started with a simple model that had five independent personality factors (the Big Five) and an evaluative bias factor. I did not include an acquiescence factor because facets are measured with scales that include reverse scored items. As a result, acquiescence bias is negligible (Schimmack, 2019a).
In the initial model facet loadings on the evaluative bias factor were fixed at 1 or -1 depending on the direction or desirability of a facet. This model had poor fit. I then modified the model by adding secondary loadings and by freeing loadings on the evaluative bias factor to allow for variation in desirability of facets. For example, although agreeableness is desirable, the loading for the modesty facet actually turned out to be negative. I finally added some correlated residuals to the model. The model was modified until it reached criteria of acceptable fit, CFI = .951, RMSEA = .044, SRMR = .034. The syntax and the complete results can be found on OSF (https://osf.io/23k8v/).
Table 3 shows the standardized loadings of the 30 facets on the Big Five and the two method factors.
There are several notable findings that challenge prevalent conceptions of personality.
The Big Five are not so big
First, the loadings of facets on the Big Five factors are notably weaker than in McCrae et al.’s Table 4 reproduced above (Table 2). There are two reasons for this discrepancy. First, often evaluative bias is shared between facets that belong to the same factor. For example, anxiety and depression have strong negative loadings on the evaluative bias factor. This shared bias will push up the correlation between the two facets and inflate factor loadings in a model without an evaluative bias factor. Another reason can be correlated residuals. If this extra shared variance is not modeled it pushes up loadings of these facets on the shared factor. The new and more accurate estimates in Table 3 suggest that the Big Five are not as big as the name implies. The loading of anxiety on neuroticism (r = .49) implies that only 25% of the variance in anxiety is captured by the neuroticism factor. Loadings greater than .71 are needed for a Big Five factor to explain more than 50% of the variance in a facet. There are only two facets where the majority of the variance in a facet is explained by a Big Five factor (order, self-discipline).
Secondary loadings can explain additional variance in some facets. For example, for anger/hostility neuroticism explains .48^2 = 23% of the variance and agreeableness explains another -.43^2 = 18% of the variance for a total of 23+18 = 41% explained variance. However, even with secondary loadings many facets have substantial residual variance. This is of course predicted by a hierarchical model of personality traits with more specific factors underneath the global Big Five traits. However, it also implies that Big Five measures fail to capture substantial personality variance. It is therefore not surprising that facet measures often predict additional variance in outcomes that it is not predicted by the Big Five (e.g., Schimmack, Oishi, Furr, & Funder, 2004). Personality researchers need to use facet level or other more specific measures of personality in addition to Big Five measures to capture all of the personality variance in outcomes.
What are the Big Five?
Factor loadings are often used to explore the constructs underlying factors. The terms neuroticism, extraversion, or openness are mere labels for the shared variance among facets with primary loadings on a factor. There has been some discussion about the Big Five factors and there meaning is still far from clear. For example, there has been a debate about the extraversion factor. Lucas, Diener, Grob, Suh, and Shao (2000) argued that extraversion is the disposition to respond strongly to rewards. Ashton, Lee, and Paunonen disagreed and argued that social attention underlies extraversion. Empirically it would be easy to answer these questions if one facet would show a very high loading on a Big Five factor. The more loadings approach one, the more a factor corresponds to a facet or is highly related to a facet. However, the loading pattern does not suggest that a single facet captures the meaning of a Big Five factor. The strongest relationship is found for self-discipline and conscientiousness. Thus, good self-regulation may be the core aspect of conscientiousness that also influences achievement striving or orderliness. However, more generally the results suggest that the nature of the Big Five factors is not obvious. It requires more work to uncover the glue that ties facets belonging to a single factor together. Theories range from linguistic structures to shared neurotransmitters.
Evaluative Bias
The results for evaluative bias are novel because previous studies failed to model evaluative bias in responses to the NEO-PI-R. It would be interesting to validate the variation in loadings on the evaluative bias factor with ratings of item- or facet-desirability. However, intuitively the variation makes sense. It is more desirable to be competent (C1, r = .66) and not depressed (N3, r = -69) than to be an excitement seeker (E5: r = .03) or compliant (A4: r = .09). The negative loading for modesty also makes sense and validates self-ratings of modesty (A5,r = -.33). Modest individuals are not supposed to exaggerate their desirable attributes and apparently they refrain from doing so also when they complete the NEO-PI-R.
Recently, McCrae (2018) acknowledged the presence of evaluative biases in NEO scores, but presented calculations that suggested the influence is relatively small. He suggested that facet-facet correlations might be inflated by .10 due to evaluative bias. However, this average is uninformative. It could imply that all facets have a loading of .33 or -.33 on the evaluative bias factor, which introduces a bias of .33*.33 = .10 or .33*-.33 = -.10 in facet-facet correlations. In fact, the average absolute loading on the evaluative bias factor is .30. However, this masks the fact that some facets have no evaluative bias and others have much more evaluative bias. For example, the measure of competence beliefs (self-effacy) C1 has a loading of .66 on the evaluative bias factor, which is higher than the loading on conscientiousness (.52). It should be noted that the NEO-PI-R is a commercial instrument and that it is in the interest of McCrae to claim that the NEO-PI-R is a valid measure for personalty assessment. In contrast, I have no commercial interest in finding more or less evaluative bias in the NEO-PI-R. This may explain the different conclusions about the practical significance of evaluative bias in NEO-PI-R scores.
In short, the present analysis suggests that the amount of evaluative bias varies across facet scales. While the influence of evaluative bias tends to be modest for many scales, scales with highly desirable traits show rather strong influence of evaluative bias. In the future it would be interesting to use multi-method data to separate evaluative bias from content variance (Anusic et al., 2009).
Measurement of the Big Five
Structural equation modeling can be used to test substantive theories with a measurement model or to develop and evaluate measurement models. Unfortunately, personality psychologists have not taken advantage of structural equation modeling to improve personality questionnaires. The present study highlights two ways in which SEM analysis of personality ratings is beneficial. First, it is possible to model evaluative bias and to search for items with low evaluative bias. Minimizing the influence of evaluative bias increases the validity of personality scales. Second, the present results can be used to create better measures of the Big Five. Many short Big Five scales focus exclusively on a single facet. As a result, these measures do not actually capture the Big Five. To measure the Big Five efficiently, a measure requires several facets with high loadings on the Big Five factor. Three facets are sufficient to create a latent variable model that separates the facet-specific residual variance from the shared variance that reflects the Big Five. Based on the present results, the following facets seem good candidates for the measurement of the Big Five.
Neuroticism: Anxiety, Anger, and Depression. The shared variance reflects a general tendency to respond with negative emotions.
Extraversion: Warmth, Gregariousness, Positive Emotions: The shared variance reflects a mix of sciability and cheerfulness.
Openness: Aesthetics, Action, Ideas. The shared variance reflects an interest in a broad range of activities that includes arts, intellectual stimulation, as well as travel.
Agreeableness: Straightforwardness, Altruism, Complicance: The shared variance represents respecting others.
Conscientiousness: Order, Self-Discipline, Dutifulness. I do not include achievement striving because it may be less consistent across the life span. The shared variance represents following a fixed set of rules.
This is of course just a suggestion. More research is needed. What is novel is the use of reflective measurement models to examine this question. McCrae et al. (1996) and some others before them tried and failed. Here I show that it is possible and useful to fit facet corelations with a structural equation model. Thus, twenty years after McCrae et al. suggested we should not use SEM/CFA, it is time to reconsider this claim and to reject it. Most personality theories are reflective models. It is time to test these models with the proper statistical method.
Correction (8/31/2019): In an earlier version, I misspelled Colin DeYoung’s name. I wrote DeYoung with a small d. I thank Colin DeYoung for pointing out this mistake.
Introduction
One area of personality psychology aims to classify personality traits. I compare this activity to research in biology where organisms are classified into a large taxonomy.
In a hiearchical taxnomy, the higher levels are more abstract, less descriptive, but also comprise a larger group of items. For example, there are more mammals (class) than dogs (species).
in the 1980s, personality psychologists agreed on the Big Five. The Big Five represent a rather abstract level of description that combines many distinct traits into traits that are predominantly related to one of the Big Five dimensions. For example, talkative falls into the extraversion group.
To illustrate the level of abstraction, we can compare the Big Five to the levels in biology. After distinguishing vertebrate and invertebrate animals, there are five classes of vertebrate animals: mammals, fish, reptiles, birds, and amphibians). This suggests that the Big Five are a fairly high level of abstraction that cover a broad range of distinct traits within each dimension.
The Big Five were found using factor or pincipal component analysis (PCA). PCA is a methematical method that reduces the covariances among personality ratings to a smaller number of factors. The goal of PCA is to capture as much of the variance as possible with the smallest number of components. Evidently there is a trade-off. However, often the first components account for most of the variance while additional components add very little additional information. Using various criteria, five components seemed to account for most of the variance in personality ratings and the first five components could be identified in different datasets. So, the Big Five were born.
One important feature of PCA is that the components are independent (orthogonal). This is helpful to maximize the information that is captured with five dimensions. If the five dimensions would correlated, they would present overlapping variances and this redundancy would reduce the amount of explained variance. Thus, the Big Five are conceptually independent because they were discovered with a method that enforced independence.
Scale Scores are not Factors
While principal component analysis is useful to classify personality traits, it is not useful to do basic research on the causes and consequences of personality. For this purpose, personality psychologists create scales. Scales are usually created by summing items that belong to a common factor. For example, responses to the items “talkative,” “sociable,” and “reserved” are added up to create an extraversion score. Ratings of the item “reserved” are reversed so that higher scores reflect extraversion. Importantly, sum scores are only proxies of the components or factors that were identified in a factor analysis or a PCA. Thus, we need to distinguish between extraversion-factors and extraversion-scales. They are not the same thing. Unfortunately, personality psychologists often treat scales as if they were identical with factors.
Big Five Scales are not Independent
Now something strange happened when personalty psychologists examined the correlations among Big Five SCALES. Unlike the factors that were independent by design, Big Five Scales were not independent. Moreover, the correlations among Big Five scales were not random. Digman (1997) was the first to examine these correlations. The article has garnered over 800 citations.
Digman examined these correlations conducted another principal component analysis of the correlations. He found two factors. One factor for extraversion and openesss and the other factor for agreeableness and conscientiousness (and maybe low neuroticism). He proposed that these two factors represent an even higher level in a hierarchy of personality traits. Maybe like moving from the level of classess (mammals, fish, reptiles) to the level Phylum; a level that is so abstract that few people who are not biologists are familiar with.
Digman’s article stimulated further research on higher-order factors of personality, where higher means even higher than the Big Five, which are already at a fairly high level of abstraction. Nobody stopped to wonder how there could be higher-order factors if the Big Five are actually independent factors, and why Big Five scales show systematic correlations that were not present in factor analyses.
Instead personality psychologists speculated about the biological underpinning of the higher order factors. For example, Jordan B. Peterson (yes, them) and colleagues proposed that serotonin is related to higher stability (high agreeableness, high conscientiousness, and low neuroticism) (DeYoung, Peterson, and Higgins, 2002).
Rather than interpreting this finding as evidence that response tendencies contribute to correlations among Big Five scales, they interpreted this finding as a substantive finding about personality, society in the context of psychodynamic theories.
Only a few years later, separated from the influence of his advisor, DeYoung (2006) published a more reasonable article that used a multi-method approach to separate personality variance from method variance. This article provided strong evidence that a general evaluative bias (social desirable responding) contributes to correlations among Big Five Scales, which was formalized in Anusic et al.’s (200) model with an explicit evaluative bias (halo) factor.
However, the idea of higher-order factors was sustained by finding cross-method correlations that were consistent with the higher-order model.
After battling Colin as a reviewer, when we submitted a manuscript on halo bias in personality ratings, we finally were able to publish a compromise model that also included the higher order factors (stability/alpha; plasticity/beta), although we had problems identifying the alpha factor in some datasets.
The Big Mistake
Meanwhile, another article built on the 2002 model that did not control for rating biases and proposed that the correlation between the two higher-order factors implies that there is an even higher level in the hierarchy. The Big Trait of Personality makes people actually have more desirable personalities; They are less neurotic, more sociable, open, agreeable, and conscientious. Who wouldn’t want one of them as a spouse or friend? However, the 2006 article by DeYoung showed that the Big One only exists in the imagination of individuals and is not shared with perceptions by others. This finding was replicated in several datasets by Anusic et al. (2009).
Although claims about the Big One were already invalidated when the article was published, it appealed to some personality psychologists. In particular, white supremacist Phillip Rushton found the idea of a generally good personality very attractive and spend the rest of his life promoting it (Rushton & Irving, 2011; Rushton Bons, & Hur, 2008). He never realized the distinction between a personality factor, which is a latent construct, and a personality scale, which is the manifest sum-score of some personality items, and ignored DeYoung’s (2006) and other (Anusic et al., 2009) evidence that the evaluative portion in personality ratings is a rating bias and not substantive covariance among the Big Five traits.
Peterson and Rushton are examples of pseudo-science that mixes some empirical findings with grand ideas about human nature that are only loosely related. Fortunately, interest in the general factor of personality seems to be decreasing.
Higher Order Factors or Secondary Loadings?
Ashton, Lee, Goldberg, and deVries (2009) put some cold water on the idea of higher-order factors. They pointed out that correlations between Big Five Scales may result from secondary loadings of items on Big Five Factors. For example, the item adventurous may load on extraversion and openness. If the item is used to create an extraversion scale, the openness and extraversion scale will be positively correlated.
As it turns out, it is always possible to model the Big Five as independent factors with secondary loadings to avoid correlations among factors. After all, this is how exploratory factor analysis or PCA are able to account for correlations among personality items with independent factors or components. In an EFA, all items have secondary loadings on all factors, although some of these correlations may be small.
There are only two ways to distinguish empirically between a higher-order model and a secondary-loading model. One solution is to obtain measures of the actual causes of personality (e.g., genetic markers, shared environment factors, etc.) If there are higher order factors, some of the causes should influence more than one Big Five dimension. The problem is that it has been difficult to identify causes of personality traits.
The second approach is to examine the number of secondary loadings. If all openness items load on extraversion in the same direction (e.g., adventurous, interest in arts, interest in complex issues), it suggests that there is a real common cause. However, if secondary loadings are unique to one item (adventurous), it suggests that the general factors are independent. This is by no means a definitive test of the structure of personality, but it is instructive to examine how many items from one trait have secondary loadings on another trait. Even more informative would be the use of facet-scales rather than individual items.
I have examined this question in two datasets. One dataset is an online sample with items from the IPIP-100 (Johnson). The other dataset is an online sample with the BFI (Gosling and colleagues). The factor loading matrices have been published in separate blog posts and the syntax and complete results have been posted on OSF (Schimmack, 2019b; 2019c).
IPIP-100
Neuroticism items show 8 out of 16 secondary loadings on agreeableness, and 4 out of 16 secondary loadings on conscientiousnes.
Item#
N
E
O
A
C
EVB
ACQ
Neuroticism
easily disturbed
3
0.44
-0.25
not easily bothered
10
-0.58
-0.12
-0.11
0.25
relaxed most of the time
17
-0.61
0.19
-0.17
0.27
change my mood a lot
25
0.55
-0.15
-0.24
feel easily threatened
37
0.50
-0.25
get angry easily
41
0.50
-0.13
get caught up in my problems
42
0.56
0.13
get irritated easily
44
0.53
-0.13
get overwhelmed by emotions
45
0.62
0.30
stress out easily
46
0.69
0.11
frequent mood swings
56
0.59
-0.10
often feel blue
77
0.54
-0.27
-0.12
panic easily
80
0.56
0.14
rarely get irritated
82
-0.52
seldom feel blue
83
-0.41
0.12
take offense easily
91
0.53
worry about things
100
0.57
0.21
0.09
SUM
0.83
-0.05
0.00
0.07
-0.02
-0.38
0.12
Agreeableness items show only one secondary loading on conscientiousness and one on neuroticism.
Agreeableness
indifferent to feelings of others
8
-0.58
-0.27
0.16
not interested in others’ problems
12
-0.58
-0.26
0.15
feel little concern for others
35
-0.58
-0.27
0.18
feel others’ emotions
36
0.60
0.22
0.17
have a good word for everybody
49
0.59
0.10
0.17
have a soft heart
51
0.42
0.29
0.17
inquire about others’ well-being
58
0.62
0.32
0.19
insult people
59
0.19
0.12
-0.32
-0.18
-0.25
0.15
know how to comforte others
62
0.26
0.48
0.28
0.17
love to help others
69
0.14
0.64
0.33
0.19
sympathize with others’ feelings
89
0.74
0.30
0.18
take time out for others
92
0.53
0.32
0.19
think of others first
94
0.61
0.29
0.17
SUM
-0.03
0.07
0.02
0.84
0.03
0.41
0.09
Finally, conscientiousness items show only one secondary loading on agreeableness.
Conscientiousness
always prepared
2
0.62
0.28
0.17
exacting in my work
4
-0.09
0.38
0.29
0.17
continue until everything is perfect
26
0.14
0.49
0.13
0.16
do things according to a plan
28
0.65
-0.45
0.17
do things in a half-way manner
29
-0.49
-0.40
0.16
find it difficult to get down to work
39
0.09
-0.48
-0.40
0.14
follow a schedule
40
0.65
0.07
0.14
get chores done right away
43
0.54
0.24
0.14
leave a mess in my room
63
-0.49
-0.21
0.12
leave my belongings around
64
-0.50
-0.08
0.13
like order
65
0.64
-0.07
0.16
like to tidy up
66
0.19
0.52
0.12
0.14
love order and regularity
68
0.15
0.68
-0.19
0.15
make a mess of things
72
0.21
-0.50
-0.26
0.15
make plans and stick to them
75
0.52
0.28
0.17
neglect my duties
76
-0.55
-0.45
0.16
forget to put things back
79
-0.52
-0.22
0.13
shirk my duties
85
-0.45
-0.40
0.16
waste my time
98
-0.49
-0.46
0.14
SUM
-0.03
-0.01
0.01
0.03
0.84
0.36
0.00
Of course, there could be additional relationships that are masked by fixing most secondary loadings to zero. However, it also matters how strong the secondary loadings are. Weak secondary loadings will produce weak correlations among Big Five scales. Even the secondary loadings in the model are weak. Thus, there is little evidence that neuroticism, agreeableness, and conscientiousness items are all systematically related as predicted by a higher-order model. At best, the data suggest that neuroticism has a negative influence on agreeable behaviors. That is, people differ in their altruism, but agreeable neurotic people are less agreeable when they are in a bad mood.
Results for extraversion and openness are similar. Only one extraversion item loads on openness.
Extraversion
hard to get to know
7
-0.45
-0.23
0.13
quiet around strangers
16
-0.65
-0.24
0.14
skilled handling social situations
18
0.65
0.13
0.39
0.15
am life of the party
19
0.64
0.16
0.14
don’t like drawing attention to self
30
-0.54
0.13
-0.14
0.15
don’t mind being center of attention
31
0.56
0.23
0.13
don’t talk a lot
32
-0.68
0.23
0.13
feel at ease with people
33
-0.20
0.64
0.16
0.35
0.16
feel comfortable around others
34
-0.23
0.65
0.15
0.27
0.16
find it difficult to approach others
38
-0.60
-0.40
0.16
have little to say
57
-0.14
-0.52
-0.25
0.14
keep in the background
60
-0.69
-0.25
0.15
know how to captivate people
61
0.49
0.29
0.28
0.16
make friends easily
73
-0.10
0.66
0.14
0.25
0.15
feel uncomfortable around others
78
0.22
-0.64
-0.24
0.14
start conversations
88
0.70
0.12
0.27
0.16
talk to different people at parties
93
0.72
0.22
0.13
SUM
-0.04
0.88
0.02
0.06
-0.02
0.37
0.01
And only one extraversion item loads on openness and this loading is in the opposite direction from the prediction by the higher-order model. While open people tend to like reading challenging materials, extraverts do not.
Openness
full of ideas
5
0.65
0.32
0.19
not interested in abstract
ideas
11
-0.46
-0.27
0.16
do not have good imagination
27
-0.45
-0.19
0.16
have rich vocabulary
50
0.52
0.11
0.18
have a vivid imagination
52
0.41
-0.11
0.28
0.16
have difficulty imagining things
53
-0.48
-0.31
0.18
difficulty understanding
abstract ideas
54
0.11
-0.48
-0.28
0.16
have excellent ideas
55
0.53
-0.09
0.37
0.22
love to read challenging materials
70
-0.18
0.40
0.23
0.14
love to think up new ways
71
0.51
0.30
0.18
SUM
-0.02
-0.04
0.75
-0.01
-0.02
0.40
0.09
The next table shows the correlations among the Big Five SCALES.
Scale Correlations
N
E
O
A
C
Neuroticism (N)
–
Extraversion (E)
-0.21
–
Openness (O)
-0.16
0.13
–
Agreeableness (A)
-0.13
0.27
0.17
–
Conscientiousness (C)
-0.17
0.11
0.14
0.20
–
The pattern mostly reflects the influence of the evaluative bias factor that produces negative correlations of neuroticism with the other scales and positive correlations among the other scales. There is no evidence that extraversion and openness are more strongly correlated in the IPIP-100. Overall, these results are rather disappointing for higher-order theorists.
The next table shows the correlations among the Big Five Scales.
Scale Correlations
N
E
O
A
C
Neuroticism (N)
–
Extraversion (E)
-0.21
–
Openness (O)
-0.16
0.13
–
Agreeableness (A)
-0.13
0.27
0.17
–
Conscientiousness (C)
-0.17
0.11
0.14
0.20
–
The pattern of correlations reflects mostly the influence of the evaluative bias factor. As a result, the neuorticism scale is negatively correlated with the other scales and the other scales are positively correlated with each other. There is no evidence for a stronger correlation between extraversion and openness because there are no notable secondary loadings. There is also no evidence that agreeableness and conscientiousness are more strongly related to neuroticism. Thus, these results show that DeYoung’s (2006) higher-order model is not consistent across different Big Five questionnaires.
Big Five Inventory
DeYoung found the higher-order factors with the Big Five Inventory. Thus, it is particularly interesting to examine the secondary loadings in a measurement model with independent Big Five factors (Schimmack, 2019b).
Neuroticism items have only one secondary loading on agreeableness and one on conscientiousness and the magnitude of these loadings is small.
Item#
N
E
O
A
C
EVB
ACQ
Neuroticism
depressed/blue
4
0.33
-0.15
0.20
-0.48
0.06
relaxed
9
-0.72
0.23
0.18
tense
14
0.51
-0.25
0.20
worry
19
0.60
-0.08
0.07
-0.21
0.17
emotionally stable
24
-0.61
0.27
0.18
moody
29
0.43
-0.33
0.18
calm
34
-0.58
-0.04
-0.14
-0.12
0.25
0.20
nervous
39
0.52
-0.25
0.17
SUM
0.79
-0.08
-0.01
-0.05
-0.02
-0.42
0.05
Four out of nine agreeableness items have secondary loadings on neuroticism, but the magnitude of these loadings is small. Four items also have loadings on conscientiousness, but one item (forgiving) has a loading opposite to the one predicted by the hgher-order model.
Agreeableness
find faults w. others
2
0.15
-0.42
-0.24
0.19
helpful / unselfish
7
0.44
0.10
0.29
0.23
start quarrels
12
0.13
0.20
-0.50
-0.09
-0.24
0.19
forgiving
17
0.47
-0.14
0.24
0.19
trusting
22
0.15
0.33
0.26
0.20
cold and aloof
27
-0.19
0.14
-0.46
-0.35
0.17
considerate and kind
32
0.04
0.62
0.29
0.23
rude
37
0.09
0.12
-0.63
-0.13
-0.23
0.18
like to cooperate
42
0.15
-0.10
0.44
0.28
0.22
SUM
-0.07
0.00
-0.07
0.78
0.03
0.44
0.04
For conscientiousness, only two items have a secondary loading on neuroticism and two items have a secondary loading on agreeableness.
Conscientiousness
thorough job
3
0.59
0.28
0.22
careless
8
-0.17
-0.51
-0.23
0.18
reliable worker
13
-0.09
0.09
0.55
0.30
0.24
disorganized
18
0.15
-0.59
-0.20
0.16
lazy
23
-0.52
-0.45
0.17
persevere until finished
28
0.56
0.26
0.20
efficient
33
-0.09
0.56
0.30
0.23
follow plans
38
0.10
-0.06
0.46
0.26
0.20
easily distracted
43
0.19
0.09
-0.52
-0.22
0.17
SUM
-0.05
0.00
-0.05
0.04
0.82
0.42
0.03
Overall, these results provide no support for the higher-order model that predicts correlations among all neuroticism, agreeableness, and conscientiousness items. These results are also consistent with Anusic et al.’s (2009) difficulty of identifying the alpha/stability factor in a study with the BFI-S, a shorter version of the BFI.
However, Anusic et al. (2009) did find a beta-factor with BFI-S scales. The present analysis of the BFI do not replicate this finding. Only two extraversion items have small loadings on the openness factor.
Extraversion
talkative
1
0.13
0.70
-0.07
0.23
0.18
reserved
6
-0.58
0.09
-0.21
0.18
full of energy
11
0.34
-0.11
0.58
0.20
generate enthusiasm
16
0.07
0.44
0.11
0.50
0.20
quiet
21
-0.81
0.04
-0.21
0.17
assertive
26
-0.09
0.40
0.14
-0.24
0.18
0.24
0.19
shy and inhibited
31
0.18
0.64
-0.22
0.17
outgoing
36
0.72
0.09
0.35
0.18
And only one openness item has a small loading that is opposite to the predicted direction. Extraverts are less likely to like reflecting.
Openness
original
5
0.53
-0.11
0.38
0.21
curious
10
0.41
-0.07
0.31
0.24
ingenious
15
0.57
0.09
0.21
active imagination
20
0.13
0.53
-0.17
0.27
0.21
inventive
25
-0.09
0.54
-0.10
0.34
0.20
value art
30
0.12
0.46
0.09
0.16
0.18
like routine work
35
-0.28
0.10
0.13
-0.21
0.17
like reflecting
40
-0.08
0.58
0.27
0.21
few artistic interests
41
-0.26
-0.09
0.15
sophisticated in art
44
0.07
0.44
-0.06
0.10
0.16
SUM
0.04
-0.03
0.76
-0.04
-0.05
0.36
0.19
In short, there is no support for the presence of a higher-order factor that produces overlap between extraversion and openness.
The pattern of correlations among the BFI scales, however, might suggest that there is an alpha factor because neuroticism, agreeableness and conscientiousness tend to be more strongly correlated with each other than with other dimensions. This shows the problem of using scales to study higher-order factors. However, there is no evidence for a higher-order factor that combines extraversion and openness as the correlation between these traits is an unremarkable r = .18.
Scale Correlations
N
E
O
A
C
Neuroticism (N)
–
Extraversion (E)
-0.26
–
Openness (O)
-0.11
0.18
–
Agreeableness (A)
-0.28
0.16
0.08
–
Conscientiousness (C)
-0.23
0.18
0.07
0.25
–
So, why did DeYoung (2006) find evidence for higher-order factors? One possible explanation is that BFI scale correlations are not consistent across different samples. The next table shows the self-report correlations from DeYoung (2006) below the diagonal and discrepancies above the diagonal. Three of the four theoretically important correlations tend to be stronger in DeYoung’s (2006) data. It is therefore possible that the secondary loading pattern differs across the two datasets. It would be interesting to fit an item-level model to DeYoung’s data to explore this issue further.
Scale Correlations
N
E
O
A
C
Neuroticism (N)
–
0.10
0.03
-0.06
-0.08
Extraversion (E)
-0.16
–
0.07
0.01
0.03
Openness (O)
-0.08
0.25
–
-0.02
0.02
Agreeableness (A)
-0.36
0.15
0.06
–
-0.01
Conscientiousness (C)
-0.31
0.21
0.09
0.24
–
In conclusion, an analysis of the BFI also does not support the higher-order model. However, results seem to be inconsistent across different samples. While this suggests that more research is needed, it is clear that this research needs to model personality at the level of items and not with scale scores that are contaminated by evaluative bias and secondary loadings.
Conclusion
Hindsight is 20/20 and after 20 years of research on higher-order factors a lot of this research looks silly. How could there be higher order factors for the Big Five factors if the Big Five are independent factors (or components) by default. The search for higher-order factors with Big Five scales can be attributed to methodological limitations, although higher-order models with structural equation modeling have been around since the 1980. It is rather obvious that scale scores are impure measures and that correlations among scales are influenced by secondary loadings. However, even when this fact was pointed out by Ashton et al. (2009), it was ignored. The problem is mainly due to the lack of proper training in methods. Here the problem is the use of scales as indicators of factors, when scales introduce measurement error and higher-order factors are method artifacts.
The fact that it is possible to recover independent Big Five factors from questionnaires that were designed to measure five independent dimensions says nothing about the validity of the Big Five model. To examine the validity of the Big Five as a valid model of the highest level in a taxonomy of personality trait it is important to examine the relationship of the Big Five with the diverse population of personality traits. This is an important area of research that could also benefit from proper measurement models. This post merely focused on the search for higher order factors for the Big Five and showed that searching for higher-order factors of independent factors is a futile endeavor that only leads to wild speculations that are not based on empirical evidence (Peterson, Rushton).
Even DeYoung and Peterson seems to have realized that it is more important to examine the structure of personality below rather than above the Big Five (DeYoung, Quility, & Peterson, 2007) . Whether 10 aspects, 16 factors (Cattell) or 30 facets (Costa & McCrae) represent another meaningful level in a hierarchical model of personality traits remains to be examined. Removing method variance and taking secondary loadings into account will be important to separate valid variance from noise. Also, factor analysis is superior to principle component analysis unless the goal is simply to describe personality with atheoretical components that capture as much variance as possible.
Correct me if you can
This blog post is essentially a scientific article without peer-review. I prefer this mode of communication over submitting manuscript to traditional journals where a few reviewers have the power to prevent research from being published. This happened with a manuscript that Ivana Anusic and I submitted and that was killed by Colin DeYoung as a reviewer. I prefer open reviews and I invite Colin to write an open review of this “article.” I am happy to be corrected and any constructive comments would be a welcome contribution to advancing personality science. Simply squashing critical work so that nobody gets to see it is not advancing science. The new way of conducting open science with open submissions, open reviews is the way to go. Of course, others are also invited to engage in the debate. So, let’s start a debate with the thesis “Higher-order factors of the Big Five do not exist.”
Cookie Consent
We use cookies to improve your experience on our site. By using our site, you consent to cookies.