Category Archives: Big Five

A Psychometric Replication Study of the NEO-PI-R Structure

Psychological science has a replication crisis. Many textbook findings, especially in social psychology, failed to replicate over the past years. The reason for these surprising replication failures is that psychologists have used questionable research practices to produce results that confirm theories rather than using statistical methods to test theories and to let theories fail if the evidence does not support them. However, falsification of theories is a sign of scientific progress and it is time to subject psychological theories to real tests.

In personality psychology, the biggest theory is Big Five theory. In short, Big Five theory postulates that variation in personality across individuals can be described with five broad personality dimensions: neuroticism, extraversion, openness, agreeableness, and conscientiousness. Textbooks also claim that the Big Five are fairly universal and can be demonstrated in different countries and with different languages.

One limitation of these studies is that they often use vague criteria to claim that the Big Five have been found or that personality traits are universal. Psychometricians have developed rigorous statistical methods to test these claims, but these methods are rarely used by personality psychologists to test Big Five theory. Some personality psychologists even claimed that these methods should not be used to test Big Five theory because they fail to support the Big Five (McCrae et al., 1996). I have argued that it is time to test Big Five theory with rigorous methods and to let the data decide whether the Big Five exist or not. Other personality psychologists have also started to subject Big Five theory to more rigorous tests (Soto & John, 2017).

Big Five Theory

Big Five theory does not postulate that there are only five dimensions of personality. Rather, it starts with the observation that many important personality traits have been identified and labeled in everyday life. There are hundreds of words that describe individual differences such as helpful, organized, friendly, anxious, curious, or thoughtful. Big Five theory postulates that these personality traits are systematically related to each other. That is, organized individuals are also more likely to be thoughtful and anxious individuals are also more likely to be irritable and sad. Big Five theory explains these correlations among personality traits with five independent factors; that is some broad personality trait that causes covariations among more specific traits that are often called facets. For example, a general disposition to experience more intense unpleasant feelings may produce correlations among the disposition to experience more anxiety, anger, and sadness.

The main prediction of Big Five theory is that the pattern of correlations among personality traits should be similar across different samples and measurement instruments, and that factor analysis produces the same pattern of correlations.

Testing Big Five Theory

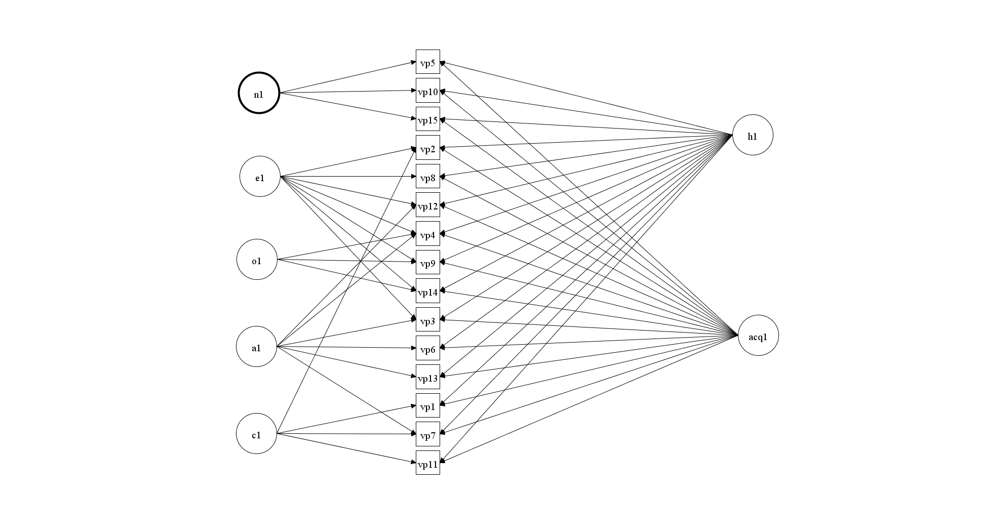
A proper psychometric test of Big Five theory requires a measurement model of the facets. If facets are not measured properly, it is impossible to examine the pattern of correlations among the facets. Thus, a proper test of Big Five theory requires fitting a hierarchical model to personality ratings. The first level of the hierarchy specifies a fairly large number of facets that are supposed to be related to one or more Big Five dimensions. The second level of the hierarchy specifies the Big Five factors so that it is possible to examine the relationships (factor loadings) of the facets on the Big Five factors. At present, very few studies have tried to test Big Five theory with hierarchical models. Soto and John (2017) tested Big Five theory with three facets for each Big Five domain and found reasonably good fit for their hierarchical models (see Figure for their model).

Although Soto and Johns’s (2017) article is a step in the right direction, it does not provide a thorough test of Big Five theory for several reasons. First, the model allows facets to correlate freely rather than testing the prediction that these correlations are produced by a Big Five factor. Second, models with only three indicators have zero degrees of freedom and produce perfect fit to the data. Thus, more than three facets are needed to test the prediction that Big Five factors account for the pattern of correlations among facets. Third, the model was fitted separately for each Big Five domain. Thus, there is no information about the relationship of facets to other Big Five factors. For example, the anger facet of neuroticism tends to show negative loadings on agreeableness. Whether such relationships are consistent across datasets is also important to examine.

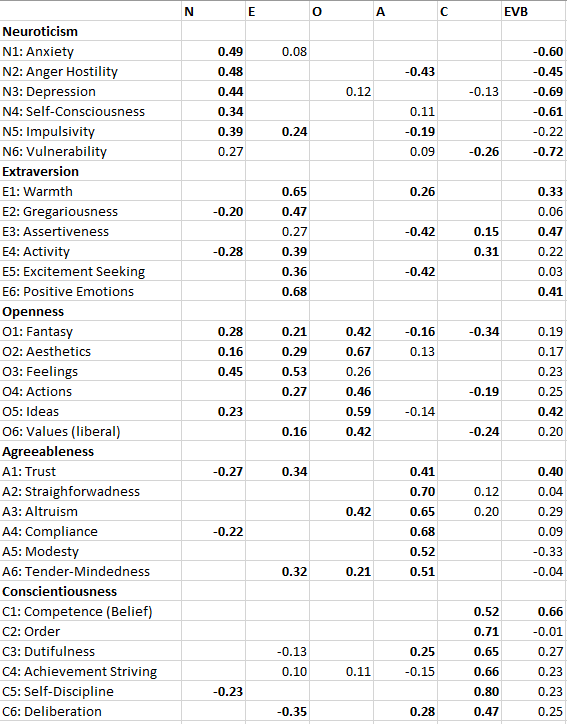
In a recent blog post, I presented I tried to fit a Big Five model to the 30 facets of the NEO-PI-R (Schimmack, 2019a). Table 1 shows the factor loadings of the 30 facets on the Big Five factors.

The results were broadly consistent with the theoretical Big Five structure. However, some facets did not show the predicted pattern. For example, excitement seeking did not load on extraversion. Other facets had rather weak loadings. For example, the loading of Impulsivity on neuroticism implies that less than 10% of the variance in impulsivity is explained by neuroticism. These results do not falsify Big Five theory by any means. However, they provide the basis for further theory development and refinement of personality theory. However, before any revisions of Big Five theory are made, it is important to examine the replicability of the factor structure in hierarchical measurement models.

Replication Study

Data

From 2010 to 2012 I posted a personality questionnaire with 303 items on the web. Visitors were provided with feedback about their personality on the Big Five dimensions and the 30 facets. In addition to the items that were used to provide feedback, the questionnaire contained several additional items that might help to improve measurement of facets. Furthermore, the questionnaire included some items about life-satisfaction because I have an interest in the relationship between personality traits and life-satisfaction. The questionnaire also included four questions about desirable attributes, namely attractiveness, intelligence, fitness, and broad knowledge. These questions have been used before to demonstrate evaluative biases in personality ratings (Anusic et al., 2009).

The covariance matrix for all 303 items is posted on OSF (web303.N808.cov.dat).

Models

Simple correlations and factor analysis were used to identify three indicators of the 30 NEO-facets. Good indicators should show moderate and similar correlations to each other. During this stage it became apparent that the item-set failed to capture the self-consciousness facet of neuroticism and the dutifulness facet of conscientiousness. Thus, these two facets could not be included in the model.

I first fitted a model that allowed the 28 facets to be correlated freely. This model evaluates the measurement of the 28 facets and provides information about the pattern of correlations among facets that Big Five theory aims to explain. This model showed very high correlations between the neuoroticism-facet anger and the agreeableness-facet compliance (r = .8), the warmth and gregariousness facets of extraversion (r = 1) , and the anxiety and vulnerability facets of neuroticism (r = .8). These correlations raise concerns about the discriminant validity of these facets and create problems in fitting a hierarchical model to the data. Thus, I dropped the vulnerability, gregariousness, and compliance items and facets from the model. Thus, the final model had 83 items, 26 facets, and factors for life-satisfaction and for desirable attributes.

The model fit for the model with correlated factors was accepted considering the RMSEA fit index, but below standard criteria for the CFI. However, examination of the modification indices showed that only freeing weak secondary loadings would further improve model fit. Thus, the model was considered adequate and model fit of this model served as a comparison standard for the hierarchical model, CFI = .867, RMSEA = .037.

The hierarchical model specified the Big Five as independent factors. In addition, it included an acquiescence factor and an evaluative bias factor. The evaluative bias factor was allowed to correlate with the desirable attribute factor (cf. Anusic et al., 2009). Life-satisfaction was regressed on the facets, but only significant facets were retained in the final model. Model fit of this model was comparable to model fit of the baseline model, CFI = .861, RMSEA = .040.

The complete syntax and results can be found on OSF (https://osf.io/23k8v/).

Results

Measurement Model

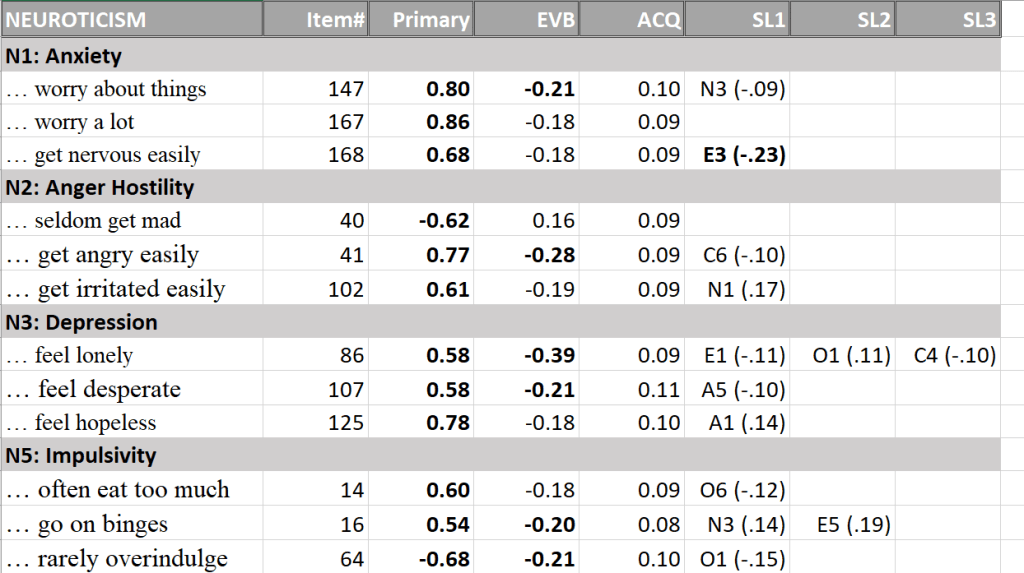
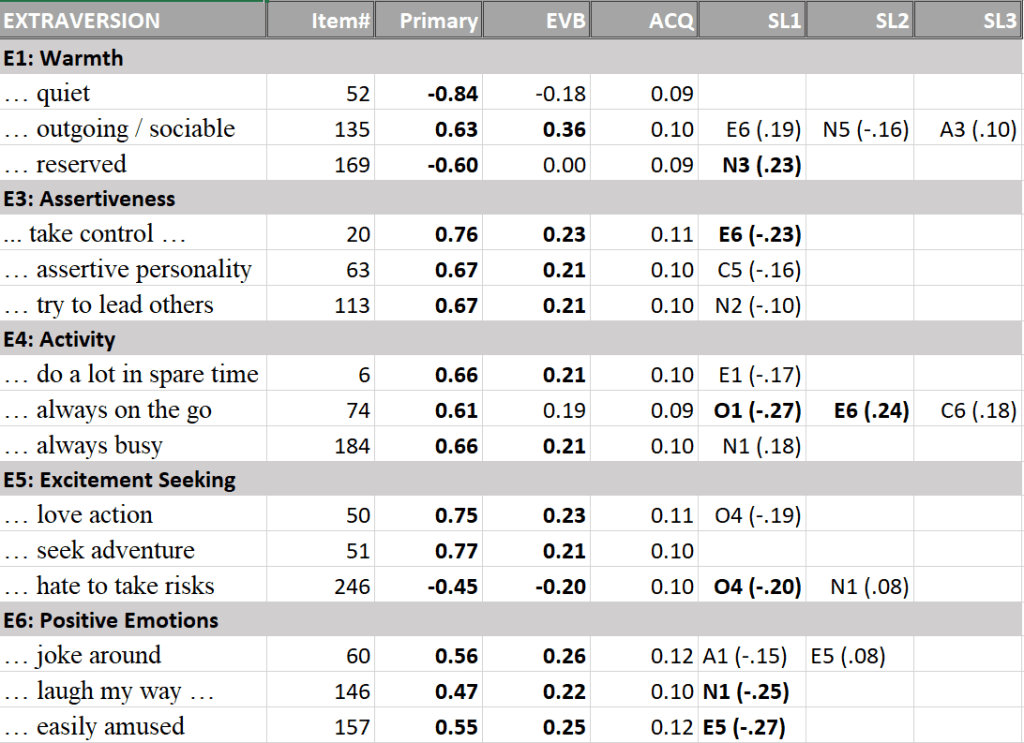
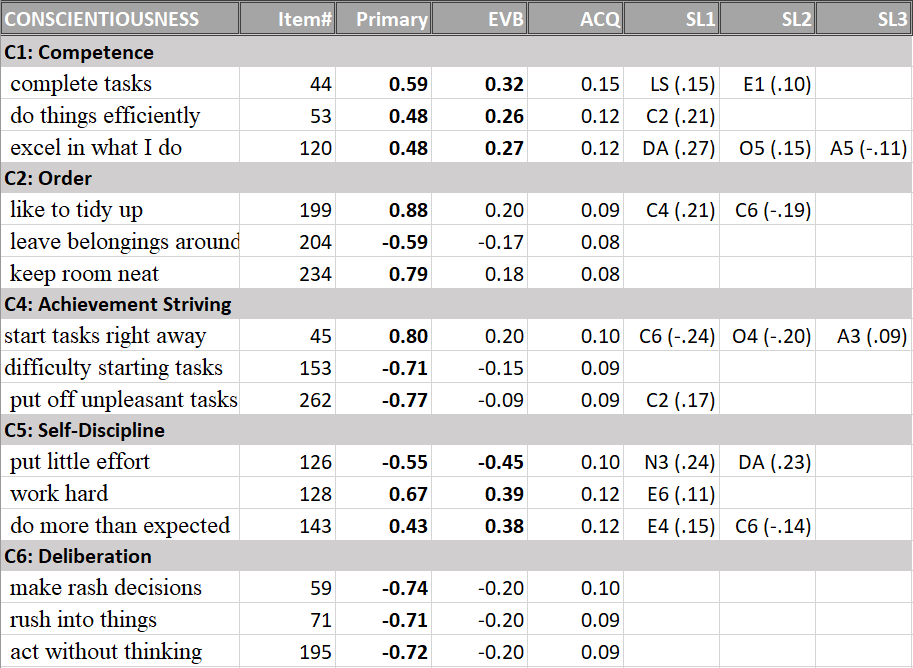
The first set of tables shows the item loadings on the primary factor, the evaluative bias factor, the acquiescence factor, and secondary loadings. Facet names are based on the NEO-PI-R.

Primary loadings of neuroticism items on their facets are generally high and secondary loadings are small (Table 1). Thus, the four neuroticism facets were clearly identified.

The measurement model for the extraversion facets also showed high primary loadings (Table 2).

For openness, one item of the values facet had a low loading, but the other two items clearly identified the facet (Table 3).

All primary loadings for the four agreeableness facets were above .4 and the facets were clearly identified (Table 4).

Finally, the conscientiousness facets were also clearly identified (Table 5).

In conclusion, the measurement model for the 24 facets showed that all facets were measured well and that the item content matches the facet labels. Thus, the basic requirement for examining the structural relationships among facets have been met.

Structural Model

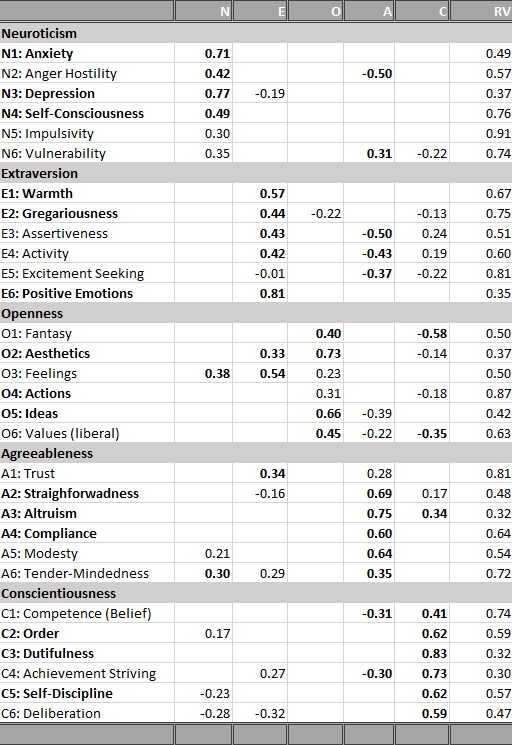
The most important result are the loadings of the 24 facets on the Big Five factors. These results are shown in Table 6. To ease interpretation, primary loadings greater than .4 and secondary loadings greater than .2 are printed in bold. Results that are consistent with the previous study of the NEO-PI-R are highlighted with a gray background.

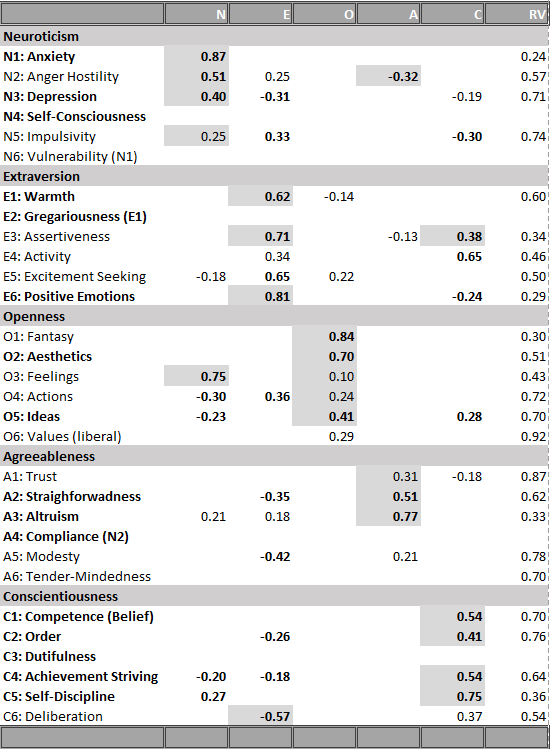
15 of the 24 primary loadings are above .4 and replicate results with the NEO-PI-R. This finding provides support for the Big Five model.

There are also four consistent loadings below .4, namely for the impulsivity facet of neuroticism, the openness facets feelings and actions, and the agreeableness facet of trust. This finding suggests that the model needs to be revised. Either there are measurement problems or openness is not related to emotions and actions. Problems with agreeableness have led to the creation of an alternative model with six factors (Ashton & Lee) that distinguishes two aspects of agreeableness.

There are eight facets with inconsistent loading patterns. Activity loaded with .34 on extraversion. More problematic was the high secondary loading on conscientiousness, suggesting that activity level is not clearly related to a single Big Five trait. The results for excitement seeking were particularly different. Excitement seeking did not load at all on extraversion in the NEO-PI-R model, but the loading in this sample was high.

The loading for values on openness was .45 for the NEO-PI-R and .29 in this sample. Thus, the results are more consistent than the use of the arbitrary .4 value suggests. Values are related to openness, but the relationship is weak and openness explains no more than 20% of the variance in holding liberal versus conservative values.

For agreeableness, compliance was represented by the anger facet of neuroticism, which did not load above .4 on agreeableness although the loading came close (-.32). Thus, the results do not require a revision of the model based on the present data. The biggest problem was that the modesty facet did not load highly on the agreeableness facet (.21). More research is needed to examine the relationship between modesty and agreeableness.

Results for conscientiousness were fairly consistent with theory and the loading of the deliberation facet on conscientiousness was just shy of the arbitrary .4 criterion (.37). Thus, no revision to the model is needed at this point.

The consistent results provide some robust markers of the Big Five, that is facets with high primary and low secondary loadings. Neuroticism is most clearly related to high anxiety and high vulnerability (sensitivity to stress), which could not be distinguished in the present dataset. However, other negative emotions like anger and depression are also consistently related to neuroticism. This suggests that neuroticism is a general disposition to experience more unpleasant emotions. Based on structural models of affective experiences, this dimension is related to Negative Activation and tense arousal.

Extraversion is consistently related to warmth and gregariousness, which could not be separated in the present dataset as well as assertiveness and positive emotions. One interpretation of this finding is that extraversion reflects positive activation or energetic arousal, which is a distinct affective system that has been linked to approach motivation. Structural analyses of affect also show that tense arousal and energetic arousal are two separate dimensions. The inconsistent results for action may reflect the fact that activity levels can also be influenced by more effortful forms of engagement that are related to conscientiousness. Extraverted activity might be more intrinsically motivated by positive emotions, whereas conscientious activity is more driven by extrinsic motivation.

The core facets of openness are fantasy/imagination, artistic interests, and intellectual engagement. The common feature of these facets is that attention is directed. The mind is traveling rather than being focused on the immediate situation. A better way to capture openness to feelings might be to distinguish feelings that arise from actual events versus emotions that are elicited by imagined events or art.

The core features of agreeableness are straighforwardness, altruism, and tender-mindedness, which could not be separated from altruism in this dataset. The common feature is a concern about the well-being of others versus a focus on the self. Trust may not load highly on agreeableness because the focus of trust is individuals own well-being. Trusting others may be beneficial for the self if others are trustworthy or harmful if they are not. However, it is not necessary to trust somebody in need to help them unless helping is risky.

The core feature of conscientiousness is self-discipline. Order and achievement striving (which is not the best label for this facet) also imply that conscientious people can stay focused on things that need to be done and are not easily distracted. Conscientious people are more likely to follow a set of rules.

There are only a few consistent secondary loadings. This suggest that many secondary loadings may be artifacts of item-selection or participant selection. The few consistent secondary loadings make theoretical sense. Anger loads negatively on agreeableness and this facet is probably best considered a blend of high neuroticism and low agreeableness.

Assertiveness shows a positive loading on conscientiousness. The reason is that conscientious people may have a strong motivation to follow their internal norms (a moral compass) and that they are wiling to assert these norms if necessary.

The openness to feelings facet has a strong “secondary” loading on neuroticism, suggesting that this facet does not measure what it was intended to measure. It just seems to be another measure of strong feelings without specifying the valence.

Finally, deliberation is negatively related to extraversion. This finding is consistent with the speculation that extraversion is related to approach motivation. Extraverts are more likely to give in to temptations, whereas conscientious individuals are more likely to resist temptations. In this context, the results for impulsivity are also noteworthy. At least in this dataset, implusive behaviors that were mostly related to eating were more strongly related to extraversion than to neuroticism. If neuroticism is strongly related to anxiety and avoidance behavior, it is not clear why neurotic individuals would be more impulsive. However, if extraversion reflects approach motivation, it makes more sense that extraverts are more likely to indulge.

Of course, these interpretations of the results are mere speculations. In fact, it is not even clear that the Big Five account for the correlations among facets. Some researchers have proposed that facets may directly influence each other. While this is possible, such models will have to explain the consistent pattern of correlations among facets. The present results are at least consistent with the idea that five broader dispositions explain some of these correlations.

Neuroticism is a broad disposition to experience a range of unpleasant emotions, not just anxiety.

Extraversion is a broad disposition to be actively and positively engaged.

Openness is a broad disposition to focus on internal processes (thoughts and feelings) rather than on external events and doing things.

Agreeableness is a broad disposition to be concerned with the well-being of others as opposed to being only concerned with oneself.

Conscientiousness is a broad disposition to be guided by norms and rules as opposed to being guided by momentary events or impulses.

While these broad dispositions account for some of the variance in specific personality traits, facets, facets add additional information that is not captured by the Big Five. The last column in Table 1 shows the residual (i.e., unexplained) variances in the facets. While the amount of unepxlained variance varies considerable across facets, the average is high (57%) and this estimate is consistent with the estimate in the NEO-PI-R (58%). Thus, the Big Five provide only a very broad and unclear impression of individuals’ personality.

Residual Correlations among Facets

Traditional factor analysis does not allow for correlations among the residual variances of indicators. CFA models that do not include these correlations have poor fit. I was only able to produce reasonable fit to the NEO-PI-R data by including correlated residuals in the model. This was also the case for this dataset. Table 7 shows the residual correlations. For the ease of interpretation, residual correlations that were consistent across models are highlighted in green.

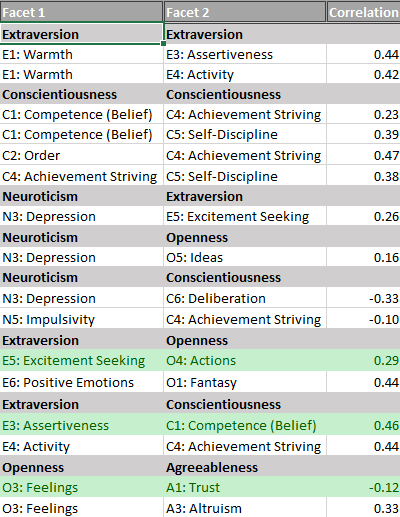
As can be seen, most of the residual correlations were inconsistent across datasets. This shows that the structure of facet correlations is not stable across these two datasets. This complicates the search for a structural model of personality because it will be necessary to uncover moderators of these inconsistencies.

Life Satisfaction

While dozens of articles have correlated Big Five measures with life-satisfaction scales, few studies have examined how facets are related to life-satisfaction (Schimmack, Oishi, Furr & Funder, 2004). The most consistent finding has been that the depression facet explains unique variance above and beyond neuroticism. This was also the case in this dataset. Depression was by far the strongest predictor of life-satisfaction (-.56). The only additional significant predictor that was added to the model was the competence facet (.22). Contrary to previous studies, the cheerfulness facet did not predict unique variance in life-satisfaction judgments. More research at the facet level and with other specific personality traits below the Big Five is needed. However, the present results confirm that facets contain unique information that contributes to the prediction of outcome variables. This is not surprising given the large amount of unexplained variance in facets.

Desirable Attributes

Table 8 shows the loadings of the four desirable attributes on the DA factor. Loadings are similar to those in Anusic et al. (2009). As objective correlations among these characteristics are close to zero, the shared variance can be interpreted as an evaluative bias. Items did not load on the evaluative bias factor to examine the relationship with the evaluative bias factor at the factor level.

Unexpectedly, the DA factor correlated only modestly with the evaluative bias factor for the facet-items, r = .38. This correlation is notably weaker than the correlation reported by Anusic et al. (2009), r = .76. This raises some questions about the nature of the evaluative bias variance. It is unfortunate that we do not know more about this persistent variance in personality ratings, one-hundred years after Thorndike (1920) first reported it.

Conclusion

In an attempt to replicate a hierarchical model of personality, I was only partially successful to cross-validate the original model. On the positive side, 15 out of 24 distinct facets had loadings on the predicted Big Five factor. This supports the Big Five as a broad model of personality. However, I also replicated some results that question the relationship between some facets and Big Five factors. For example, impulsiveness does not seem to be a facet of neuroticism and openness to actions may not be a facet of openness. Moreover, there were many inconsistent results that suggest the structure of personality is not as robust as one might expect. More research is needed to identify moderators of facet correlations. For example, in student samples anxiety may be a positive predictor of achievement striving, whereas it may be unrelated or negatively related to achievement striving in middle or old age.

Past research with exploratory methods has also ignored that the Big Five do not explain all of the correlations among facets. However, these correlations also seem to vary across samples.

All of these results do not make for neat and sexy JPSP article that proposes a simple model of personality structure, but the present results do suggest that one should not trust such simple models because personality structure is much more complex and unstable than these models suggest.

I can only repeat that personality research will only make progress by using proper methods that can actually test and falsify structural models. Falsification of simple and false models is the impetus for theory development. Thus, for the sake of progress, I declare that the Big Five model that has been underpinning personality research for 40 needs to be revised. Most importantly, progress can only be made if personality measures do not already assume that the Big Five are valid. Measures like the BFI-2 (Soto & John) or the NEO-PI-R have the advantage that they capture a wide range of personality differences at the facet level. Surely there are more than 15, 24, or 30 facets. So more research about personality at the facet level is required. Personality research might also benefit from a systematic model that integrates the diverse range of personality measures that have been developed for specific research questions from attachment styles to machiavellianism. All of this research would benefit from the use of structural equation modeling because SEM can fit a diverse range of models and provides information of model fit.

A Psychometric Study of the NEO-PI-R

Galileo had the clever idea to turn a microscope into a telescope and to point it towards the night sky. His first discovery was that Jupiter had four massive moons that are now known as the Galilean moons (Space.com).

Now imagine what would have happened if Galileo had an a priori theory that Jupiter has five moons and after looking through the telescope, Galileo decided that the telescope was faulty because he could see only four moons. Surely, there must be five moons and if the telescope doesn’t show them, it is a problem of the telescope. Astronomers made progress because they created credible methods and let empirical data drive their theories. Eventually even better telescopes discovered many more, smaller moons orbiting around Jupiter. This is scientific progress.

Alas, psychologists don’t follow the footsteps of natural sciences. They mainly use the scientific method to provide evidence that confirms their theories and dismiss or hide evidence that disconfirms their theories. They also show little appreciation for methodological improvements and often use methods that are outdated. As a result, psychology has made little progress in developing theories that rest of solid empirical foundations.

An example of this ill-fated approach to science is McCrae et al.’s (1996) attempt to confirm their five factor model with structural equation modeling (SEM). When they failed to find a fitting model, they decided that SEM is not an appropriate method to study personality traits because SEM didn’t confirm their theory. One might think that other personality psychologists realized this mistake. However, other personality psychologists were also motivated to find evidence for the Big Five. Personality psychologists had just recovered from an attack by social psychologists that personality traits does not even exist, and they were all too happy to rally around the Big Five as a unifying foundation for personality research. Early warnings were ignored (Block, 1995). As a result, the Big Five have become the dominant model of personality without subjecting the theory to rigorous tests and even dismissing evidence that theoretical models do not fit the data (McCrae et al., 1996). It is time to correct this and to subject Big Five theory to a proper empirical test by means of a method that can falsify bad models.

I have demonstrated that it is possible to recover five personality factors, and two method factors, from Big Five questionnaires (Schimmack, 2019a, 2019b, 2019c). These analyses were limited by the fact that the questionnaires were designed to measure the Big Five factors. A real test of Big Five theory requires to demonstrate that the Big Five factors explain the covariations among a large set of a personality traits. This is what McCrae et al. (1996) tried and failed to do. Here I replicate their attempt to fit a structural equation model to the 30 personality traits (facets) in Costa and McCrae’s NEO-PI-R.

In a previous analysis I was able to fit an SEM model to the 30 facet-scales of the NEO-PI-R (Schimmack, 2019d). The results only partially supported the Big Five model. However, these results are inconclusive because facet-scales are only imperfect indicators of the 30 personality traits that the facets are intended to measure. A more appropriate way to test Big Five theory is to fit a hierarchical model to the data. The first level of the hierarchy uses items as indicators of 30 facet factors. The second level in the hierarchy tries to explain the correlations among the 30 facets with the Big Five. Only structural equation modeling is able to test hierarchical measurement models. Thus, the present analyses provide the first rigorous test of the five-factor model that underlies the use of the NEO-PI-R for personality assessment.

The complete results and the MPLUS syntax can be found on OSF (https://osf.io/23k8v/). The NEO-PI-R data are from Lew Goldberg’s Eugene-Springfield community sample. Theyu are publicly available at the Harvard Dataverse

Results

Items

The NEO-PI-R has 240 items. There are two reasons why I analyzed only a subset of items. First, 240 variables produce 28,680 covariances, which is too much for a latent variable model, especially with a modest sample size of 800 participants. Second, a reflective measurement model requires that all items measure the same construct. However, it is often not possible to fit a reflective measurement model to the eight items of a NEO-facet. Thus, I selected three core-items that captured the content of a facet and that were moderately positively correlated with each other after reversing reverse-scored items. Thus, the results are based on 3 * 30 = 90 items. It has to be noted that the item-selection process was data-driven and needs to be cross-validated in a different dataset. I also provide information about the psychometric properties of the excluded items in an Appendix.

The first model did not impose a structural model on the correlations among the thirty facets. In this model, all facets were allowed to correlate freely with each other. A model with only primary factor loadings had poor fit to the data. This is not surprising because it is virtually impossible to create pure items that reflect only one trait. Thus, I added secondary loadings to the model until acceptable model fit was achieved and modification indices suggested no further secondary loadings greater than .10. This model had acceptable fit, considering the use of single-items as indicators, CFI = .924, RMSEA = .025, .035. Further improvement of fit could only be achieved by adding secondary loadings below .10, which have no practical significance. Model fit of this baseline model was used to evaluate the fit of a model with the Big Five factors as second-order factors.

To build the actual model, I started with a model with five content factors and two method factors. Item loadings on the evaluative bias factor were constrained to 1. Item loadings for on the acquiescence factor were constrained to 1 or -1 depending on the scoring of the item. This model had poor fit. I then added secondary loadings. Finally, I allowed for some correlations among residual variances of facet factors. Finally, I freed some loadings on the evaluative bias factor to allow for variation in desirability across items. This way, I was able to obtain a model with acceptable model fit, CFI = .926, RMSEA = .024, SRMR = .045. This model should not be interpreted as the best or final model of personality structure. Given the exploratory nature of the model, it merely serves as a baseline model for future studies of personality structure with SEM. That being said, it is also important to take effect sizes into account. Parameters with substantial loadings are likely to replicate well, especially in replication studies with similar populations.

Item Loadings

Table 1 shows the item-loadings for the six neuroticism facets. All primary loadings exceed .4, indicating that the three indicators of a facet measure a common construct. Loadings on the evaluative bias factors were surprisingly small and smaller than in other studies (Anusic et al., 2009; Schimmack, 2009a). It is not clear whether this is a property of the items or unique to this dataset. Consistent with other studies, the influence of acquiescence bias was weak (Rorer, 1965). Secondary loadings also tended to be small and showed no consistent pattern. These results show that the model identified the intended neuroticism facet-factors.

Table 2 shows the results for the six extraversion facets. All primary factor loadings exceed .40 and most are more substantial. Loadings on the evaluative bias factor tend to be below .20 for most items. Only a few items have secondary loadings greater than .2. Overall, this shows that the six extraversion facets are clearly identified in the measurement model.

Table 3 shows the results for Openness. Primary loadings are all above .4 and the six openness factors are clearly identified.

Table 4 shows the results for the agreeableness facets. In general, the results also show that the six factors represent the agreeableness facets. The exception is the Altruism facet, where only two items show a substantial loadings. Other items also had low loadings on this factor (see Appendix). This raises some concerns about the validity of this factor. However, the high-loading items suggest that the factor represents variation in selfishness versus selflessness.

Table 5 shows the results for the conscientiousness facets. With one exception, all items have primary loadings greater than .4. The problematic item is the item “produce and common sense” (#5) of the competence facet. However, none of the remaining five items were suitable (Appendix).

In conclusion, for most of the 30 facets it was possible to build a measurement model with three indicators. To achieve fit, the model included 76 out of 2,610 (3%) secondary loadings. Many of these secondary loadings were between .1 and .2, indicating that they have no substantial influence on the correlations of factors with each other.

Facet Loadings on Big Five Factors

Table 6 shows the loadings of the 30 facets on the Big Five factors. Broadly speaking the results provide support for the Big Five factors. 24 of the 30 facets (80%) have a loading greater than .4 on the predicted Big Five factor, and 22 of the 30 facets (73%) have the highest loading on the predicted Big Five factor. Many of the secondary loadings are small (< .3). Moreover, secondary loadings are not inconsistent with Big Five theory as facet factors can be related to more than one Big Five factor. For example, assertiveness has been related to extraversion and (low) agreeableness. However, some findings are inconsistent with McCrae et al.’s (1996) Five factor model. Some facets do not have the highest loading on the intended factor. Anger-hostility is more strongly related to low agreeableness than to neuroticism (-.50 vs. .42). Assertiveness is also more strongly related to low agreeableness than to extraversion (-.50 vs. .43). Activity is nearly equally related to extraversion and low agreeableness (-.43). Fantasy is more strongly related to low conscientiousness than to openness (-.58 vs. .40). Openness to feelings is more strongly related to neuroticism (.38) and extraversion (.54) than to openness (.23). Finally, trust is more strongly related to extraversion (.34) than to agreeableness (.28). Another problem is that some of the primary loadings are weak. The biggest problem is that excitement seeking is independent of extraversion (-.01). However, even the loadings for impulsivity (.30), vulnerability (.35), openness to feelings (.23), openness to actions (.31), and trust (.28) are low and imply that most of the variance in this facet-factors is not explained by the primary Big Five factor.

The present results have important implications for theories of the Big Five, which differ in the interpretation of the Big Five factors. For example, there is some debate about the nature of extraversion. To make progress in this research area it is necessary to have a clear and replicable pattern of factor loadings. Given the present results, extraversion seems to be strongly related to experiences of positive emotions (cheerfulness), while the relationship with goal-driven or reward-driven behavior (action, assertiveness, excitement seeking) is weaker. This would suggest that extraversion is tight to individual differences in positive affect or energetic arousal (Watson et al., 1988). As factor loadings can be biased by measurement error, much more research with proper measurement models is needed to advance personality theory. The main contribution of this work is to show that it is possible to use SEM for this purpose.

The last column in Table 6 shows the amount of residual (unexplained) variance in the 30 facets. The average residual variance is 58%. This finding shows that the Big Five are an abstract level of describing personality, but many important differences between individuals are not captured by the Big Five. For example, measurement of the Big Five captures very little of the personality differences in Excitement Seeking or Impulsivity. Personality psychologists should therefore reconsider how they measure personality with few items. Rather than measuring only five dimensions with high reliability, it may be more important to cover a broad range of personality traits at the expense of reliability. This approach is especially recommended for studies with large samples where reliability is less of an issue.

Residual Facet Correlations

Traditional factor analysis can produce misleading results because the model does not allow for correlated residuals. When such residual correlations are present, they will distort the pattern of factor loadings; that is, two facets with a residual correlation will show higher factor loadings. The factor loadings in Table 6 do not have this problem because the model allowed for residual correlations. However, allowing for residual correlations can also be a problem because freeing different parameters can also affect the factor loadings. It is therefore crucial to examine the nature of residual correlations and to explore the robustness of factor loadings across different models. The present results are based on a model that appeared to be the best model in my explorations. These results should not be treated as a final answer to a difficult problem. Rather, they should encourage further exploration with the same and other datasets.

Table 7 shows the residual correlation. First appear the correlations among facets assigned to the same Big Five factor. These correlations have the strongest influence on the factor loading pattern. For example, there is a strong correlation between the warmth and gregariousness facets. Removing this correlation would increase the loadings of these two facets on the extraversion factor. In the present model, this would also produce lower fit, but in other models this might not be the case. Thus, it is unclear how central these two facets are to extraversion. The same is also true for anxiety and self-consciousness. However, here removing the residual correlation would further increase the loading of anxiety, which is already the highest loading facet. This justifies the use of anxiety as the most commonly used indicator of neuroticism.

Table 7. Residual Factor Correlations

It is also interesting to explore the substantive implications of these residual correlations. For example, warmth and gregariousness are both negatively related to self-consciousness. This suggests another factor that influences behavior in social situations (shyness/social anxiety). Thus, social anxiety would be not just high neuroticism and low extraversion, but a distinct trait that cannot be reduced to the Big Five.

Other relationships are make sense. Modesty is negatively related to competence beliefs; excitement seeking is negatively related to compliance, and positive emotions is positively related to openness to feelings (on top of the relationship between extraversion and openness to feelings).

Future research needs to replicate these relationships, but this is only possible with latent variable models. In comparison, network models rely on item levels and confound measurement error with substantial correlations, whereas exploratory factor analysis does not allow for correlated residuals (Schimmack & Grere, 2010).

Conclusion

Personality psychology has a proud tradition of psychometric research. The invention and application of exploratory factor analysis led to the discovery of the Big Five. However, since the 1990s, research on the structure of personality has been stagnating. Several attempts to use SEM (confirmatory factor analysis) in the 1990s failed and led to the impression that SEM is not a suitable method for personality psychologists. Even worse, some researchers even concluded that the Big Five do not exist and that factor analysis of personality items is fundamentally flawed (Borsboom, 2006). As a result, personality psychologists receive no systematic training in the most suitable statistical tool for the analysis of personality and for the testing of measurement models. At present, personality psychologists are like astronomers who have telescopes, but don’t point them to the stars. Imagine what discoveries can be made by those who dare to point SEM at personality data. I hope this post encourages young researchers to try. They have the advantage of unbelievable computational power, free software (lavaan), and open data. As they say, better late than never.

Appendix

Running the model with additional items is time consuming even on my powerful computer. I will add these results when they are ready.

What lurks beneath the Big Five?

Any mature science classifies the objects that it studies. Chemists classify atoms. Biologists classify organisms. It is therefore not surprising that personalty psychologists have spent a lot of their effort on classifying personality traits; that is psychological attributes that distinguish individuals from each other.

[It is more surprising that social psychologists have spent very little effort on classifying situations; a task that is now being carried out by personality psychologists (Rauthmann et al., 2014)]

After decades of analyzing correlations among self-ratings of personality items, personality psychologists came to a consensus that five broad factors can be reliably identified. Since the 1980s, the so-called Big Five have dominated theories and measurement of personality. However, most theories of personality also recognize that the Big Five are not a comprehensive description of personality. That is, unlike colors that can be produced by mixing three basic colors, specific personality traits are not just a mixture of the Big Five. Rather, the Big Five represent an abstract level in a hierarchy of personality traits. It is possible to compare the Big Five to the distinction of five classes of vertebrate animals: mammals, birds, reptiles, fish, and amphibians. Although there are important distinctions between these groups, there are also important distinctions among the animals within each class; cats are not dogs.

Although the Big Five are a major achievement in personality psychology, it also has some drawbacks. As early as 1995, personality psychologists warned that focusing on the Big Five would be a mistake because the Big Five are too broad to be good predictors of important life outcomes (Block, 1995). However, this criticism has been ignored and many researchers seem to assume that they measure personality when they administer a Big Five questionnaire. To warrant the reliance on the Big Five would require that the Big Five capture most of the meaningful variation in personality. In this blog post, I use open data to test this implicit assumption that is prevalent in contemporary personality science.

Confirmatory Factor Analysis

In 1996, McCrae et al. (1995) published an article that may have contributed to the stagnation in research on the structure of personality. In this article, the authors argued that structural equation modeling (SEM), specifically confirmatory factor analysis (CFA), is not suitable for personality researchers. However, CFA is the only method that can be used to test structural theories and to falsify structural theories that are wrong. Even worse, McCrae et al. (1995) demonstrated that a simple-structure model did not fit their data. However, rather than concluding that personality structure is not simple, they concluded that CFA is the wrong method to study personality traits. The problem with this line of reasoning is self-evident and was harshly criticized by Borsboom (2006). If we dismiss methods because they do not show a theoretically predicted pattern, we loose the ability to test theories empirically.

To understand McCrae et al.’s (1995) reaction to CFA, it is necessary to understand the development of CFA and how it was used in psychology. In theory, CFA is a very flexible method that can fit any dataset. The main empirical challenge is to find plausible models and to find data that can distinguish between competing plausible models. However, when CFA was introduced, certain restrictions were imposed on models that could be tested. The most restrictive model imposed that a measurement model should have only primary loadings and no correlated residuals. Imposing these restrictions led to the foregone conclusions that the data are inconsistent with the model. At this point, researchers were supposed to give up, create a new questionnaire with better items, retest it with CFA and find out that there were still secondary loadings that produced poor fit to the data. The idea that actual data could have a perfect structure must have been invented by an anal-retentive statistician who never analyzed real data. Thus, CFA was doomed to be useless because it could only show that data do not fit a model.

It took some time and courage to decide that the straight-jacket of simple structure has to go. Rather than giving up after a simple-structure model was rejected, the finding should encourage further exploration of the data to find models that actually fit the data. Maybe biologists initially classified whales as fish, but so what. Over time, further testing suggested that they are mammals. However, if we never get started in the first place, we will never be able to develop a structure of personality traits. So, here I present a reflective measurement model of personality traits. I don’t call it CFA, because I am not confirming anything. I also don’t call it EFA because this term is used for a different statistical technique that imposes other restrictions (e.g., no correlated residuals, local independence). We might call it exploratory modeling (EM) or because it relies on structural equation modeling, we could call it ESEM. However, ESEM is already been used for a blind computer-based version of CFA. Thus, the term EM seems appropriate.

The Big Five and the 30 Facets

Costa and McCrae developed a personality questionnaire that assesses personality at two levels. One level are the Big Five. The other level are 30 more specific personality traits.

Image result for costa mccrae facets

The 30 facets are often presented as if they are members of a domain, just like dogs, cats, pigs, horses, elephants, and tigers are mammals and have nothing to do with reptiles or bird. However, this is an oversimplification. Actual empirical data show that personality structure is more complex and that specific facets can be related to more than one Big Five factor. In fact, McCrae et al. (1996) published the correlations of the 30 facets with the Big Five factors and the table shows many, and a few substantial, secondary loadings; that is, correlations with a factor other than the main domain. For example, Impulsive is not just positively related to Neuroticism. It is also positively related to extraversion, and negatively related to conscientiousness.

Thus, McCrae et al.’s (1996) results show that Big Five data do not have a simple structure. It is therefore not clear what model a CONFIRMATORY factor analysis tries to confirm, when the CFA model imposes a simple structure. McCrae et al. (1995) agree: “If, however, small loadings are in fact meaningful, CFA with a simple structure model may not fit well” (p. 553). In other words, if an exploratory factor analysis shows a secondary loading of Anger/Hostility on Agreeableness (r = -.40), indicating that agreeable people are less likely to get angry, it makes no sense to confirm a model that sets this parameter to zero. McCrae et al. also point out that simple structure makes no theoretical sense for personality traits. “There is no theoretical reason why traits should not have meaningful loadings on three, four, or five factors:” (p. 553). The logical consequence of this insight is to fit models that allow for meaningful secondary loadings; not to dismiss modeling personality data with structural equations.

However, McCrae et al. (1996) were wrong about the correct way of modeling secondary loadings. “It is possible to make allowances for secondary loadings in CFA by fixing the loadings at a priori values other than zero” (p. 553). Of course, it is possible to fix loadings to a non-zero value, but even for primary loadings, the actual magnitude of a loading is estimated by the data. It is not clear why this approach could not be used for secondary loadings. It is only impossible to let all secondary loadings to be freely estimated, but there is no need to fix the loading of anger/hostilty on the agreeableness factor to a fixed value to model the structure of personality.

Personality psychologists in the 1990s also seemed to not fully understand how sensitive SEM is to deviations between model parameters and actual data. McCrae et al. (1996) critically discuss a model by Church and Burke (1994) because it “regarded loadings as small as ± .20 as salient secondaries” (p. 553). However, fixing a loading of .20 to a value of 0, introduces a large discrepancy that will hurt overall fit. One either has to free parameters or lower the criterion for acceptable fit. However, fixing loadings greater than .10 to zero and hoping to met standard criteria of acceptable fit is impossible. Effect sizes of r = .2 (d = .4) are not zero, and treating them as such will hurt model fit.

In short, exploratory studies of the relationship between the Big Five and facets show a complex pattern with many non-trivial (r > .1) secondary loadings. Any attempt to model these data with SEM needs to be able to account for this finding. As many of these secondary loadings are theoretically expected and replicable, allowing for these secondary loadings makes theoretical sense and cannot be dismissed as overfitting of data. Rather, imposing a simple structure that makes no theoretical sense should be considered underfiting of the data, which of course results in bad fit.

Correlated Residuals are not Correlated Errors

Another confusion in the use of structural equation modeling is the interpretation of residual variances. In the present context, residuals represent the variance in a facet scale that is not explained by the Big Five factors. Residuals are interesting for two reasons. First, they provide information about unique aspects of personality that are not explained by the Big Five. To use the analogy of animals, although cats and dogs are both animals, they also have distinct features. Residuals are analogous to these distinct features, and we would think that personality psychologists would be very interested in exploring this question. However, statistics textbooks tend to present residual variances as error variance in the context of measurement models where items are artifacts that were created to measure a specific construct. As the only purpose of the item is to measure a construct, any variance that does not reflect the intended construct is error variance. If we were only interested in measuring the Big Five, we would think about residual facet-variance as error variance. It does not matter how depressed people are. We only care about their neuroticism. However, the notion of a hierarchy implies that we do care about the valid variance in facets that is not explained by the Big Five. Thus, residual variance is not error variance.

The mistake of treating residual variance as error variance becomes especially problematic when residual variance in one facet is related to residual variance in another facet. For example, how angry people get (the residual variance in anger) could be related to how compliant people are (the residual variance in compliance). After all, anger could be elicit by a request to comply to some silly norms (e.g., no secondary loadings) that make no sense. There is no theoretical reason, why facets could only be linked by means of the Big Five. In fact, a group of researchers has attempted to explain all relations among personality facet without the Big Five because they don’t belief in broader factors (cf. Schimmack, 2019b). However, this approach has difficulties explaining the constistent primary loadings of facets on their predicted Big Five factor.

The confusion of residuals with errors accounts at least partially for McCrae et al.’s (1996) failure to fit a measurement model to the correlations among the 30 facets.

“It would be possible to specify a correlated error term between these two scales, but the interpretation of such a term is unclear. Correlated error usually refers to a nonsubstantive
source of variance. If Activity and Achievement Striving were, say, observer ratings, whereas all other variables were self-reports, it would make sense to control for this difference in method by introducing a correlated error term. But there are no obvious sources of correlated error among the NEO-PI-R facet scales in the present study” (p. 555).

The Big Five Are Independent Factors, but Evaluative Bias produces correlations among Big Five Scales

Another decision researchers have to make is whether they specify models with independent factors or whether they allow factors to be correlated. That is, are extraversion and openness independent factors or are extraversion and openness correlated. A model with correlated Big Five factors has 10 additional free parameters to fit the data. Thus, the model will is likely to fit better than a model with independent factors. However, the Big Five were discovered using a method that imposed independence (EFA and Varimax rotation). Thus, allowing for correlations among the factors seems atheoretical, unless an explanation for these correlations can be found. On this front, personality researchers have made some progress by using multi-method data (self-ratings and ratings by informants). As it turns out, correlations among the Big Five are only found in ratings by a single rater, but not in correlations across raters (e.g., self-rated Extraversion and informant-rated Agreeableness). Additional research has further validated that most of this variance reflects response styles in ratings by a single rater. These biases can be modeled with two method factors. One factor is an acquiescence factor that leads to higher or lower ratings independent of item content. The other factor is an evaluative bias (halo) factor. It represent responses to the desirability of items. I have demonstrated in several datasets that it is possible to model the Big Five as independent factors and that correlations among Big Five Scales are mostly due to the contamination of scale scores with evaluative bias. As a result, neuroticism scales tend to be negatively related to the other scales because neuroticism is undesirable and the other traits are desirable (see Schimmack, 2019a). Although the presence of evaluative biases in personality ratings has been known for decades, previous attempts at modeling Big Five data with SEM often failed to specify method factors; not surprisingly they failed to find good fit (McCrae et al., 1996. In contrast, models with method factors can have good fit (Schimmack, 2019a).

Other Problems in McCrae et al.’s Attempt

There are other problems with McCrae et al.’s (1996) conclusion that CFA cannot be used to test personality structure. First, the sample size was small for a rigorous study of personality structure with 30 observed variables (N = 229). Second, the evaluation of model fit was still evolving and some of the fit indices that they reported would be considered acceptable fit today. Most importantly, an exploratory Maximum Likelihood model produced reasonable fit, chi2/df = 1.57, RMS = .04, TLI = .92, CFI = .92. Their best fitting CFA model, however, did not fit the data. This merely shows a lack of effort and not the inability of fitting a CFA model to the 30 facets. In fact, McCrae et al. (1996) note “a long list of problems with the technique [SEM], ranging from technical difficulties in estimation
of some models to the cost in time and effort involved.” However, no science has made progress by choosing cheap and quick methods over costly and time-consuming methods simply because researchers lack the patients to learn a more complex method. I have been working on developing measurement models of personality for over a decade (Anusic et al., 2009). I am happy to demonstrate that it is possible to fit an SEM model to the Big Five data, to separate content variance from method variance, and to examine how big the Big Five factors really are.

The Data

One new development in psychology is that data are becoming more accessible and are openly shared. Low Goldberg has collected an amazing dataset of personality data with a sample from Oregon (the Eugene-Springfield community sample). The data are now publicly available at the Harvard Dataverse. With N = 857 participants the dataset is nearly four times larger than the dataset used by McCrae et al. (1996), and the ratio 857 observations and 30 variables (28:1) is considered good for structural equation modeling.

It is often advised to use different samples for exploration and then for cross-validation. However, I used the full sample for a mix of confirmation and exploration. The reason is that there is little doubt about the robustness of the data structure (the covariance/correlation matrix). The bigger issue is that a well-fitting model does not mean that it is the right model. Alternative models could also account for the same pattern of correlations. Cross-validation does not help with this bigger problem. The only way to address this is a systematic program of research that develops and tests different models. I see the present model as the beginning of such a line of research. Other researchers can use the same data to fit alternative models and they can use new data to test model assumptions. The goal is merely to boot a new era of research on the structure of personality with structural equation modeling, which could have started 20 years ago, if McCrae et al. (1996) had been more positive about the benefits of testing models and being able to falsify them (a.k.a. doing science).

Results

I started with a simple model that had five independent personality factors (the Big Five) and an evaluative bias factor. I did not include an acquiescence factor because facets are measured with scales that include reverse scored items. As a result, acquiescence bias is negligible (Schimmack, 2019a).

In the initial model facet loadings on the evaluative bias factor were fixed at 1 or -1 depending on the direction or desirability of a facet. This model had poor fit. I then modified the model by adding secondary loadings and by freeing loadings on the evaluative bias factor to allow for variation in desirability of facets. For example, although agreeableness is desirable, the loading for the modesty facet actually turned out to be negative. I finally added some correlated residuals to the model. The model was modified until it reached criteria of acceptable fit, CFI = .951, RMSEA = .044, SRMR = .034. The syntax and the complete results can be found on OSF (https://osf.io/23k8v/).

Table 3 shows the standardized loadings of the 30 facets on the Big Five and the two method factors.

There are several notable findings that challenge prevalent conceptions of personality.

The Big Five are not so big

First, the loadings of facets on the Big Five factors are notably weaker than in McCrae et al.’s Table 4 reproduced above (Table 2). There are two reasons for this discrepancy. First, often evaluative bias is shared between facets that belong to the same factor. For example, anxiety and depression have strong negative loadings on the evaluative bias factor. This shared bias will push up the correlation between the two facets and inflate factor loadings in a model without an evaluative bias factor. Another reason can be correlated residuals. If this extra shared variance is not modeled it pushes up loadings of these facets on the shared factor. The new and more accurate estimates in Table 3 suggest that the Big Five are not as big as the name implies. The loading of anxiety on neuroticism (r = .49) implies that only 25% of the variance in anxiety is captured by the neuroticism factor. Loadings greater than .71 are needed for a Big Five factor to explain more than 50% of the variance in a facet. There are only two facets where the majority of the variance in a facet is explained by a Big Five factor (order, self-discipline).

Secondary loadings can explain additional variance in some facets. For example, for anger/hostility neuroticism explains .48^2 = 23% of the variance and agreeableness explains another -.43^2 = 18% of the variance for a total of 23+18 = 41% explained variance. However, even with secondary loadings many facets have substantial residual variance. This is of course predicted by a hierarchical model of personality traits with more specific factors underneath the global Big Five traits. However, it also implies that Big Five measures fail to capture substantial personality variance. It is therefore not surprising that facet measures often predict additional variance in outcomes that it is not predicted by the Big Five (e.g., Schimmack, Oishi, Furr, & Funder, 2004). Personality researchers need to use facet level or other more specific measures of personality in addition to Big Five measures to capture all of the personality variance in outcomes.

What are the Big Five?

Factor loadings are often used to explore the constructs underlying factors. The terms neuroticism, extraversion, or openness are mere labels for the shared variance among facets with primary loadings on a factor. There has been some discussion about the Big Five factors and there meaning is still far from clear. For example, there has been a debate about the extraversion factor. Lucas, Diener, Grob, Suh, and Shao (2000) argued that extraversion is the disposition to respond strongly to rewards. Ashton, Lee, and Paunonen disagreed and argued that social attention underlies extraversion. Empirically it would be easy to answer these questions if one facet would show a very high loading on a Big Five factor. The more loadings approach one, the more a factor corresponds to a facet or is highly related to a facet. However, the loading pattern does not suggest that a single facet captures the meaning of a Big Five factor. The strongest relationship is found for self-discipline and conscientiousness. Thus, good self-regulation may be the core aspect of conscientiousness that also influences achievement striving or orderliness. However, more generally the results suggest that the nature of the Big Five factors is not obvious. It requires more work to uncover the glue that ties facets belonging to a single factor together. Theories range from linguistic structures to shared neurotransmitters.

Evaluative Bias

The results for evaluative bias are novel because previous studies failed to model evaluative bias in responses to the NEO-PI-R. It would be interesting to validate the variation in loadings on the evaluative bias factor with ratings of item- or facet-desirability. However, intuitively the variation makes sense. It is more desirable to be competent (C1, r = .66) and not depressed (N3, r = -69) than to be an excitement seeker (E5: r = .03) or compliant (A4: r = .09). The negative loading for modesty also makes sense and validates self-ratings of modesty (A5,r = -.33). Modest individuals are not supposed to exaggerate their desirable attributes and apparently they refrain from doing so also when they complete the NEO-PI-R.

Recently, McCrae (2018) acknowledged the presence of evaluative biases in NEO scores, but presented calculations that suggested the influence is relatively small. He suggested that facet-facet correlations might be inflated by .10 due to evaluative bias. However, this average is uninformative. It could imply that all facets have a loading of .33 or -.33 on the evaluative bias factor, which introduces a bias of .33*.33 = .10 or .33*-.33 = -.10 in facet-facet correlations. In fact, the average absolute loading on the evaluative bias factor is .30. However, this masks the fact that some facets have no evaluative bias and others have much more evaluative bias. For example, the measure of competence beliefs (self-effacy) C1 has a loading of .66 on the evaluative bias factor, which is higher than the loading on conscientiousness (.52). It should be noted that the NEO-PI-R is a commercial instrument and that it is in the interest of McCrae to claim that the NEO-PI-R is a valid measure for personalty assessment. In contrast, I have no commercial interest in finding more or less evaluative bias in the NEO-PI-R. This may explain the different conclusions about the practical significance of evaluative bias in NEO-PI-R scores.

In short, the present analysis suggests that the amount of evaluative bias varies across facet scales. While the influence of evaluative bias tends to be modest for many scales, scales with highly desirable traits show rather strong influence of evaluative bias. In the future it would be interesting to use multi-method data to separate evaluative bias from content variance (Anusic et al., 2009).

Measurement of the Big Five

Structural equation modeling can be used to test substantive theories with a measurement model or to develop and evaluate measurement models. Unfortunately, personality psychologists have not taken advantage of structural equation modeling to improve personality questionnaires. The present study highlights two ways in which SEM analysis of personality ratings is beneficial. First, it is possible to model evaluative bias and to search for items with low evaluative bias. Minimizing the influence of evaluative bias increases the validity of personality scales. Second, the present results can be used to create better measures of the Big Five. Many short Big Five scales focus exclusively on a single facet. As a result, these measures do not actually capture the Big Five. To measure the Big Five efficiently, a measure requires several facets with high loadings on the Big Five factor. Three facets are sufficient to create a latent variable model that separates the facet-specific residual variance from the shared variance that reflects the Big Five. Based on the present results, the following facets seem good candidates for the measurement of the Big Five.

Neuroticism: Anxiety, Anger, and Depression. The shared variance reflects a general tendency to respond with negative emotions.

Extraversion: Warmth, Gregariousness, Positive Emotions: The shared variance reflects a mix of sciability and cheerfulness.

Openness: Aesthetics, Action, Ideas. The shared variance reflects an interest in a broad range of activities that includes arts, intellectual stimulation, as well as travel.

Agreeableness: Straightforwardness, Altruism, Complicance: The shared variance represents respecting others.

Conscientiousness: Order, Self-Discipline, Dutifulness. I do not include achievement striving because it may be less consistent across the life span. The shared variance represents following a fixed set of rules.

This is of course just a suggestion. More research is needed. What is novel is the use of reflective measurement models to examine this question. McCrae et al. (1996) and some others before them tried and failed. Here I show that it is possible and useful to fit facet corelations with a structural equation model. Thus, twenty years after McCrae et al. suggested we should not use SEM/CFA, it is time to reconsider this claim and to reject it. Most personality theories are reflective models. It is time to test these models with the proper statistical method.

Personality and Self-Esteem

In the 1980s, personality psychologists agreed on the Big Five as a broad framework to describe and measure personality; that is, variation in psychological attributes across individuals.

You can think about the Big Five as a five-dimensional map. Like the two-dimensional map (or a three-dimensional globe), the Big Five are independent dimensions that create a space with coordinates that can be used to describe the vast number of psychological attributes that distinguish one person from another. One area of research in personality psychology is to correlate measures of personality attributes with Big Five measures to pinpoint their coordinates.

One important and frequently studied personality attribute is self-esteem, and dozens of studies have correlated self-esteem measures with Big Five measures. Robins, Tracy, and Trzesniewski (2001) reviewed some of these studies.

The results are robust and there is no worry about the replicability of these results. The strongest predictor of self-esteem is neuroticism vs. emotional stability. Self-esteem is located at the high end of neuroticism. The second predictor is extraversion vs. introversion. Self-esteem is located at the higher end of extraversion. The third predictor is conscientiousness which shows a slight positive location on the conscientious vs. careless dimension. Openness vs. closeness also shows a slight tendency towards openness. Finally, the results for agreeableness are more variable and show at least one negative correlation, but most correlations tend to be positive.

Evaluative Bias

Psychologists have a naive view of the validity of their measures. Although they sometimes compute reliability and examine convergent validity in methodological articles that are published in obscure journals like “Psychological Assessment,” they treat measures as perfectly valid in substantive articles that are published in journals like “Journal of Personality” or “Journal of Research in Personality.” Unfortunately, measurement problems can distort effect sizes and occasionally they can change the sign of a correlation.

Anusic et al. (2009) developed a measurement model for the Big Five that separates valid variance in the Big Five dimensions from rating biases. Rating biases can be content free (acquiescence) or respond to the desirability of items (halo, evaluative bias). They showed that evaluative bias can obscure the location of self-esteem in the Big Five space. Here, I revisit this question with better data that measure the Big Five with a measurement model fitted to the 44-items of the Big Five Inventory (Schimmack, 2019a).

I used the same data, which is the Canadian subsample of Gosling and colleagues large internet study that collects data from visitors who receive feedback about their personality. I simply added the single-item self-esteem measure to the dataset. I then fitted three different models. One model regressed the self-esteem item only on the Big Five dimensions. This model essentially replicates analyses with scale scores. I then added the method factors to the set of predictors.

NEOACEVBACQ
Self-Esteem M1-0.430.300.08-0.030.16
Self-Esteem M2-0.330.190.00-0.140.080.430.11

Results for the first model reproduce previous findings (see Table 1). However, results changed when the method factors were added. Most important, self-esteem is now placed on the negative side of agreeableness towards being more assertive. This makes sense given the selfless and other-focused nature of agreeableness. Agreeable people are less like to think about themselves and may subordinate their own needs to the needs of others. In contrast, people with high self-esteem are more likely to focus on themselves. Even though this is not a strong relationship, it is noteworthy that the relationship is negative rather than positive.

The other noteworthy finding is that evaluative bias is the strongest predictor of self-esteem. There are two interpretations of this finding and it is not clear which explanation accounts for this finding.

One interpretation is that self-esteem is rooted in a trait to see everything related to the self in an overly positive way. This interpretation implies that responses to personality items are driven by the desirability of items and individuals with high self-esteem see themselves as possessing all kinds of desirable attributes that they do not have (or have to a lesser degree). They think that they are kinder, smarter, funnier, and prettier than others, when they are actually not. In this way, the evaluative bias in personality ratings is an indirect measure of self-esteem.

The other interpretation is that evaluative bias is a rating bias that influences self-ratings, which includes self-ratings. Thus, the loading of the self-esteem item on the evaluative bias factor shows simply that self-esteem ratings are influenced by evaluative bias because self-esteem is a desirable attribute.

Disentangling these two interpretations requires the use of a multi-method approach. If evaluative bias is merely a rating bias, it should not correlated with actual life-outcomes. However, if evaluative bias reflects actual self-evaluations, it should be correlated with outcomes of high self-esteem.

Conclusion

Hopefully, this blog-post will create some awareness that personality psychology needs to move beyond the use of self-ratings in mapping the location of personality attributes in the Big Five space.

The blog post also has important implications for theories of personality development that assign value to personality dimensions (Dweck, 2008). Accordingly, the goal of personality development is to become more agreeable and conscientious and less neurotic among other things. However, I question that personality traits have intrinsic value. That is, agreeableness is not intrinsically good and low conscientiousness is not intrinsically bad. The presence of evaluative bias in personality items shows only that personality psychologists assign value to some traits and do not include items like “I am a clean-freak” in their questionnaires. Without a clear evaluation, there is no direction to personality change. Becoming more conscientious is no longer a sign of personal growth and maturation, but rather a change that may have positive or negative consequences for individuals. Although these issues can be debated, it is problematic that current models of personality development do not even question the evaluation of personality traits and treat the positive nature of some traits as a fundamental assumption that cannot be questioned. I suggest it is worthwhile to think about personality like sexual orientation or attractiveness. Although society has created strong evaluations that are hard to change, the goal should be to change these evaluations, not to change individuals to conform to these norms.

How Valid are Short Big-Five Scales?

The first measures of the Big Five used a large number of items to measure personality. This made it difficult to include personality measures in studies as the assessment of personality would take up all of the survey time. Over time, shorter scales became available. One important short Big Five measure is the BFI-S (Lang et al., 2011).  This 15-item measure has been used in several national representative, longitudinal studies such as the German Socio-Economic Panel (Schimmack, 2019a). These results provide unique insights into the stability of personality (Schimmack, 2019b) and the relationship of personality with other constructs such as life-satisfaction (Schimmack, 2019c). Some of these results overturn textbook claims about personality. However, critics argue that these results cannot be trusted because the BFI-S is an invalid measure of personality.

Thus, it is is critical importance to evaluate the validity of the BFI-S. Here I use Gosling and colleagues data to examine the validity of the BFI-S. Previously, I fitted a measurement model to the full 44-item BFI (Schimmack, 2019d). It is straightforward to evaluate the validity of the BFI-S by examining the correlation of the 3-item BFI-S scale scores with the latent factors based on all 44 BFI items. For comparison purposes, I also show the correlations for the BFI scale scores. The complete results for individual items are shown in the previous blog post (Schimmack, 2019d).

The measurement model for the BFS has seven independent factors. Five factors represent the Big Five and two factors represent method factors. One factor represents acquiescence bias. The other factor represents evaluative bias that is present in all self-ratings of personality (Anusic et al., 2009). As all factors are independent, the squared coefficients can be interpreted as the amount of variance that a factor explains in a scale score.

The results show that the BFI-S scales are nearly as valid as the longer BFI scales (Table 1).

Scale#ItemsNEOACEVBACQ
N-BFI80.79-0.08-0.01-0.05-0.02-0.420.05
N-BFI-S30.77-0.13-0.050.07-0.04-0.290.07
E-BFI8-0.020.830.04-0.050.000.440.06
E-BFI-S30.050.820.000.04-0.070.320.07
O-BFI100.04-0.030.76-0.04-0.050.360.19
O-BFI-S30.090.000.66-0.04-0.100.320.25
A-BFI9-0.070.00-0.070.780.030.440.04
A-BFI-S3-0.03-0.060.000.750.000.330.09
C-BFI9-0.050.00-0.050.040.820.420.03
C-BFI-S3-0.090.00-0.020.000.750.440.06

For example, the factor-scale correlations for neuroticism, extraversion, and agreeableness are nearly identical. The biggest difference was observed for openness with a correlation of r = .76 for the BFI-scale and r = .66 for the BFI-S scale. The only other notable systematic variance in scales is the evaluative bias influence which tends to be stronger for the longer scales with the exception of conscientiousness. In the future, measurement models with an evaluative bias factor can be used to select items with low loadings on the evaluative bias factor to reduce the influence of this bias on scale scores. Given these results, one would expect that the BFI and BFI-S produce similar results. The next analyses tested this prediction.

Gender Differences

I examined gender differences three ways. First, I examined standardized mean differences at the level of latent factors in a model with scalar invariance (Schimmack, 2019d). Second, I computed standardized mean differences with the BFI scales. Finally, I computed standardized mean differences with the BFI-S scales. Table 2 shows the results. Results for the BFI and BFI-S scales are very similar. The latent mean differences show somewhat larger differences for neuroticism and agreeablness because these mean differences are not attenuated by random measurement error. The latent means also show very small gender differences for the method factors. Thus, mean differences based on scale scores are not biased by method variance.

Table 2. Standardized Mean Differences between Men and Women

NEOACEVBACQ
Factor0.640.17-0.180.310.150.090.16
BFI0.450.14-0.100.200.14
BFI-S0.480.21-0.030.180.12

Note. Positive values indicate higher means for women than for men.

In short, there is no evidence that using 3-item scales invalidates the study of gender differences.

Age Differences

I demonstrated measurement invariance for different age groups (Schimmack, 2019d). Thus, I used simple correlations to examine the relationship between age and the Big Five. I restricted the age range from 17 to 70. Analyses of the full dataset suggest that older respondents have higher levels of conscientiousness and agreeableness (Soto, John, Gosling, & Potter, 2011).

Table 3 shows the results. The BFI and the BFI-S both show the predicted positive relationship with conscientiousness and the effect size is practically identical. The effect size for the latent variable model is stronger because the relationship is not attenuated by random measurement error. Other relationships are weaker and also consistent across measures except for Openness. The latent variable model reveals the reason for the discrepancies. Three items (#15 ingenious, #l35 like routine work, and #10 sophisticated in art) showed unique relationships with age. The art-related items showed a unique relationship with age. The latent factor does not include the unique content of these items and shows a positive relationship between openness and age. The scale scores include this content and show a weaker relationship. The positive relationship of openness with age for the latent factor is rather surprising as it is not found in nationally representative samples (Schimmack, 2019b). One possible explanation for this relationship is that older individuals who take an online personality test are more open.

NEOACEVBACQ
Factor-0.08-0.020.180.120.330.01-0.11
BFI-0.08-0.010.080.090.26
BFI-S-0.08-0.04-0.020.080.25

In sum, the most important finding is that the 3-item BFI-S conscientiousness scale shows the same relationship with age as the BFI-scale and the latent factor. Thus, the failure to find aging effects in the longitudinal SOEP data with the BFI-S cannot be attributed to the use of an invalid short measure of conscientiousness. The real scientific question is why the cross-sectional study by Soto et al. (2011) and my analysis of the longitudinal SOEP data show divergent results.

Conclusion

Science has changed since researchers are able to communicate and discuss research findings on social media. I strongly believe that open science outside of peer-controlled journals is beneficial for the advancement of science. However, the downside of social media of open science is that it becomes more difficult to evaluate expertise of online commentators. True experts are able to back up their claims with scientific evidence. This is what I did here. I showed that Brenton Wiernik’s comment has as much scientific validity as a Donald Trump tweet. Whatever the reason for the lack of personality change in the SOEP data will be, it is not the use of the BFI-S to measure the Big Five.

Measuring Personality in the SOEP

The German Socio-Economic-Panel (SOEP) is a longitudinal study of German households. The core questions address economic issues, work, health, and well-being. However, additional questions are sometimes added. In 2005, the SOEP included a 15-item measure of the Big Five; the so-called BFI-S (Lang et al., 2011). As each personality dimension is measured with only three items, scale scores are rather unreliable measures of the Big Five. A superior way to examine personality in the SOEP is to build a measurement model that relates observed item scores to latent factors that represent the Big Five.

Anusic et al. (2009) proposed a latent variable model for an English version of the BFI-S.

The most important feature of this model is the modeling of method factors in personality ratings. An acquiescence factor accounts for general response tendencies independent of item content. In addition, a halo factor accounts for evaluative bias that inflates correlations between two desirable or two undesirable items and attenuates correlations between a desirable and an undesirable item. The Figure shows that the halo factor is bias because it correlates highly with evaluative bias in ratings of intelligence and attractiveness.

The model also includes a higher-order factor that accounts for a correlation between extraversion and openness.

Since the article was published I have modified the model in two ways. First, the Big Five are conceptualized as fully independent which is in accordance with the original theory. Rather than allowing for correlations among Big Five factors, secondary loadings are used to allow for relationships between extraversion and openness items. Second, halo bias is modeled as a characteristic of individual items rather than the Big Five. This approach is preferable because some items have low loadings on halo.

Figure 2 shows the new model.

I fitted this model to the 2005 data using MPLUS (syntax and output: https://osf.io/vpcfd/ ). The model had acceptable fit to the data, CFI = .962, RMSEA = .035, SRMR = .029.

Table 1 shows the factor loadings. It also shows the correlation of the sum scores with the latent factors.

Item#NEOACEVBACQ
Neuroticism
worried50.49-0.020.19
nervous100.64-0.310.18
relaxed15-0.550.350.21
SUM0.750.000.000.000.00-0.300.09
Extraversion
talkative20.600.130.400.23
sociable80.640.370.22
reserved12-0.520.20-0.110.19
SUM0.000.750.00-0.100.050.360.09
Openess
original40.260.41-0.330.380.22
artistic90.150.360.290.17
imaginative140.300.550.220.21
SUM0.000.300.57-0.130.000.390.26
Agreeableness
rude30.12-0.51-0.320.19
forgiving60.230.320.24
considerate130.490.480.29
SUM0.00-0.070.000.580.000.500.11
Conscientiousness
thorough10.710.350.30
lazy7-0.16-0.41-0.350.20
efficient110.390.480.28
SUM0.000.000.000.090.640.510.11

The results show that all items load on their primary factor although some loadings are very small (e.g., forgiving). Secondary loadings tend to be small (< .2), although they are highly significant in the large sample. All items load on the evaluative bias factor, with some fairly large loadings for considerate, efficient, and talkative. Reserved is the most evaluatively neutral item. Acquiescence bias is rather weak.

The scale scores are most strongly related to the intended latent factor. The relationship is fairly strong for neuroticism and extraversion, suggesting that about 50% of the variance in scale scores reflects the intended construct. However, for the other three dimensions, correlations suggest that less than 50% of the variance reflects the intended construct. Moreover, the remaining variance is not just random measurement error. Evaluative bias contributes from 10% up to 25% of additional variance. Acquiescence bias plays a minor role because most scales have a reverse scored item. Openness is an exception and acquiescence bias contributes 10% of the variance in scores on the Openness scale.

Given the good fit of this model, I recommend it for studies that want to examine correlates of the Big Five or that want to compare groups. Using this model will produce better estimates of effect sizes and control for spurious relationships due to method factors.