Correction (8/31/2019): In an earlier version, I misspelled Colin DeYoung’s name. I wrote DeYoung with a small d. I thank Colin DeYoung for pointing out this mistake.
Introduction
One area of personality psychology aims to classify personality traits. I compare this activity to research in biology where organisms are classified into a large taxonomy.

In a hiearchical taxnomy, the higher levels are more abstract, less descriptive, but also comprise a larger group of items. For example, there are more mammals (class) than dogs (species).
in the 1980s, personality psychologists agreed on the Big Five. The Big Five represent a rather abstract level of description that combines many distinct traits into traits that are predominantly related to one of the Big Five dimensions. For example, talkative falls into the extraversion group.
To illustrate the level of abstraction, we can compare the Big Five to the levels in biology. After distinguishing vertebrate and invertebrate animals, there are five classes of vertebrate animals: mammals, fish, reptiles, birds, and amphibians). This suggests that the Big Five are a fairly high level of abstraction that cover a broad range of distinct traits within each dimension.
The Big Five were found using factor or pincipal component analysis (PCA). PCA is a methematical method that reduces the covariances among personality ratings to a smaller number of factors. The goal of PCA is to capture as much of the variance as possible with the smallest number of components. Evidently there is a trade-off. However, often the first components account for most of the variance while additional components add very little additional information. Using various criteria, five components seemed to account for most of the variance in personality ratings and the first five components could be identified in different datasets. So, the Big Five were born.
One important feature of PCA is that the components are independent (orthogonal). This is helpful to maximize the information that is captured with five dimensions. If the five dimensions would correlated, they would present overlapping variances and this redundancy would reduce the amount of explained variance. Thus, the Big Five are conceptually independent because they were discovered with a method that enforced independence.
Scale Scores are not Factors
While principal component analysis is useful to classify personality traits, it is not useful to do basic research on the causes and consequences of personality. For this purpose, personality psychologists create scales. Scales are usually created by summing items that belong to a common factor. For example, responses to the items “talkative,” “sociable,” and “reserved” are added up to create an extraversion score. Ratings of the item “reserved” are reversed so that higher scores reflect extraversion. Importantly, sum scores are only proxies of the components or factors that were identified in a factor analysis or a PCA. Thus, we need to distinguish between extraversion-factors and extraversion-scales. They are not the same thing. Unfortunately, personality psychologists often treat scales as if they were identical with factors.
Big Five Scales are not Independent
Now something strange happened when personalty psychologists examined the correlations among Big Five SCALES. Unlike the factors that were independent by design, Big Five Scales were not independent. Moreover, the correlations among Big Five scales were not random. Digman (1997) was the first to examine these correlations. The article has garnered over 800 citations.
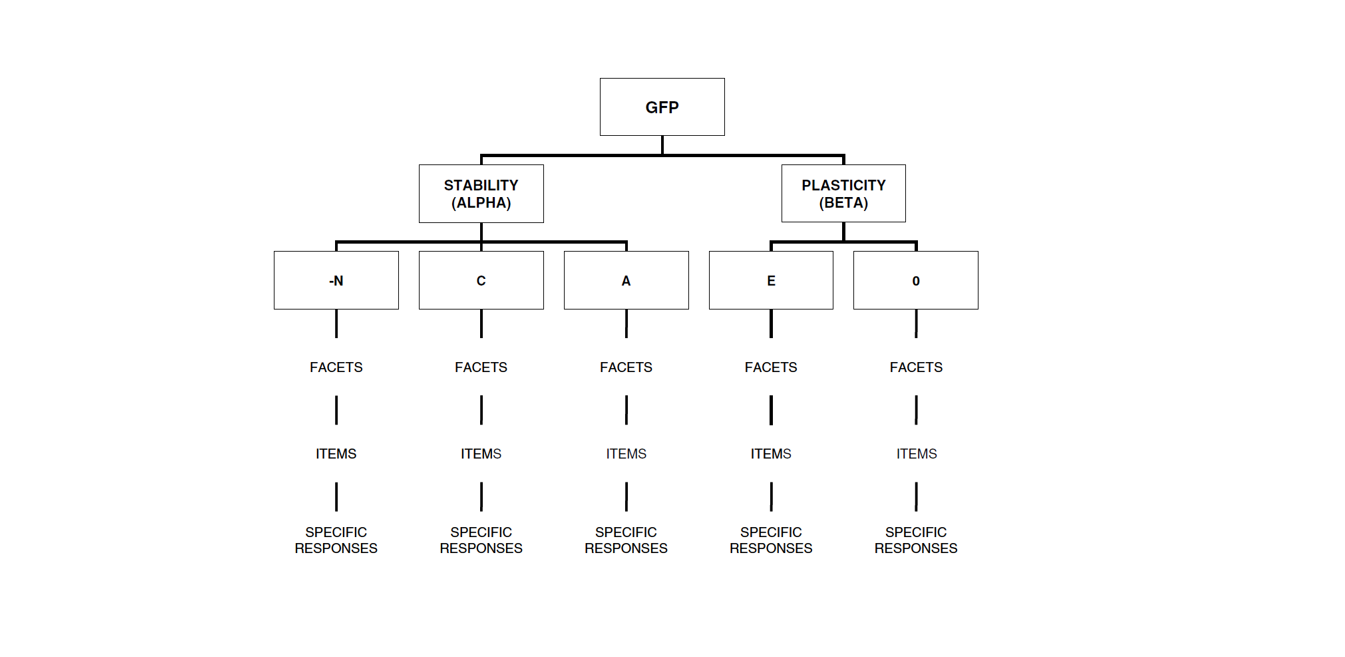
Digman examined these correlations conducted another principal component analysis of the correlations. He found two factors. One factor for extraversion and openesss and the other factor for agreeableness and conscientiousness (and maybe low neuroticism). He proposed that these two factors represent an even higher level in a hierarchy of personality traits. Maybe like moving from the level of classess (mammals, fish, reptiles) to the level Phylum; a level that is so abstract that few people who are not biologists are familiar with.
Digman’s article stimulated further research on higher-order factors of personality, where higher means even higher than the Big Five, which are already at a fairly high level of abstraction. Nobody stopped to wonder how there could be higher-order factors if the Big Five are actually independent factors, and why Big Five scales show systematic correlations that were not present in factor analyses.
Instead personality psychologists speculated about the biological underpinning of the higher order factors. For example, Jordan B. Peterson (yes, them) and colleagues proposed that serotonin is related to higher stability (high agreeableness, high conscientiousness, and low neuroticism) (DeYoung, Peterson, and Higgins, 2002).


Rather than interpreting this finding as evidence that response tendencies contribute to correlations among Big Five scales, they interpreted this finding as a substantive finding about personality, society in the context of psychodynamic theories.

Only a few years later, separated from the influence of his advisor, DeYoung (2006) published a more reasonable article that used a multi-method approach to separate personality variance from method variance. This article provided strong evidence that a general evaluative bias (social desirable responding) contributes to correlations among Big Five Scales, which was formalized in Anusic et al.’s (200) model with an explicit evaluative bias (halo) factor.
However, the idea of higher-order factors was sustained by finding cross-method correlations that were consistent with the higher-order model.

After battling Colin as a reviewer, when we submitted a manuscript on halo bias in personality ratings, we finally were able to publish a compromise model that also included the higher order factors (stability/alpha; plasticity/beta), although we had problems identifying the alpha factor in some datasets.

The Big Mistake
Meanwhile, another article built on the 2002 model that did not control for rating biases and proposed that the correlation between the two higher-order factors implies that there is an even higher level in the hierarchy. The Big Trait of Personality makes people actually have more desirable personalities; They are less neurotic, more sociable, open, agreeable, and conscientious. Who wouldn’t want one of them as a spouse or friend? However, the 2006 article by DeYoung showed that the Big One only exists in the imagination of individuals and is not shared with perceptions by others. This finding was replicated in several datasets by Anusic et al. (2009).
Although claims about the Big One were already invalidated when the article was published, it appealed to some personality psychologists. In particular, white supremacist Phillip Rushton found the idea of a generally good personality very attractive and spend the rest of his life promoting it (Rushton & Irving, 2011; Rushton Bons, & Hur, 2008). He never realized the distinction between a personality factor, which is a latent construct, and a personality scale, which is the manifest sum-score of some personality items, and ignored DeYoung’s (2006) and other (Anusic et al., 2009) evidence that the evaluative portion in personality ratings is a rating bias and not substantive covariance among the Big Five traits.
Peterson and Rushton are examples of pseudo-science that mixes some empirical findings with grand ideas about human nature that are only loosely related. Fortunately, interest in the general factor of personality seems to be decreasing.
Higher Order Factors or Secondary Loadings?
Ashton, Lee, Goldberg, and deVries (2009) put some cold water on the idea of higher-order factors. They pointed out that correlations between Big Five Scales may result from secondary loadings of items on Big Five Factors. For example, the item adventurous may load on extraversion and openness. If the item is used to create an extraversion scale, the openness and extraversion scale will be positively correlated.
As it turns out, it is always possible to model the Big Five as independent factors with secondary loadings to avoid correlations among factors. After all, this is how exploratory factor analysis or PCA are able to account for correlations among personality items with independent factors or components. In an EFA, all items have secondary loadings on all factors, although some of these correlations may be small.
There are only two ways to distinguish empirically between a higher-order model and a secondary-loading model. One solution is to obtain measures of the actual causes of personality (e.g., genetic markers, shared environment factors, etc.) If there are higher order factors, some of the causes should influence more than one Big Five dimension. The problem is that it has been difficult to identify causes of personality traits.
The second approach is to examine the number of secondary loadings. If all openness items load on extraversion in the same direction (e.g., adventurous, interest in arts, interest in complex issues), it suggests that there is a real common cause. However, if secondary loadings are unique to one item (adventurous), it suggests that the general factors are independent. This is by no means a definitive test of the structure of personality, but it is instructive to examine how many items from one trait have secondary loadings on another trait. Even more informative would be the use of facet-scales rather than individual items.
I have examined this question in two datasets. One dataset is an online sample with items from the IPIP-100 (Johnson). The other dataset is an online sample with the BFI (Gosling and colleagues). The factor loading matrices have been published in separate blog posts and the syntax and complete results have been posted on OSF (Schimmack, 2019b; 2019c).
IPIP-100
Neuroticism items show 8 out of 16 secondary loadings on agreeableness, and 4 out of 16 secondary loadings on conscientiousnes.
| Item# | N | E | O | A | C | EVB | ACQ | |
| Neuroticism | ||||||||
| easily disturbed | 3 | 0.44 | -0.25 | |||||
| not easily bothered | 10 | -0.58 | -0.12 | -0.11 | 0.25 | |||
| relaxed most of the time | 17 | -0.61 | 0.19 | -0.17 | 0.27 | |||
| change my mood a lot | 25 | 0.55 | -0.15 | -0.24 | ||||
| feel easily threatened | 37 | 0.50 | -0.25 | |||||
| get angry easily | 41 | 0.50 | -0.13 | |||||
| get caught up in my problems | 42 | 0.56 | 0.13 | |||||
| get irritated easily | 44 | 0.53 | -0.13 | |||||
| get overwhelmed by emotions | 45 | 0.62 | 0.30 | |||||
| stress out easily | 46 | 0.69 | 0.11 | |||||
| frequent mood swings | 56 | 0.59 | -0.10 | |||||
| often feel blue | 77 | 0.54 | -0.27 | -0.12 | ||||
| panic easily | 80 | 0.56 | 0.14 | |||||
| rarely get irritated | 82 | -0.52 | ||||||
| seldom feel blue | 83 | -0.41 | 0.12 | |||||
| take offense easily | 91 | 0.53 | ||||||
| worry about things | 100 | 0.57 | 0.21 | 0.09 | ||||
| SUM | 0.83 | -0.05 | 0.00 | 0.07 | -0.02 | -0.38 | 0.12 |
Agreeableness items show only one secondary loading on conscientiousness and one on neuroticism.
| Agreeableness | ||||||||
| indifferent to feelings of others | 8 | -0.58 | -0.27 | 0.16 | ||||
| not interested in others’ problems | 12 | -0.58 | -0.26 | 0.15 | ||||
| feel little concern for others | 35 | -0.58 | -0.27 | 0.18 | ||||
| feel others’ emotions | 36 | 0.60 | 0.22 | 0.17 | ||||
| have a good word for everybody | 49 | 0.59 | 0.10 | 0.17 | ||||
| have a soft heart | 51 | 0.42 | 0.29 | 0.17 | ||||
| inquire about others’ well-being | 58 | 0.62 | 0.32 | 0.19 | ||||
| insult people | 59 | 0.19 | 0.12 | -0.32 | -0.18 | -0.25 | 0.15 | |
| know how to comforte others | 62 | 0.26 | 0.48 | 0.28 | 0.17 | |||
| love to help others | 69 | 0.14 | 0.64 | 0.33 | 0.19 | |||
| sympathize with others’ feelings | 89 | 0.74 | 0.30 | 0.18 | ||||
| take time out for others | 92 | 0.53 | 0.32 | 0.19 | ||||
| think of others first | 94 | 0.61 | 0.29 | 0.17 | ||||
| SUM | -0.03 | 0.07 | 0.02 | 0.84 | 0.03 | 0.41 | 0.09 |
Finally, conscientiousness items show only one secondary loading on agreeableness.
| Conscientiousness | ||||||||
| always prepared | 2 | 0.62 | 0.28 | 0.17 | ||||
| exacting in my work | 4 | -0.09 | 0.38 | 0.29 | 0.17 | |||
| continue until everything is perfect | 26 | 0.14 | 0.49 | 0.13 | 0.16 | |||
| do things according to a plan | 28 | 0.65 | -0.45 | 0.17 | ||||
| do things in a half-way manner | 29 | -0.49 | -0.40 | 0.16 | ||||
| find it difficult to get down to work | 39 | 0.09 | -0.48 | -0.40 | 0.14 | |||
| follow a schedule | 40 | 0.65 | 0.07 | 0.14 | ||||
| get chores done right away | 43 | 0.54 | 0.24 | 0.14 | ||||
| leave a mess in my room | 63 | -0.49 | -0.21 | 0.12 | ||||
| leave my belongings around | 64 | -0.50 | -0.08 | 0.13 | ||||
| like order | 65 | 0.64 | -0.07 | 0.16 | ||||
| like to tidy up | 66 | 0.19 | 0.52 | 0.12 | 0.14 | |||
| love order and regularity | 68 | 0.15 | 0.68 | -0.19 | 0.15 | |||
| make a mess of things | 72 | 0.21 | -0.50 | -0.26 | 0.15 | |||
| make plans and stick to them | 75 | 0.52 | 0.28 | 0.17 | ||||
| neglect my duties | 76 | -0.55 | -0.45 | 0.16 | ||||
| forget to put things back | 79 | -0.52 | -0.22 | 0.13 | ||||
| shirk my duties | 85 | -0.45 | -0.40 | 0.16 | ||||
| waste my time | 98 | -0.49 | -0.46 | 0.14 | ||||
| SUM | -0.03 | -0.01 | 0.01 | 0.03 | 0.84 | 0.36 | 0.00 |
Of course, there could be additional relationships that are masked by fixing most secondary loadings to zero. However, it also matters how strong the secondary loadings are. Weak secondary loadings will produce weak correlations among Big Five scales. Even the secondary loadings in the model are weak. Thus, there is little evidence that neuroticism, agreeableness, and conscientiousness items are all systematically related as predicted by a higher-order model. At best, the data suggest that neuroticism has a negative influence on agreeable behaviors. That is, people differ in their altruism, but agreeable neurotic people are less agreeable when they are in a bad mood.
Results for extraversion and openness are similar. Only one extraversion item loads on openness.
| Extraversion | ||||||||
| hard to get to know | 7 | -0.45 | -0.23 | 0.13 | ||||
| quiet around strangers | 16 | -0.65 | -0.24 | 0.14 | ||||
| skilled handling social situations | 18 | 0.65 | 0.13 | 0.39 | 0.15 | |||
| am life of the party | 19 | 0.64 | 0.16 | 0.14 | ||||
| don’t like drawing attention to self | 30 | -0.54 | 0.13 | -0.14 | 0.15 | |||
| don’t mind being center of attention | 31 | 0.56 | 0.23 | 0.13 | ||||
| don’t talk a lot | 32 | -0.68 | 0.23 | 0.13 | ||||
| feel at ease with people | 33 | -0.20 | 0.64 | 0.16 | 0.35 | 0.16 | ||
| feel comfortable around others | 34 | -0.23 | 0.65 | 0.15 | 0.27 | 0.16 | ||
| find it difficult to approach others | 38 | -0.60 | -0.40 | 0.16 | ||||
| have little to say | 57 | -0.14 | -0.52 | -0.25 | 0.14 | |||
| keep in the background | 60 | -0.69 | -0.25 | 0.15 | ||||
| know how to captivate people | 61 | 0.49 | 0.29 | 0.28 | 0.16 | |||
| make friends easily | 73 | -0.10 | 0.66 | 0.14 | 0.25 | 0.15 | ||
| feel uncomfortable around others | 78 | 0.22 | -0.64 | -0.24 | 0.14 | |||
| start conversations | 88 | 0.70 | 0.12 | 0.27 | 0.16 | |||
| talk to different people at parties | 93 | 0.72 | 0.22 | 0.13 | ||||
| SUM | -0.04 | 0.88 | 0.02 | 0.06 | -0.02 | 0.37 | 0.01 |
And only one extraversion item loads on openness and this loading is in the opposite direction from the prediction by the higher-order model. While open people tend to like reading challenging materials, extraverts do not.
| Openness | ||||||||
| full of ideas | 5 | 0.65 | 0.32 | 0.19 | ||||
| not interested in abstract ideas | 11 | -0.46 | -0.27 | 0.16 | ||||
| do not have good imagination | 27 | -0.45 | -0.19 | 0.16 | ||||
| have rich vocabulary | 50 | 0.52 | 0.11 | 0.18 | ||||
| have a vivid imagination | 52 | 0.41 | -0.11 | 0.28 | 0.16 | |||
| have difficulty imagining things | 53 | -0.48 | -0.31 | 0.18 | ||||
| difficulty understanding abstract ideas | 54 | 0.11 | -0.48 | -0.28 | 0.16 | |||
| have excellent ideas | 55 | 0.53 | -0.09 | 0.37 | 0.22 | |||
| love to read challenging materials | 70 | -0.18 | 0.40 | 0.23 | 0.14 | |||
| love to think up new ways | 71 | 0.51 | 0.30 | 0.18 | ||||
| SUM | -0.02 | -0.04 | 0.75 | -0.01 | -0.02 | 0.40 | 0.09 |
The next table shows the correlations among the Big Five SCALES.
| Scale Correlations | N | E | O | A | C |
| Neuroticism (N) | – | ||||
| Extraversion (E) | -0.21 | – | |||
| Openness (O) | -0.16 | 0.13 | – | ||
| Agreeableness (A) | -0.13 | 0.27 | 0.17 | – | |
| Conscientiousness (C) | -0.17 | 0.11 | 0.14 | 0.20 | – |
The pattern mostly reflects the influence of the evaluative bias factor that produces negative correlations of neuroticism with the other scales and positive correlations among the other scales. There is no evidence that extraversion and openness are more strongly correlated in the IPIP-100. Overall, these results are rather disappointing for higher-order theorists.
The next table shows the correlations among the Big Five Scales.
| Scale Correlations | N | E | O | A | C |
| Neuroticism (N) | – | ||||
| Extraversion (E) | -0.21 | – | |||
| Openness (O) | -0.16 | 0.13 | – | ||
| Agreeableness (A) | -0.13 | 0.27 | 0.17 | – | |
| Conscientiousness (C) | -0.17 | 0.11 | 0.14 | 0.20 | – |
The pattern of correlations reflects mostly the influence of the evaluative bias factor. As a result, the neuorticism scale is negatively correlated with the other scales and the other scales are positively correlated with each other. There is no evidence for a stronger correlation between extraversion and openness because there are no notable secondary loadings. There is also no evidence that agreeableness and conscientiousness are more strongly related to neuroticism. Thus, these results show that DeYoung’s (2006) higher-order model is not consistent across different Big Five questionnaires.
Big Five Inventory
DeYoung found the higher-order factors with the Big Five Inventory. Thus, it is particularly interesting to examine the secondary loadings in a measurement model with independent Big Five factors (Schimmack, 2019b).
Neuroticism items have only one secondary loading on agreeableness and one on conscientiousness and the magnitude of these loadings is small.
| Item# | N | E | O | A | C | EVB | ACQ | |
| Neuroticism | ||||||||
| depressed/blue | 4 | 0.33 | -0.15 | 0.20 | -0.48 | 0.06 | ||
| relaxed | 9 | -0.72 | 0.23 | 0.18 | ||||
| tense | 14 | 0.51 | -0.25 | 0.20 | ||||
| worry | 19 | 0.60 | -0.08 | 0.07 | -0.21 | 0.17 | ||
| emotionally stable | 24 | -0.61 | 0.27 | 0.18 | ||||
| moody | 29 | 0.43 | -0.33 | 0.18 | ||||
| calm | 34 | -0.58 | -0.04 | -0.14 | -0.12 | 0.25 | 0.20 | |
| nervous | 39 | 0.52 | -0.25 | 0.17 | ||||
| SUM | 0.79 | -0.08 | -0.01 | -0.05 | -0.02 | -0.42 | 0.05 |
Four out of nine agreeableness items have secondary loadings on neuroticism, but the magnitude of these loadings is small. Four items also have loadings on conscientiousness, but one item (forgiving) has a loading opposite to the one predicted by the hgher-order model.
| Agreeableness | ||||||||
| find faults w. others | 2 | 0.15 | -0.42 | -0.24 | 0.19 | |||
| helpful / unselfish | 7 | 0.44 | 0.10 | 0.29 | 0.23 | |||
| start quarrels | 12 | 0.13 | 0.20 | -0.50 | -0.09 | -0.24 | 0.19 | |
| forgiving | 17 | 0.47 | -0.14 | 0.24 | 0.19 | |||
| trusting | 22 | 0.15 | 0.33 | 0.26 | 0.20 | |||
| cold and aloof | 27 | -0.19 | 0.14 | -0.46 | -0.35 | 0.17 | ||
| considerate and kind | 32 | 0.04 | 0.62 | 0.29 | 0.23 | |||
| rude | 37 | 0.09 | 0.12 | -0.63 | -0.13 | -0.23 | 0.18 | |
| like to cooperate | 42 | 0.15 | -0.10 | 0.44 | 0.28 | 0.22 | ||
| SUM | -0.07 | 0.00 | -0.07 | 0.78 | 0.03 | 0.44 | 0.04 |
For conscientiousness, only two items have a secondary loading on neuroticism and two items have a secondary loading on agreeableness.
| Conscientiousness | ||||||||
| thorough job | 3 | 0.59 | 0.28 | 0.22 | ||||
| careless | 8 | -0.17 | -0.51 | -0.23 | 0.18 | |||
| reliable worker | 13 | -0.09 | 0.09 | 0.55 | 0.30 | 0.24 | ||
| disorganized | 18 | 0.15 | -0.59 | -0.20 | 0.16 | |||
| lazy | 23 | -0.52 | -0.45 | 0.17 | ||||
| persevere until finished | 28 | 0.56 | 0.26 | 0.20 | ||||
| efficient | 33 | -0.09 | 0.56 | 0.30 | 0.23 | |||
| follow plans | 38 | 0.10 | -0.06 | 0.46 | 0.26 | 0.20 | ||
| easily distracted | 43 | 0.19 | 0.09 | -0.52 | -0.22 | 0.17 | ||
| SUM | -0.05 | 0.00 | -0.05 | 0.04 | 0.82 | 0.42 | 0.03 |
Overall, these results provide no support for the higher-order model that predicts correlations among all neuroticism, agreeableness, and conscientiousness items. These results are also consistent with Anusic et al.’s (2009) difficulty of identifying the alpha/stability factor in a study with the BFI-S, a shorter version of the BFI.
However, Anusic et al. (2009) did find a beta-factor with BFI-S scales. The present analysis of the BFI do not replicate this finding. Only two extraversion items have small loadings on the openness factor.
| Extraversion | ||||||||
| talkative | 1 | 0.13 | 0.70 | -0.07 | 0.23 | 0.18 | ||
| reserved | 6 | -0.58 | 0.09 | -0.21 | 0.18 | |||
| full of energy | 11 | 0.34 | -0.11 | 0.58 | 0.20 | |||
| generate enthusiasm | 16 | 0.07 | 0.44 | 0.11 | 0.50 | 0.20 | ||
| quiet | 21 | -0.81 | 0.04 | -0.21 | 0.17 | |||
| assertive | 26 | -0.09 | 0.40 | 0.14 | -0.24 | 0.18 | 0.24 | 0.19 |
| shy and inhibited | 31 | 0.18 | 0.64 | -0.22 | 0.17 | |||
| outgoing | 36 | 0.72 | 0.09 | 0.35 | 0.18 |
And only one openness item has a small loading that is opposite to the predicted direction. Extraverts are less likely to like reflecting.
| Openness | ||||||||
| original | 5 | 0.53 | -0.11 | 0.38 | 0.21 | |||
| curious | 10 | 0.41 | -0.07 | 0.31 | 0.24 | |||
| ingenious | 15 | 0.57 | 0.09 | 0.21 | ||||
| active imagination | 20 | 0.13 | 0.53 | -0.17 | 0.27 | 0.21 | ||
| inventive | 25 | -0.09 | 0.54 | -0.10 | 0.34 | 0.20 | ||
| value art | 30 | 0.12 | 0.46 | 0.09 | 0.16 | 0.18 | ||
| like routine work | 35 | -0.28 | 0.10 | 0.13 | -0.21 | 0.17 | ||
| like reflecting | 40 | -0.08 | 0.58 | 0.27 | 0.21 | |||
| few artistic interests | 41 | -0.26 | -0.09 | 0.15 | ||||
| sophisticated in art | 44 | 0.07 | 0.44 | -0.06 | 0.10 | 0.16 | ||
| SUM | 0.04 | -0.03 | 0.76 | -0.04 | -0.05 | 0.36 | 0.19 |
In short, there is no support for the presence of a higher-order factor that produces overlap between extraversion and openness.
The pattern of correlations among the BFI scales, however, might suggest that there is an alpha factor because neuroticism, agreeableness and conscientiousness tend to be more strongly correlated with each other than with other dimensions. This shows the problem of using scales to study higher-order factors. However, there is no evidence for a higher-order factor that combines extraversion and openness as the correlation between these traits is an unremarkable r = .18.
| Scale Correlations | N | E | O | A | C |
| Neuroticism (N) | – | ||||
| Extraversion (E) | -0.26 | – | |||
| Openness (O) | -0.11 | 0.18 | – | ||
| Agreeableness (A) | -0.28 | 0.16 | 0.08 | – | |
| Conscientiousness (C) | -0.23 | 0.18 | 0.07 | 0.25 | – |
So, why did DeYoung (2006) find evidence for higher-order factors? One possible explanation is that BFI scale correlations are not consistent across different samples. The next table shows the self-report correlations from DeYoung (2006) below the diagonal and discrepancies above the diagonal. Three of the four theoretically important correlations tend to be stronger in DeYoung’s (2006) data. It is therefore possible that the secondary loading pattern differs across the two datasets. It would be interesting to fit an item-level model to DeYoung’s data to explore this issue further.
| Scale Correlations | N | E | O | A | C |
| Neuroticism (N) | – | 0.10 | 0.03 | -0.06 | -0.08 |
| Extraversion (E) | -0.16 | – | 0.07 | 0.01 | 0.03 |
| Openness (O) | -0.08 | 0.25 | – | -0.02 | 0.02 |
| Agreeableness (A) | -0.36 | 0.15 | 0.06 | – | -0.01 |
| Conscientiousness (C) | -0.31 | 0.21 | 0.09 | 0.24 | – |
In conclusion, an analysis of the BFI also does not support the higher-order model. However, results seem to be inconsistent across different samples. While this suggests that more research is needed, it is clear that this research needs to model personality at the level of items and not with scale scores that are contaminated by evaluative bias and secondary loadings.
Conclusion
Hindsight is 20/20 and after 20 years of research on higher-order factors a lot of this research looks silly. How could there be higher order factors for the Big Five factors if the Big Five are independent factors (or components) by default. The search for higher-order factors with Big Five scales can be attributed to methodological limitations, although higher-order models with structural equation modeling have been around since the 1980. It is rather obvious that scale scores are impure measures and that correlations among scales are influenced by secondary loadings. However, even when this fact was pointed out by Ashton et al. (2009), it was ignored. The problem is mainly due to the lack of proper training in methods. Here the problem is the use of scales as indicators of factors, when scales introduce measurement error and higher-order factors are method artifacts.
The fact that it is possible to recover independent Big Five factors from questionnaires that were designed to measure five independent dimensions says nothing about the validity of the Big Five model. To examine the validity of the Big Five as a valid model of the highest level in a taxonomy of personality trait it is important to examine the relationship of the Big Five with the diverse population of personality traits. This is an important area of research that could also benefit from proper measurement models. This post merely focused on the search for higher order factors for the Big Five and showed that searching for higher-order factors of independent factors is a futile endeavor that only leads to wild speculations that are not based on empirical evidence (Peterson, Rushton).
Even DeYoung and Peterson seems to have realized that it is more important to examine the structure of personality below rather than above the Big Five (DeYoung, Quility, & Peterson, 2007) . Whether 10 aspects, 16 factors (Cattell) or 30 facets (Costa & McCrae) represent another meaningful level in a hierarchical model of personality traits remains to be examined. Removing method variance and taking secondary loadings into account will be important to separate valid variance from noise. Also, factor analysis is superior to principle component analysis unless the goal is simply to describe personality with atheoretical components that capture as much variance as possible.
Correct me if you can
This blog post is essentially a scientific article without peer-review. I prefer this mode of communication over submitting manuscript to traditional journals where a few reviewers have the power to prevent research from being published. This happened with a manuscript that Ivana Anusic and I submitted and that was killed by Colin DeYoung as a reviewer. I prefer open reviews and I invite Colin to write an open review of this “article.” I am happy to be corrected and any constructive comments would be a welcome contribution to advancing personality science. Simply squashing critical work so that nobody gets to see it is not advancing science. The new way of conducting open science with open submissions, open reviews is the way to go. Of course, others are also invited to engage in the debate. So, let’s start a debate with the thesis “Higher-order factors of the Big Five do not exist.”
Uli, I’ve always had respect for your work, but at the same time I’m wary of engaging with you in a public forum because you’re a bit challenged in the civility department. Nonetheless, I’ll make an effort, and anyway I would never use your abrasive interpersonal style to attempt to discredit your intellectual arguments. Before I get to those arguments (in my next comment) let me make a few observations and requests about the style of your post.
First, would you please change the spelling of my name throughout so that it’s correct? The initial “d” should be capitalized, “DeYoung.”
Second, would you please change the title to something that doesn’t insinuate that someone who comes to a different conclusion than you must be on drugs?
Third, please cite Musek in the following sentence of yours: “Meanwhile, another article built on the 2002 model that did not control for rating biases and proposed that the correlation between the two higher-order factors implies that there is an even higher level in the hierarchy.” I agree with you that his approach and conclusion were misguided from the start, but that doesn’t mean you should fail to cite him: Musek, J. (2007). A general factor of personality: Evidence for the Big One in the five-factor model. Journal of Research in Personality, 41(6), 1213-1233.
You should probably also cite the following article that’s a meta-analysis of the existence of the two higher-order factors in multi-informant studies. I appreciate the positive things you’ve said about my 2006 article, but this one provided much more extensive evidence to address most of the same questions: Chang, L., Connelly, B. S., & Geeza, A. A. (2012). Separating method factors and higher order traits of the Big Five: A meta-analytic multitrait–multimethod approach. Journal of personality and social psychology, 102(2), 408.
Fourth, a minor quibble: as a reviewer, I certainly never had the power to “kill” one of your manuscripts. If the editor killed it, perhaps it was because he agreed with whatever arguments I made in my review. Further, I don’t remember reviewing one of your papers that was ultimately rejected. I remember reviewing the paper that eventually turned into your 2009 JPSP “Halo-Alpha-Beta Model” paper, which you still seem pleased with. In fact, you may recall that I was the one who suggested something like that model in the first place. Perhaps you were referring to my “killing” the initial version of that manuscript, which used an odd cluster-based approach with dichotomized Big Five variables to make a similar argument about the presence of halo bias in personality assessments. In response to that manuscript, I suggested that a better approach would be to model halo bias and Digman’s two higher-order factors simultaneously. You know what? This will be easier if I just post my reviews of both your original submission and your revision. Then readers of your blog will be able to see exactly what this “battle” with me was like:
Review of your original submission:
“This article investigated patterns of correlation among the Big Five. The typological approach taken here is quite interesting. As the authors note, the loss of information due to dichotomous scoring is probably compensated by the ability to examine interactive effects among traits more easily and to determine whether positive biases are more common than negative biases. Nonetheless, the main results (that the two evaluatively consistent types, Neoac and nEOAC, are over-represented) do not seem very different from a demonstration that there is a large first factor within single-informant ratings of the Big Five, on which all five traits load (e.g., Musek, 2007, JRP), or that the higher-order factors of the Big Five are correlated in single-informant ratings (e.g., DeYoung et al., 2002), or that in a multi-informant model variance in the Big Five unique to each informant is best represented by strongly correlated factors (DeYoung, 2006). All of these findings point to the halo effect. This article may be valuable as another demonstration of that effect – the addition of the bias measure in Study 4 is a nice touch – but demonstrating the halo effect is not novel, and, as the authors rightly note in their introduction, their work does not rule out the possibility that some genuine correlations exist among the Big Five alongside the halo effect. I doubt that this article is likely to have a strong impact on the field.
“Additionally, there is a discrepancy between the relatively modest goal, set out in the introduction, of examining the relative effect sizes of different contributors to covariance among the Big Five, and the relatively strong conclusion that their findings “undermine Digman’s (1997) hypothesis of two broader personality traits.” Even to begin to make such a claim, the authors would need to test and reject an additional model, specifying that both the higher-order factors and the halo effect are operating together. Digman’s model was not exactly accurate for single-informant ratings, in which the higher-order factors are always correlated, but it appears to be accurate for multiple informants. I am aware of two articles which have examined Digman’s two factors using CFA in multi-informant data, one by DeYoung (2006) and another which I recently reviewed for this journal. Both of these indicated that the halo effect contributed to correlations among the Big Five in individual informant ratings, but also that the higher-order factors were present and uncorrelated. The latter article even found a significant genetic basis for the higher-order factors. (It is true that Biesanz and West (2005) did not find correlated Big Five factors at the latent level in a multi-informant design, but their sample showed considerably lower interrater agreement than either of the two papers just mentioned, which presumably attenuated their latent correlations.)
“The introduction is considerably too long, dwelling in detail on points that could be summarized much more succinctly.
“Additional points:
“p. 5. DeYoung (2006) did not “dismiss the halo model,” but in fact explicitly mentioned that his findings were consistent with the hypothesis that a general bias toward evaluative consistency contributed some (but not all) of the covariance of the Big Five in single informant ratings.
“p. 8. The author’s assertion that “it is incorrect to assume that Digman’s (1997) rotated factor solution provides a valid account of the structure of Big Five correlations because the unrotated factor structure provides an equally plausible account of the structure” is itself incorrect because rotated and unrotated factor solutions are equivalent in their fit to the data. Perhaps they meant that it is incorrect to assume that Digman’s solution is the ONLY valid account – but this would be a straw man, as no one with any knowledge of factor analysis is likely to make this assumption.
“p. 10. Here the authors present a false choice: “…it becomes a theoretical question whether it makes more sense to postulate causal mechanisms that produce a positive correlation between Digman’s higher order factors, or to postulate a halo model and to allow for an additional factor that influences E and O.” Another option is that both higher-order factors reflect causal mechanisms, but the halo effect is also at work and produces a correlation between them. This interpretation is supported by the articles discussed above.
“p. 10. In relation to DeYoung’s (2006) results, the authors note “the two factors are substantially correlated in confirmatory factor analyses of the same-method correlations among the Big Five (based on our own analyses of the covariance matrices)” – strange that they would mention their own analyses but not the fact that DeYoung reported these same results. This rhetorical strategy contributes to my impression that this article is attempting to create conflict where none exists.
“p. 11. A relatively minor point: correlations should not be squared to determine the amount of variance explained, when the measures in question stand in for latent traits (Ozer, 1985, Psych Bull). [I later realized the flaw in this argument, although I do agree with Ozer’s later argument that correlation is a better measure of effect size because the importance of effects scales with the correlation, not the squared correlation.]
“p. 12. Their fifth conclusion is not quite accurate because multi-informant models do not reject the independence of the higher-order factors (DeYoung, 2006). Of course, the halo effect is still modeled in those models, but as correlations among the uniquenesses for individual raters.
“p. 20. The authors don’t have the patterns quite right for their Saints and Superheroes model. Paulhus and John’s (1998) factor analysis showed that bias in N is more strongly related to bias in E and O than to bias in A and C. N should be either left out of their model 4 or grouped with E and O.
“p. 22. Cohen’s rule of thumb about effect sizes appears to be wrong (Hemphill, 2003, AP; Richard, Bond, & Stokes-Zoota, 2003, RGP). It would be better to cite empirical guidelines for effect sizes.
“p. 40. The authors “think it is worthwhile to examine the robustness of our findings with finer categories in future research. Evidently, sample sizes will have to be large given the exponential increase in patterns (e.g., 35 = 243).” Why did they not try finer categories in their Study 3? They certainly have the sample size to examine 243 patterns.”
Review of your revised submission:
“I have reviewed previous versions of this paper, and the current version is a great improvement. The decision to use structural models is welcome, and the concept of a model that explicitly separates variance in the Big Five due to evaluative consistency (halo) from variance due to the metatraits is innovative and promising. The manner in which the HAB model integrates previous findings is elegant, as well. These analyses support the existence of the metatraits, and further support my hypothesis (DeYoung, 2006) that the metatraits should be more easily found in better instruments. The finding that the halo factor is not consistent across raters but correlates strongly with a latent measure of bias (the shared variance among self-ratings of intelligence, attractiveness, athleticism, and trivia knowledge) is compelling as an argument that halo reflects bias rather than substantive personality variance. The association of halo with self-esteem is sensible conceptually, but the complexities of the theory and method in that study leave some doubts about the interpretation of the result (discussed below). The last study is nice as another replication and an extension to longitudinal data.
“A central assumption of the authors’ model is that they can impose equality constraints on all loadings on halo. Halo results from a bias toward evaluative consistency; thus the more socially desirable is a trait, the more it should be influenced by halo. The equality constraint implies that all traits are equally socially desirable. The accumulated research on social desirability would suggest otherwise. Is desirability close enough to being equivalent across the Big Five that the HAB model can get away with making this assumption? One way to find out would be for the authors to fit a variant of the HAB model with the halo loadings unconstrained and test whether there is a significant improvement in fit. If there is, then the model has a problem, particularly in Study 3, where this assumption becomes central to testing their hypothesis regarding self-esteem.
“More on Study 3: I am ready to believe that self-esteem correlates with halo because it inclines people to rate themselves generally positively or negatively, but I’m not sure that the distinction between a bias in “ratings” and a bias in “perceptions of personality traits” functions well theoretically. The halo bias produces evaluative consistency, such that one is likely to view oneself positively or negatively across the board. How is this not a bias in the perception of personality traits? Perhaps the authors would assert that the halo bias only renders one more likely to “rate” oneself positively or negatively across the board, without influencing one’s perception of oneself, but I know of no evidence that would encourage such an assumption, nor am I sure the distinction even makes sense. I like Study 3, but its hypothesis might be too ambitious. Why not simply use the latent Big Five, metatrait, and halo variables to predict observed self-esteem, in the SEM equivalent of multiple regression, and ditch the latent self-esteem variable? (Using a self-esteem measure with multiple items would have rendered latent self-esteem a more useful entity.) It would be interesting to see the degree to which self-esteem reflects real personality over and above halo. I’m skeptical about the authors’ ability to sort out in which direction causality runs (and in what proportion) between self-esteem and halo.
“My other quibble with this paper has to do with the failure to test alternative models. In their discussion the authors write, “Thus, an important avenue for future research is to test the HAB model against alternative models.” In fact, this is an important avenue for their own research as well: they need to provide direct comparisons of fit for the HAB and CAB models in all of their datasets. If the CAB models fit better, the authors might want to explain why HAB could nonetheless be desirable in some situations.
“I agree that the HAB model is more pleasing conceptually than the CAB model, but it does require more assumptions and constraints than the CAB model. The CAB model implicitly models halo bias, as a correlation between Alpha and Beta. If one uses the metatraits as simultaneous predictors, the CAB model therefore eliminates the effect of halo, and one gets relatively unbiased estimates of the association of each metatrait with a criterion of interest.
“One possibility that would require fewer constraints than the authors’ HAB model would be to fit halo as a single higher-order factor influencing Alpha and Beta. Here the two loadings on halo could be constrained to be equal with less difficulty, since the relative loadings for two markers of a latent factor are arbitrary, and the Alpha loadings would not need to be constrained. One might wonder whether it makes sense conceptually to think of halo as influencing Alpha and Beta directly and the Big Five indirectly, but it would be easy enough to calculate the amount of variance in each of the Big Five due to the metatraits vs. due to halo, just as we calculate how much variance in a cognitive test is due to g vs. a lower-order ability factor like verbal ability.
“Finally, while we’re considering at what level of the hierarchy to fit the halo factor, the authors might discuss why, in Study 2, they have halo influencing latent Big Five traits directly, rather than influencing the observed ratings at the item level. Isn’t it most conceptually accurate to depict halo as a direct influence on items?
“Despite some concerns with various aspects of this paper, on the whole I think it is excellent, and it seems likely that the authors will be able to address my concerns.
“Additional comments:
“p. 3, last par. “these five factors are not at the basic level at personality description” should read “…of personality description”
“p. 5, par 1. “in Goldberg’s IPIP warmth is a facet of A and impulsivity is contained within E” – to the best of my knowledge, impulsivity is not contained in E in Goldberg’s IPIP. In the IPIP AB5C scales (the largest collection of Big Five facets from the IPIP), “Impulse Control” is a facet of N, and other impulsivity related content is mainly within C.
“p. 5., last par. The “D” in “deYoung” should be capitalized. (This problem recurs sporadically throughout the manuscript – e.g., pp. 13, 20, 25).
“p. 6., par 2. “A major limitation of the previous studies is the exclusive reliance on ratings by a single rater,” – somewhat misleading because one of “the previous studies” discussed was DeYoung, 2006, a multi-method study that also analyzed single ratings separately. Perhaps this could read “A major limitation of many previous studies…”
“p. 6, last par. “while any leftover variance that is not shared between informants is assumed to reflect biases unique to single informants.” When the authors introduce this assumption, they must point out that it is known to be flawed; multiple raters often provide incremental validity (Fiedler, Oltmanns, & Turkheimer, 2004; Mount, Barrick, & Strauss, 1994; Vazire & Mehl, in press, JPSP), which means that different raters detect different valid variance. Some unique variance is therefore valid. MTMM with multiple informants can still be useful, but we must acknowledge that nonshared variance is not all bias.
“p. 8, end of par. 1. “and found that on average 60-80% of the observed correlations in ratings by a single rater were due to rater-specific biases.” Because of the point just raised, the authors need to note that this is probably an overestimate.
“p. 11. “An unconstrained HAB model would only have one degree of freedom.”
It would appear to me that an unconstrained HAB model would have no degrees of freedom. 5 would be spent estimating the loadings of the Big Five on Halo, the other 5 on Alpha and Beta. What am I missing?
“p. 16. “In order to obtain more accurate measures of the Big Five, we adjusted the observed variances by the reliability coefficients (i.e., Cronbach’s alphas)” – I think it would be helpful for many readers to have a more thorough explanation of how this is accomplished.
“p. 20, end of par. 1. “superheroes and saints that consider” should be “superheroes and saints who consider”
“p. 22. “One explanation for the low internal consistency is that the correlation between the directly scored and the reverse scored items are attenuated by both evaluative bias and acquiescence bias.”
I fail to see how evaluative bias would be likely to attenuate the correlations between the two TIPI items for each of the Big Five. Given that each of the Big Five has one desirable pole, evaluative bias should inflate the correlations of the two items. An internal consistency between .2 and .6 is not low for a scale with two items.
“p. 22. “Internal consistency for the five personality dimensions was low (range .56 to
.74)” – Again, this is not particularly low for 3-item scales.
“p. 24. “However, in lieu of low correlations among the scale items” – I suspect the authors mean “However, in light of…” “In lieu” means “instead.”
“p. 23. A couple comments about the models in Study 2. First, the uniqueness for self-rated intelligence should be allowed to correlate with O because descriptions of intelligence fall within Openness/Intellect in the Big Five (e.g., DeYoung, Quilty, & Peterson, 2007, JPSP; Hofstee, Goldberg, & de Raad, 1992, JPSP), and many studies have shown that self-rated intelligence does share at least a small amount of variance with true intelligence (i.e., with ability tests), indicating that it is not all bias. Self-rated trivia knowledge also seems likely to be validly related to Openness/Intellect. Second, here again the equality constraint for loadings on halo seems potentially problematic. I’m wondering whether this constraint could prevent the emergence of an Alpha factor. The authors should discuss whether alpha could be found with differently constrained models.
“p. 27, par. 2. It would be preferable to use the phrase “regression path” instead of “causal path.” SEM cannot directly test causality, any more than standard regression can. All it can do (like standard regression) is to provide support for models that are consistent with causal hypotheses. Provide longitudinal data and maybe you can make stronger causal claims.
“p. 30, par. 2. “and there independent” should be “and three independent.”
“p. 32. “The main finding was that self-esteem was highly correlated with halo even after removing halo biases in ratings of self-esteem. This finding suggests that halo biases are not just mere rating biases, but actually reflect biases in self-perceptions.”
The first of these sentences is true only if self-esteem truly loads equally or less strongly on halo than the Big Five, which the authors have not tested, nor could they. As noted above, it would help their case to test first whether the equal loading constraint is valid even for the Big Five. If it is not, then perhaps they could constrain the self-esteem loading to be similar to the strongest loading among the Big Five, as a conservative estimate. Regarding the second sentence, I’m still not sure that a rating bias and a self-perception bias can be sensibly distinguished. Do we imagine that people are attempting to keep their ratings evaluatively similar through some process that does not involve biased self-perception? Surely, no one is looking over the ratings thinking “If I gave myself a 4 on “friendly,” I should give myself a 4 on “diligent” to be consistent” – I would be inclined to imagine that halo works precisely through biases in perception. I might be wrong, but I think the authors should hedge their interpretation a bit and acknowledge the difficulties with it.
“Table 1 would be clearer if spaces for non-existent informants, in the first and last three studies, were left blank, retaining the dashes only for parameters that were fixed at zero.
“Figure 4. Shouldn’t the correlation of True SE with N be negative?
“Sincerely,
Colin DeYoung”
So, there you have it. My reviews don’t seem quite so unreasonable as you make me out to be in this post. Rather than a battle, this was perhaps more like a constructive exchange in which I suggested a method that you then published and have subsequently used extensively. This is already quite long for a comment on a blog, so I’ll post my response to the substance of your argument in another one.
Thanks for sharing the reviews. Yes, you killed our original approach to look at the structure of personality by means of simply looking at the frequency of the 32 types that you can create with a median split of the Big Five scales. As you noted, this allows to look for interactions that bivariate correlations cannot reveal. Given how much nonsense has been published (Digman, 19987, Musek, 2007, your 2001 article, for example), this would not have hurt personality psychology. The main finding of course that there are no cool interactions and that there only two very prevalent types. Good people and bad people. Not novel, so reject. The big finding was that there were no types, but you missed this because we only publish sexy results. That is exactly the problem with psychology. Digman invented the Big Two and now they cannot die because psychologist don’t know how to kill bad theories, they only know how to kill papers they don’t like in the review process.
Okay, on to the scientific questions. As you acknowledge here, and as shown in the meta-analysis by Chang et al. that I mentioned in my previous comment, correlations among the Big Five in a variety of measures are somewhat attenuated but still present even when modeling the Big Five as the shared variance of scores from multiple raters. These studies show that Digman’s higher-order factors are real but relatively weak factors. I think these factors are of interest conceptually, but I also agree that it is generally more valuable empirically to study levels of the trait hierarchy below the Big Five. None of this gets at the real substance of your critique, however, which is that you think the correlations among Big Five scales are likely to be artifactual for reasons other than individual rater biases, namely cross-loadings.
Let’s talk first about whether it makes sense to study higher-order factors, given that the Big Five were conceived as orthogonal, then we’ll move on to the issue of cross-loadings. In my 2006 JPSP paper that you cite extensively here, I wrote:
“The traditional conception of the Big Five as orthogonal is partly a historical accident resulting from the methods used in their discovery. Had more of the factor analyses that originally validated the Big Five model been performed with oblique rotations that allow correlations among factors, instead of orthogonal rotations that artificially prevent any correlations among factors (at the expense of explaining less variance), we might never have had to debate the reality of correlations among the Big Five.”
In general, I prefer oblique rotation because it entails one less assumption being imposed on the analysis. Why should we assume that simple structure should lead to orthogonal factors? If we use oblique rotation, then we’ll find out how correlated the factors are. They might well be nearly uncorrelated, which would be a more informative outcome than forcing them to be uncorrelated using orthogonal rotation. You wrote, “One important feature of PCA is that the components are independent (orthogonal)” but of course this is only true if one does not rotate the components or uses an orthogonal rotation.
Using an oblique rotation in an adjective dataset like those used to demonstrate the Big Five and then factor-analyzing the resulting factor correlation matrix would be an obvious way to test the existence of the higher-order factors. Further, this method would also deal with the problem of cross-loadings because in PCA/EFA all cross-loadings are included. You suggest that I ignored the paper by Ashton et al. (2009) arguing that cross-loadings accounted for the higher-order factors. This is not true. I briefly discussed the problems with their conclusions in this paper (https://www.frontiersin.org/articles/10.3389/fnhum.2013.00762/full), and I commented more extensively on the problems in a letter I wrote to Jack Block in reply to a letter he sent me after Ashton et al.’s paper was published. I’ll come back to this as an appendix (see next comment) but first I want to show you some data because I think that’s the best argument.
I conducted common factor analysis with oblimin rotation (delta = 0) in a sample of 700 participants in the Eugene-Springfield community sample (publicly available from the Harvard Dataverse). The variables were 395 of the adjective most commonly used to describe people, which were a subset that remained after I excluded adjectives that seemed purely evaluative (“awful”), purely or substantially physical (“tall,” “attractive”), demographic (“rich,” “educated”), or external (“lucky”) from the full list of 525 adjectives described by Saucier (1997, JPSP). A five-factor solution yielded the standard Big Five factors (I’ll paste this in another comment). Further, these factors were correlated in the following manner (note these are the correlations among the factors themselves, not among factor score estimates):
A 1.00
E .021 1.00
N -.230 .087 1.00
C .214 -.003 -.259 1.00
O .144 .236 -.065 .123 1.00
This correlation matrix yields the following two-factor solution:
N -.542 .094
C .485 .021
A .435 .131
O .247 .599
E -.099 .414
Structure Matrix (oblimin, delta = 0), factor correlation = .051
In other words, one can account for every possible cross-loading, and the higher-order factors of the Big Five are still alive and well (and uncorrelated!). Long live Stability and Plasticity. Now, you might argue that the problem with this approach is that it doesn’t model the halo or acquiescence biases, and I grant you that those biases are likely to be distorting correlations among items in this analysis to some extent. However, the optimal solution to this problem requires data with multiple raters. I appreciate the efforts you have made to develop a model that includes these two bias factors for individual raters, and it’s interesting to consider your results, but I’m afraid your model is inescapably flawed because the halo factor will always confound substance with style, given that differences in self-esteem (strongly negatively associated with depression; indeed, low self-worth is often measured as an element of depression), which is a substantive trait, are strongly related to halo. Also, Pettersson, Turkheimer, Horn, & Menatti (2011, EJP) found that items related to depression were so strongly evaluative that they concluded one can’t measure depression adequately. I draw a different conclusion, which is that depression is so undesirable that it is seriously confounded with the evaluative factor. For these reasons, extracting halo in single-informant ratings inappropriately removes substantive variance related to self-esteem and depression. This is probably why you sometimes had trouble identifying Alpha/Stability in your 2009 paper.
Another flaw is that your model is a bifactor model (i.e., one with general factors as well as narrower factors), and simulation evidence is accumulating that bifactor models often fit better than other models even when they are not the generating model (e.g., Greene et al., 2019, Journal of Abnormal Psychology). The general factors may soak up variance that should be modeled in the other factors. (Nonetheless, I’ll note that one way you could improve your model is that, instead of setting all halo loadings to 1 by default, you could do what Pettersson et al., 2011, EJP, have done and fix the loadings according to ratings of desirability made by other subjects.) At any rate, I don’t think you’ll be able to provide better evidence on this question unless you have self- and peer ratings on an unbiased selection of personality descriptors. Using self- and peer ratings of items from purpose-built Big Five instruments won’t work because they are often carefully designed to reduce correlations among the Big Five.
For now at least, given the convergence between multi-rater studies of Big Five scales and the factor analysis of adjectives I presented above, it seems safe to conclude that the higher-order factors of the Big Five are real. In one of your recent blog posts, you asked, “how would it be possible that personality items that were created to measure a personality attribute and that were selected to show internal consistency and convergent validity with informant ratings do not reflect a personality trait?” I agree that this isn’t possible, and I’d like to point out that I identified a set of items that correlate substantially and similarly with the three Big Five traits (rated by self and peers) within Stability and another set that correlates with both Extraversion and Openness (https://www.tandfonline.com/doi/full/10.1080/10478401003648674). They have good internal consistency and clearly are personality traits by your standards, whether or not you want to acknowledge them as higher-order factors of the Big Five.
By all means do an oblique rotation, but please make sure that your item sample is representative and that you control for rating biases like halo that you acknowledge influence correlations among items. As you know in multi-method studies, many of the cross-factor-cross-rater correlations are close to zero.
Appendix: Some thoughts on Ashton et al. (2009), originally delivered to Jack Block:
“First of all, they acknowledge what we all know: that personality traits do not have simple structure. But this means that a strict higher-order factor model starting from distinct facets is doomed to fit poorly. It does; no surprise there. Then they compare it to an orthogonal factor model in which they use the five largest modification indices to choose which cross loadings to allow. By definition, these are the five cross loadings that maximally improve the fit of the model in this particular sample and instrument (so this is hardly a “confirmatory” factor analysis). Then they crow about the fact that the cross-loading model fits better than the higher-order factor model.
“I’m afraid I’m not impressed, and not just because, given the lack of simple structure in personality and given their approach, the conclusion was foregone. Of the 5 cross loadings they allowed, 3 of them cross from alpha- to beta-related traits or vice versa. It is explicit in their argument that they are identifying a type of artifact that explains the existence of the consistent, replicable, higher-order factor structure of the Big Five. For their explanation to be credible, they would have to show that the important cross-loadings involve traits from within the same higher-order factor. Neuroticism shows no cross loadings here, and its subscales receive only one cross loading – from Extraversion. How does this help to explain why N is related to A and C sufficiently to form the Alpha/Stability factor, even when controlling for the biases of individual raters or examining genetic correlations?”
And a note from the same letter about the implausibility of Ashton et al.’s explanations for why there would exist just the pattern of cross-loadings that would be necessary to reliably produce the standard higher-order factors: “They argue that same-sign blends are more common than opposite-sign blends, especially among the Stability traits, but they fail to mention that there are so many descriptors located at the intersection of low Emotional Stability and high Agreeableness (e.g., sensitivity, sentimentality, femininity) that they constitute the primary markers of one of the HEXACO factors! Ashton himself acknowledges that his Emotionality and Agreeableness factors are 45-degree rotations of Big Five N and A, with Emotionality a combination of high N and high A.” Their explanations for why some cross-loadings would exist but not others are just-so stories, and one can easily think up reasons why other patterns (including some that actually exist, as just described in the quoted passage) would be likely that would not lead to the same higher-order factors.
I like Block’s critic of the Big Five (1995) and some of his other work, but he is not known to be an expert on psychometrics or SEM. I don’t care about Ashton’s specific model, I just wanted to give them credit for pointing out that we can fit data in two ways. With a higher-order factor or with secondary loadings. Simply fitting only a higher-order model and ignoring the secondary loading model is not good science. I think the best way is to see how many secondary loadings there are that are consistent with the idea of a higher-order model. If E and O share a common higher order factor MOST E items should load on O and most O items should load on E. We shouldn’t see A LOT of E items that only load on E or O items that only load on O. Moreover, the sign of the loadings should be consistent with the predictions from the higher order model. Another approach would be to identify actual causes of higher-order factors and then show that they relate to E and O items. So, we can only test the theory with a proper measurement model at the item level. Once we sum items into scales the critical information is lost. So, I am proposing a methodological way forward. I personally don’t care whether we find evidence for alpha and beta or not. I just don’t like research that aims to confirm a theory rather than testing it.
For the truly curious. Big Five factor loadings for 395 adjectives.
A E N C O
Kind-hearted .779 -.126 -.240 .302 -.155
Warm-hearted .761 -.050 -.139 .240 -.143
Warm .751 .098 -.184 .160 -.205
Kind .716 -.187 -.318 .355 -.162
Friendly .707 .080 -.328 .244 -.214
Caring .703 -.107 -.148 .301 -.213
Giving .702 -.003 -.184 .256 -.165
Cheerful .686 .152 -.356 .212 -.140
Compassionate .680 -.162 -.151 .253 -.192
Loving .674 .000 -.159 .216 -.240
Understanding .655 -.192 -.219 .299 -.234
Lovable .655 .093 -.198 .124 -.198
Pleasant .651 -.116 -.305 .302 -.251
Encouraging .651 .055 -.199 .207 -.240
Good-humored .649 .102 -.296 .181 -.213
Helpful .636 -.099 -.317 .435 -.216
Joyful .634 .252 -.350 .162 -.156
Good-natured .632 -.062 -.283 .164 -.104
Considerate .626 -.174 -.344 .492 -.191
Supportive .626 -.059 -.168 .285 -.255
Laughing .622 .310 -.082 -.007 -.172
Glad .619 .202 -.329 .213 -.132
Affectionate .616 .145 -.114 .127 -.255
Appreciative .614 -.044 -.237 .413 -.092
Delighted .603 .273 -.124 .115 -.278
Sympathetic .598 -.188 -.152 .235 -.115
Likeable .598 .051 -.279 .293 -.267
Sincere .594 -.113 -.282 .484 -.215
Gentle .593 -.300 -.189 .174 -.062
Nice .581 -.165 -.187 .258 -.124
Grateful .578 .055 -.160 .311 -.053
Generous .578 .073 -.101 .169 -.180
Gracious .576 .015 -.174 .326 -.137
Cooperative .575 -.107 -.262 .391 -.116
Enthusiastic .570 .405 -.188 .142 -.336
Thankful .562 .084 -.192 .334 .020
Thoughtful .555 -.103 -.234 .435 -.379
Agreeable .553 -.176 -.281 .244 -.101
Forgiving .552 -.112 -.225 .192 -.100
Polite .548 -.071 -.270 .505 -.049
Unfriendly -.544 .050 .479 -.284 .073
Happy .533 .226 -.422 .206 -.124
Pleased .532 .283 -.269 .205 -.178
Hopeful .526 .154 -.171 .205 -.157
Trusting .521 .080 -.232 .176 .049
Sensitive .518 -.155 -.040 .150 -.174
Romantic .512 .136 -.061 .069 -.212
Open .511 .123 -.181 .095 -.311
Courteous .511 -.079 -.212 .481 -.086
Genuine .504 -.041 -.226 .470 -.261
Neighborly .503 .114 -.161 .192 -.083
Devoted .501 .085 -.125 .373 -.008
Optimistic .500 .218 -.361 .163 -.226
Eager .498 .276 -.122 .191 -.384
Fair .493 -.068 -.222 .432 -.208
Lively .491 .459 -.188 .148 -.293
Cold -.489 .091 .438 -.146 .097
Unsympathetic -.489 .244 .349 -.292 .115
Sociable .488 .295 -.272 .184 -.114
Flexible .478 -.044 -.230 .114 -.293
Tolerant .477 -.222 -.266 .014 -.189
Social .473 .361 -.271 .187 -.146
Peaceful .471 -.131 -.390 .163 .002
Playful .468 .345 .005 -.031 -.312
Excited .462 .444 .003 .101 -.358
Expressive .459 .327 -.051 .136 -.423
Comfortable .458 .148 -.374 .344 -.120
Interested .456 -.001 -.198 .333 -.422
Sentimental .452 .031 .069 .112 .096
Passionate .447 .260 .026 .033 -.272
Concerned .446 -.012 .042 .247 -.196
Spontaneous .429 .286 -.004 -.041 -.372
Inspirational -.429 .300 .403 -.230 .078
Reasonable .424 -.196 -.312 .421 -.263
Protective .419 .019 .042 .324 -.075
Easygoing .418 -.036 -.263 .008 -.062
Insensitive .416 .205 -.059 .096 -.374
Popular .412 .392 -.297 .214 -.276
Humorous .404 .286 .041 -.028 -.307
Charming .393 .292 -.175 .144 -.277
Patient .364 -.235 -.326 .154 -.093
Down-to-earth .356 -.080 -.159 .256 -.010
Attentive .355 -.082 -.245 .313 -.243
Busy .350 .177 -.147 .344 -.253
Stingy -.346 .088 .345 -.143 .120
Emotional .342 .093 .310 -.022 -.024
Idealistic .332 .008 -.011 .028 -.207
Familiar .325 .233 -.019 .054 -.116
Carefree .308 .222 -.253 -.052 -.095
Surprised .300 .134 .113 -.030 .075
Fashionable .299 .250 -.068 .154 -.024
Laid-back .259 -.103 -.127 -.120 -.073
Casual .241 -.099 -.049 .015 -.125
Religious .226 .010 -.039 .176 .178
Innocent .213 -.072 .035 .059 .200
Informal .169 -.168 -.039 .079 -.124
Aggressive -.055 .586 .023 .138 -.251
Bold .054 .542 .052 .037 -.445
Cocky -.108 .536 .261 -.180 -.308
Assertive .145 .522 -.134 .261 -.413
Powerful .110 .522 -.047 .098 -.480
Loud .000 .519 .289 -.208 -.082
Forward .191 .515 -.032 .076 -.294
Outgoing .475 .509 -.220 .136 -.219
Noisy .076 .508 .251 -.233 -.045
Dominant -.111 .485 .199 .143 -.307
Extraverted .342 .468 -.118 .001 -.260
Rowdy .005 .468 .259 -.251 -.194
Entertaining .426 .464 -.110 .043 -.415
Controlling -.133 .449 .323 .099 -.229
Bossy -.085 .439 .403 .044 -.151
Hilarious .234 .430 .066 -.155 -.236
Egotistical -.191 .430 .229 -.075 -.326
Intimidating -.216 .428 .329 .032 -.349
Quiet -.030 -.422 .018 .172 .006
Competitive .000 .416 -.030 .187 -.219
Talkative .402 .410 -.004 .062 -.240
Colorful .308 .407 .114 -.097 -.347
Rough -.300 .406 .395 -.229 -.118
Soft-spoken .039 -.405 -.008 .056 .055
Uninhibited .219 .399 -.023 -.046 -.309
Comical .279 .383 .089 -.142 -.238
Conceited -.173 .382 .262 -.141 -.259
Opinionated -.079 .381 .311 .059 -.263
Demanding -.170 .379 .301 .140 -.289
Amusing .331 .378 .039 -.071 -.344
Stuck-up -.347 .377 .375 -.150 -.113
Seductive .187 .369 .069 -.079 -.279
Controversial -.083 .363 .344 -.158 -.342
Energetic .350 .352 -.253 .275 -.277
Shy -.069 -.351 .316 -.147 .108
Funny .337 .339 .043 -.075 -.325
Ambitious .282 .305 -.130 .270 -.211
Impulsive .205 .283 .231 -.216 -.212
Spoiled -.094 .275 .274 -.111 -.030
Materialistic -.109 .238 .160 .068 -.019
Sad -.225 -.113 .710 -.222 .077
Irritated -.293 .084 .710 -.131 .023
Troubled -.168 -.043 .707 -.210 .030
Insecure -.123 -.149 .703 -.360 .130
Confused -.121 -.001 .680 -.417 .108
Crabby -.325 .222 .678 -.138 .079
Angry -.255 .146 .678 -.195 -.038
Disappointed -.157 -.003 .673 -.176 .019
Frustrated -.067 -.004 .672 -.147 -.002
Upset -.167 .061 .662 -.156 .045
Grumpy -.319 .171 .659 -.088 .054
Frustrating -.221 .128 .654 -.218 .000
Worried -.027 -.109 .651 -.131 .122
Annoyed -.227 .121 .646 -.036 .021
Disturbed -.183 .007 .643 -.299 .110
Unhappy -.322 -.138 .637 -.233 .151
Moody -.155 .046 .633 -.057 .021
Afraid .006 -.142 .633 -.242 .178
Grouchy -.330 .243 .629 -.106 .012
Hostile -.335 .282 .624 -.248 -.036
Difficult -.271 .304 .623 -.210 -.093
Complaining -.215 .136 .620 -.206 .110
Irritable -.283 .254 .619 -.098 -.034
Uncomfortable -.210 -.105 .617 -.290 .101
Scared -.015 -.103 .614 -.218 .142
Depressed -.158 -.136 .610 -.200 .053
Fretful -.062 .007 .609 -.131 .077
Annoying -.244 .262 .609 -.287 -.025
Aggravating -.281 .282 .600 -.213 -.068
Ashamed -.115 .023 .593 -.294 .109
Unsure -.087 -.288 .591 -.374 .223
Tense -.026 -.027 .588 -.064 .058
Lonesome -.167 -.153 .583 -.218 .000
Bored -.265 -.036 .578 -.221 .152
Awkward -.024 -.066 .577 -.308 .044
Temperamental -.175 .238 .572 -.113 .003
Furious -.225 .234 .571 -.218 -.006
Bitter -.262 .012 .568 -.253 .027
Unstable -.280 .062 .564 -.404 .038
Irritating -.280 .233 .564 -.213 -.057
Touchy -.090 .102 .560 .041 .030
Lonely -.155 -.121 .556 -.234 .007
Well-adjusted .424 .114 -.553 .414 -.257
Cranky -.274 .241 .546 -.113 .063
Selfish -.338 .236 .539 -.308 -.079
Embarrassing -.138 .206 .538 -.307 .019
Anxious .020 .045 .535 -.068 .131
Needy -.073 .120 .534 -.275 .016
Rude -.356 .335 .532 -.372 -.056
Humiliated -.138 .056 .527 -.236 .134
Withdrawn -.289 -.260 .526 -.234 .056
Irrational -.098 .246 .525 -.397 .040
Offensive -.253 .344 .521 -.276 -.067
Confusing -.116 .118 .516 -.390 -.043
Suspicious -.193 .060 .515 -.068 .009
Immature -.116 .129 .513 -.405 .105
Obnoxious -.253 .419 .513 -.381 .043
Self-assured .284 .354 -.509 .354 -.314
Defensive -.092 .100 .509 -.055 .081
Envious -.096 .041 .507 -.224 .146
Embarrassed -.081 -.096 .507 -.216 .184
Obsessive -.166 .257 .504 -.119 -.138
Exhausted -.046 -.059 .502 -.156 .085
Short-tempered -.260 .261 .502 .060 .074
Heartbroken -.012 -.007 .499 -.160 .024
Arrogant -.270 .437 .497 -.208 -.255
Greedy -.239 .217 .495 -.260 -.017
Unreasonable -.331 .224 .490 -.358 .178
Inconsiderate -.435 .172 .490 -.402 .088
Harsh -.300 .335 .489 -.054 -.025
Insulting -.392 .380 .489 -.247 -.013
Hot-tempered -.250 .317 .487 -.028 -.001
Confident .303 .361 -.482 .397 -.394
Cruel -.316 .338 .480 -.334 .086
Argumentative -.193 .381 .476 -.101 -.200
Foolish .001 .171 .471 -.380 .010
Nervous .053 -.074 .471 -.088 .146
Guilty -.040 .047 .469 -.266 .097
Preoccupied -.100 .027 .468 -.117 -.094
Jealous -.068 .217 .462 -.141 .052
Thoughtless -.345 .192 .461 -.329 .106
Weak -.124 -.158 .460 -.282 .302
Mean -.347 .340 .458 -.209 -.012
Abusive -.271 .403 .457 -.280 .053
Secure .257 .234 -.455 .258 -.040
Dumb -.109 .204 .455 -.319 .236
Self-conscious -.023 -.187 .452 -.066 .107
Self-confident .238 .430 -.450 .343 -.376
Satisfied .359 .117 -.450 .210 -.001
Helpless -.025 -.073 .447 -.286 .198
Tired -.073 -.202 .446 -.127 .120
Rebellious -.117 .229 .444 -.237 -.392
Indecisive -.054 -.231 .439 -.315 .243
Violent -.224 .356 .438 -.166 -.070
Wishy-washy -.092 -.124 .438 -.427 .231
Self-centered -.316 .266 .435 -.197 -.114
Reckless -.130 .384 .430 -.415 -.120
Inexperienced -.060 -.067 .420 -.262 .262
Impatient -.137 .272 .420 -.001 -.080
Critical -.214 .149 .414 .100 -.150
Impolite -.317 .196 .412 -.366 .001
Childish .046 .287 .409 -.367 -.088
Unfair -.327 .196 .403 -.380 .186
Ignorant -.060 .092 .396 -.371 .194
Disobedient -.196 .171 .391 -.337 -.235
Sarcastic -.237 .279 .390 -.116 -.102
Phony -.213 .151 .386 -.355 .134
Corrupt -.202 .242 .382 -.348 .059
Bashful -.041 -.328 .381 -.101 .158
Relaxed .270 .012 -.380 .080 -.088
Compulsive -.045 .220 .379 -.182 -.049
Possessive -.053 .243 .372 .058 .009
Snobbish -.246 .276 .371 -.181 -.122
Clumsy .063 -.027 .367 -.199 .093
Narrow-minded -.279 .127 .365 -.071 .311
Calm .259 -.113 -.362 .204 -.143
Shallow -.262 .099 .358 -.338 .334
Boring -.280 -.137 .350 -.149 .266
Cheap -.243 .026 .348 -.204 .134
Dangerous -.227 .345 .348 -.229 -.150
Stupid -.081 .166 .343 -.282 .219
Superstitious .005 .150 .342 -.216 .019
Ungraceful -.153 -.103 .339 -.227 .045
Nosy .053 .210 .339 -.153 -.018
Stubborn -.105 .195 .335 .063 -.073
Closed-minded -.318 .165 .332 -.023 .286
Naive .148 -.074 .329 -.140 .245
Frightening -.256 .276 .327 -.223 -.130
Rushed .014 .099 .310 .031 -.075
Prejudiced -.248 .160 .309 -.053 .106
Active .266 .277 -.305 .224 -.219
Forgetful .035 -.043 .300 -.263 .142
Unenvious .059 -.024 -.207 .104 -.160
Responsible .415 -.078 -.225 .671 -.253
Practical .248 -.071 -.214 .648 -.113
Reliable .399 -.050 -.214 .636 -.167
Conscientious .400 -.043 -.244 .634 -.251
Thorough .265 .019 -.190 .627 -.283
Sensible .305 -.110 -.209 .616 -.139
Efficient .167 .075 -.243 .614 -.187
Level-headed .375 -.037 -.282 .610 -.206
Trustworthy .429 -.110 -.252 .593 -.136
Consistent .207 .049 -.263 .592 -.067
Dependable .327 -.066 -.191 .587 -.160
Organized .088 .126 -.219 .584 -.090
Alert .325 .071 -.320 .582 -.340
Competent .310 .062 -.287 .577 -.470
Honest .366 -.169 -.291 .564 -.096
Realistic .130 -.054 -.250 .560 -.156
Irresponsible -.209 .127 .428 -.552 .089
Careless -.149 .159 .488 -.546 -.012
Systematic .022 .022 -.094 .544 -.142
Inefficient -.123 -.025 .464 -.539 .166
Disorganized -.002 -.017 .389 -.535 -.005
Productive .271 .145 -.203 .532 -.346
Respectful .510 -.119 -.214 .528 -.017
Trusted .496 -.126 -.276 .526 -.173
Loyal .502 -.091 -.167 .522 -.075
Stable .381 -.040 -.407 .521 -.129
Unreliable -.260 .135 .380 -.519 .170
Firm .125 .257 -.172 .517 -.156
Undependable -.179 .155 .340 -.514 .066
Sloppy -.178 .041 .455 -.509 -.024
Mature .320 -.064 -.244 .507 -.172
Logical .147 -.073 -.125 .502 -.338
Truthful .398 -.161 -.205 .494 -.053
Dedicated .422 .119 -.127 .489 -.248
Incompetent -.160 .035 .460 -.482 .294
Ethical .300 -.201 -.192 .476 -.128
Rational .160 -.117 -.225 .475 -.235
Determined .360 .222 -.124 .472 -.403
Effective .247 .202 -.239 .471 -.430
Decent .441 -.154 -.202 .467 -.167
Punctual .113 -.039 -.132 .461 .001
Prompt .065 -.072 -.173 .458 .025
Certain .292 .282 -.314 .452 -.281
Unfaithful -.251 .164 .327 -.449 .001
Traditional .187 -.032 -.063 .442 .220
Faithful .394 -.153 -.247 .437 .011
Careful .241 -.248 -.029 .433 .062
Disrespectful -.287 .172 .420 -.432 -.046
Wasteful -.106 .152 .351 -.425 .029
Hard-working .269 .106 -.187 .423 -.277
Strict .016 .163 .062 .419 .078
Straightforward .174 .087 -.202 .418 -.369
Businesslike .039 .088 -.118 .415 -.110
Proper .303 -.032 -.137 .410 .103
Self-sufficient .193 .078 -.275 .399 -.263
Messy -.020 .048 .278 -.392 -.185
Believable .327 -.167 -.175 .383 -.143
Persistent .212 .263 -.031 .378 -.365
Proud .325 .278 -.111 .372 -.103
Direct .153 .207 -.133 .368 -.357
Serious -.012 -.159 .129 .367 -.151
Independent .162 .169 -.170 .361 -.358
Unpredictable -.066 .265 .304 -.352 -.222
Observant .196 .032 -.175 .336 -.331
Cautious .198 -.254 .063 .310 .221
Dishonest -.203 .135 .305 -.308 -.011
Predictable .164 -.176 -.101 .287 .269
Modest .213 -.249 .008 .255 .147
Procrastinating .113 -.105 .212 -.252 -.023
Private -.032 -.205 .091 .225 -.125
Lazy -.123 -.027 .038 -.167 .089
Smart .188 .053 -.191 .289 -.687
Intelligent .170 -.048 -.195 .271 -.685
Exceptional .189 .357 -.077 .078 -.674
Clever .222 .293 -.114 .096 -.664
Brilliant .024 .298 -.019 .004 -.664
Knowledgeable .205 .063 -.202 .318 -.649
Excellent .275 .224 -.160 .228 -.648
Extraordinary .168 .426 -.043 .014 -.648
Intellectual .098 .082 -.100 .125 -.642
Bright .157 .034 -.159 .196 -.609
Outstanding .129 .377 -.026 .125 -.605
Skilled .161 .133 -.185 .285 -.581
Creative .211 .145 -.028 .044 -.568
Wise .293 .072 -.220 .285 -.566
Skillful .090 .119 -.208 .333 -.563
Deep .068 .055 .141 .011 -.563
Complex -.036 .112 .195 .038 -.562
Imaginative .258 .054 -.069 .105 -.556
Original .270 .208 -.004 .096 -.554
Fascinating .308 .431 -.096 -.004 -.553
Thinking .225 -.077 -.021 .330 -.553
Complicated -.077 .149 .323 -.046 -.524
Exciting .379 .489 -.124 .071 -.519
Persuasive .217 .337 -.078 .235 -.518
Accomplished .230 .158 -.222 .300 -.511
Ordinary .083 -.210 .040 .044 .495
Unintellectual -.158 .020 .277 -.177 .493
Perceptive .300 -.007 -.185 .277 -.492
Brave .245 .332 -.069 .144 -.479
Outspoken .082 .449 .083 .114 -.464
Uncreative -.154 -.061 .269 -.072 .459
Resourceful .303 .107 -.223 .432 -.459
Curious .312 .029 -.009 .157 -.459
Philosophical .243 -.045 .003 .036 -.453
Courageous .268 .305 -.095 .223 -.449
Experienced .274 .181 -.256 .303 -.443
Amazing .151 .365 .083 -.054 -.436
Valuable .348 .185 -.108 .297 -.430
Constructive .344 .017 -.137 .313 -.430
Daring .048 .409 .067 -.081 -.424
Open-minded .414 -.027 -.190 .006 -.419
Artistic .200 .056 .041 -.044 -.410
Tough -.010 .338 .124 .114 -.409
Unforgettable .170 .234 .029 -.065 -.400
Sophisticated .108 .192 -.027 .048 -.392
Witty .256 .374 .047 .005 -.391
Distinguished .131 .343 -.103 .088 -.387
Radical -.034 .186 .317 -.354 -.375
Adventurous .227 .353 -.067 .037 -.372
Conservative -.084 -.029 -.006 .301 .351
Liberal .246 -.025 .079 -.231 -.314
Harmless .104 -.138 -.025 .017 .230
Old-fashioned .092 -.072 .080 .180 .209
Awesome!! Thanks
just now JRP published an article that confirms my results with several datasets.
https://www.sciencedirect.com/science/article/abs/pii/S0092656618301971