
Abstract
This blog post reports a replicability audit of Ap Dijksterhuis 48 most highly cited articles that provide the basis for his H-Index of 48 (WebofScience, 4/23/2021). The z-curve analysis shows lack of evidential value and a high false positive risk. Rather than dismissing all findings, it is possible to salvage 10 findings by setting alpha to .001 to maintain a false positive risk below 5%. The main article that contains evidential value was published in 2016. Based on these results, I argue that 47 of the 48 articles do not contain credible empirical information that supports the claims in these articles. These articles should not be cited as if they contain empirical evidence.
INTRODUCTION
“Trust is good, but control is better”
Since 2011, it has become clear that social psychologists misused the scientific method. It was falsely assumed that a statistically significant result ensures that a finding is not a statistical fluke. This assumption is false for two reasons. First, even if the scientific method is used correctly, statistically significance can occur without a real effect in 5% of all studies. This is a low risk if most studies test true hypothesis with high statistical power, which produces a high discovery rate. However, if many false hypotheses are tested and true hypotheses are tested with low power, the discovery rate is low and the false discovery risk is high. Unfortunately, the true discovery rate is not known because social psychologists only published significant results. This selective reporting of significant results renders statistically significance insignificant. In theory, all published results could be false positive results.
The question is what we, the consumers of social psychological research, should do with thousands of studies that provide only questionable evidence. One solution is to “burn everything to the ground” and start fresh. Another solution is to correct the mistake in the application of the scientific method. I compare this correction to the repair of the Hubble telescope (https://www.nasa.gov/content/hubbles-mirror-flaw). Only after the Hubble telescope was launched into space, it was discovered that a mistake was made in the creation of the mirror. Replacing the mirror in space was impractical. As a result, a correction was made to take the discrepancy in the data into account.
The same can be done with significance testing. To correct for the misuse of the scientific method, the criterion for statistical significance can be lowered to ensure an acceptably low risk of false positive results. One solution is to apply this correction to articles on a specific topic or to articles in a particular journal. Here, I focus on authors for two reasons. First, authors are likely to use a specific approach to research that depends on their training and the field of study. Elsewhere I demonstrated that researchers differ considerably in their research practices (Schimmack, 2021). More controversial, I also think that authors are accountable for their research practices. If they realize that they made mistakes, they could help the research community by admitting to their mistakes and retract articles or at least express their loss of confidence in some of their work (Rohrer et al., 2020).
Ap Dijksterhuis
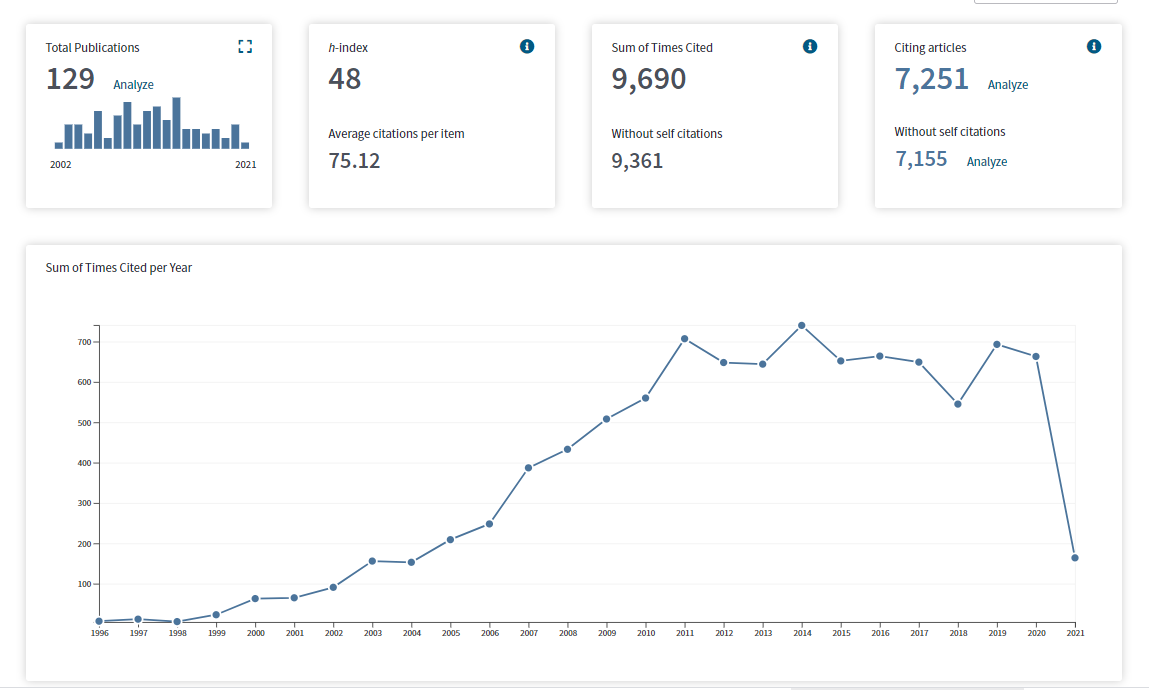
Ap Dijksterhuis is a well-known social psychologist. His main focus has been on unconscious processes. Starting in the 1990s, social psychologists became fascinated by unconscious and implicit processes. This triggered what some call an implicit revolution (Greenwald & Banaji, 1995). Dijksterhuis has been prolific and his work is highly cited, which earned him an H-Index of 48 in WebOfScience.
However, after 2011 it became apparent that many findings in this literature are difficult to replicate (Kahneman, 2012). A large replication project also failed to replicate one of Dijksterhuis’s results (O’Donnell et al., 2018). It is therefore interesting and important to examine the credibility of Dijksterhuis’s studies.
Data
I used WebofScience to identify the most cited articles by Dijksterhuis (datafile). I then coded empirical articles until the number of coded articles matched the number of citations. The 48 articles reported 105 studies with a codable focal hypothesis test.
The total number of participants was 7,470 with a median sample size of N = 57 participants. For each focal test, I first computed the exact two-sided p-value and then computed a z-score for the p-value divided by two. Consistent with practices in social psychology, all reported studies supported predictions, even when the results were not strictly significant. The success for p < .05 (two-tailed) was 100/105 = 95%, which has been typical for social psychology for decades (Sterling, 1959).
The z-scores were submitted to a z-curve analysis (Bartos & Schimmack, 2021; Brunner & Schimmack, 2020). The first part of a z-curve analysis is the z-curve plot (Figure 1).
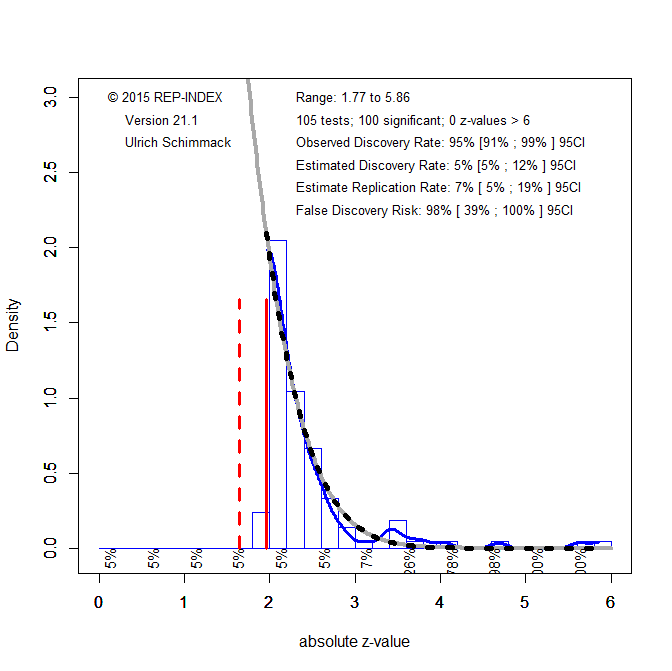
The vertical red line at z = 1.96 represents the significance criterion with alpha = .05 (two-tailed). The figure shows that most p-values are just significant with z-scores just above 1.96. The distribution of z-scores is abnormal in the sense that random sampling error alone cannot produce the steep drop on the left side of the significance criterion. This provides visual evidence of selection for significance.
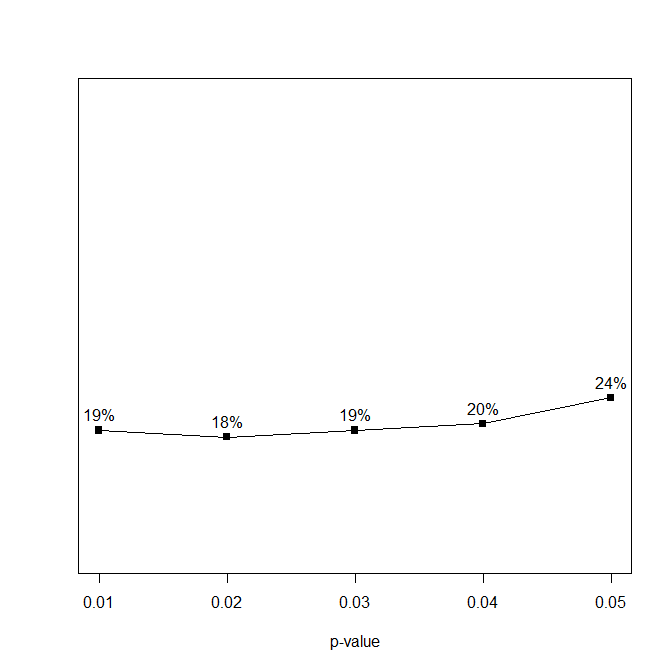
The second part of a z-curve analysis is to fit a finite mixture model to the distribution of the significant z-scores (z > 1.96). The model tries to match the distribution as closely as possible. The best fitting curve is shown with the grey/black checkered line. It is notable that the actual data decrease a bit more steeply than the grey curve. This shows a problem for the curve to fit the data even though the curve. This suggests that significance was obtained with massive p-hacking which produces an abundance of just significant results. This is confirmed with a p-curve analysis that shows more p-values between .04 and .05 than p-values between 0 and .01; 24% vs. 19%, respectively (Simonsohn et al., 2014).
The main implication of a left-skewed p-curve is that most significant results do not provide evidence against the null-hypothesis. This is confirmed by the z-curve analysis. A z-curve analysis projects the model based on significant results into the range of non-significant results. This makes it possible to estimate how many tests were conducted to produce the observed significant results (assuming a simple selection model). The results for these data suggest that that the reported significant results are only 5% of all statistical tests, which is what would be expected if only false hypotheses were tested. As a result, the false positive risk is 100%. Z-curve also computes bootstrapped confidence intervals around these estimates. The upper bound for the estimated discovery rate is 12%. Thus, most of the studies had a very low chance of producing a significant result (low power), even if they did not test a false hypothesis (low statistical power). With a low discover rate of 12%, the risk that a significant result is a false positive result is still 39%. This is unacceptably high.
The estimated replication rate of 7% is slightly higher than the estimated discovery rate of 5%. This suggests some heterogeneity across the studies which leads to higher power for studies that produced significant results. However, even 7% replicability is very low. Thus, most studies are expected to produce a non-significant result in a replication attempt.
Based on these results, it would be reasonable to burn everything to the ground and to dismiss the claims made in these 48 articles as empirically unfounded. However, it is also possible to reduce the false positive risk by increasing the significance threshold. With alpha = .01 the FDR is 19%, with alpha = .005 it is 10%, and with alpha = .001 it is 2%. So, to keep the false positive risk below 5%, it is possible to set alpha to .001. This renders most findings non-significant, but 10 findings remain significant.

One finding is evidence that liking of one’s initials has retest reliability. A more interesting finding is that 4 significant (p < .001) results were obtained in the most recent, 2016) article that also included pre-registered studies. This suggests that Dijksterhuis changed research practices in the wake of the replicability crisis. Thus, new articles that have not garnered a lot of citations may be more credible, but the pre-2011 articles lack credible empirical evidence for most of the claims made in these articles.
DISCLAIMER
It is nearly certain that I made some mistakes in the coding of Ap Dijksterhuis’s articles. However, it is important to distinguish consequential and inconsequential mistakes. I am confident that I did not make consequential errors that would alter the main conclusions of this audit. However, control is better than trust and everybody can audit this audit. The data are openly available and the z-curve code is also openly available. Thus, this replicability audit is fully transparent and open to revision.
Moreover, the results are broadly consistent with the z-curve results based on automated extraction of test statistics (Schimmack, 2021). Based on automated coding, Dijksterhuis has an EDR of 17, with a rank of 312 out of 357 social psychologists. The reason for the higher EDR is that automated coding does not distinguish focal and non-focal tests and focal tests tend to have lower power and a higher risk of being false positives.
If you found this audit interesting, you might also be interested in other replicability audits (Replicability Audits).

