In a blog post on Andrew Gelman’s blog, Erik van Zwet voiced serious concerns about the performance of z-curve, a meta-analytic method to detect selection bias. The main concern was that z-curve failed to detect selection bias in a scenario where most observed data come from high-powered studies (noncentrality parameter z = 4) but some come from tests of true H0 (effect size is zero, z = 0). In some cases, there may only be a couple of false positive results and that provides too little information about the file drawer of missing tests of H0).
The first problem that I already addressed is that EvZ’s criticism was invalid because it generalized from a single unrealistic scenario to all other situations and did not mention that z-curve had been validated and performed well in these situations (Schimmack, 2026).
Another selection bias in EvZ’s criticism of z-curve is that he only examined the performance of z-curve and did not compare it to the performance of other models. One advantage of z-curve is that it works even if there is little or no variation in sample sizes, which is a requirement for all regression based methods like Funnel plots, Eggert regression, or PET/PEESE. Thus, the most relevant competitor for z-curve are selection models like Vevea and Wood’s (2005) random-effects, step-function model implemented in the r-package weightr.
I tested the model using the same simulation design that was used to examine the performance of z-curve with identical data. Here I focus on the EvZ scenario where most statistically significant results come tests with high power (d = .6, N = 200, z ~ 4.24, power ~ 98%). Thus, there are few non-significant results that can be suppressed by publication bias.
All simulations had 70% selection bias. That is only 30% of the non-significant results were reported and the distribution was flat. First I examined the performance of weightr with k = 100 significant results. All 100 simulations failed to provide estimates of the selection weight for non-significant results. With k = 300 significant results, bias was detected 92% of the time. With k = 1,000, bias was detected in all 100 simulations.
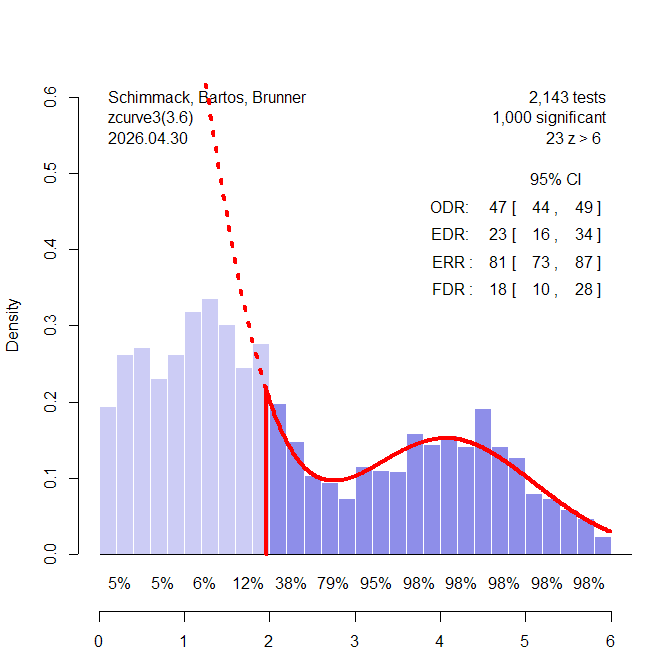
I then examined performance when 20% of the significant results are false positives – and the other 80% come from the same high-powered distribution as before. Figure 1 shows results for a run with k = 1,000 significant results for z-curve. With k = 1,000 z-curve has no problem detecting the selection bias because the distribution of the significant results is clearly bimodal with the mode for the studies with weak power in the non-significant range. Z-curve shows that there are more observed significant results, observed discover rate ODR = 47% than z-curve predicts based on the distribution of the significant results, expected discovery rate, EDR = 23%. The difference is highly significant, p < .000001.
In contrast, the step-function model falsely interprets the higher percentage of non-significant results as evidence that significant results are missing, w(p-value in .025 to .5 range) = 2.24, 95% 2.05 to 2.43. The reason is that the model does not allow for bimodal distributions and assumes a normal distribution of effect sizes, which also implies a normal distribution of z-values when sample sizes are fixed. This problem with the step-function selection model was already reported by Hedges & Vevea (1995). When the simulated data matched the assumed normal distribution, the model worked well. When the distribution did not match the assumed distribution, the model produced bias estimates. The advantage of z-curve is that it does not make a strong distribution assumption and allows for bimodal distributions like the one in Figure 1.
Conclusion
This blog post shows further evidence that EvZ’ expression of concerns about z-curve are biased and do not provide a balanced account of the strengths and weaknesses of z-curve. It is unreasonable to expect a model to perform well in an edge case that also provides problems for other models. In fact, z-curve handles the problem of bimodal distributions better than other models that assume unimodal distributions. If a heterogeneous literature contains a mixture of studies that tested true and false hypotheses, z-curve is actually the superior method and there are no alternatives because most meta-analytic methods were designed to analyze data where all studies are fairly similar and variation in population effect sizes is small. However, many meta-analyses in psychology show evidence of large heterogeneity and the true distribution of effect sizes across studies is unknown. For these kind of data, z-curve is currently the most appropriate statistical tool.