Category Archives: Open-SOEP

Open-SOEP: Personality and Wellbeing Revisited

[corrected 8/6/2019 5.29pm – there was a mistake in the model for worry]

After behaviorism banned emotions as scientific constructs and cognitivism viewed humans as computers, the 1980s witnessed the affective revolution. Finally, psychologists were again allowed to study feelings.

The 1980s also were a time where personality psychologists agreed on the Big Five as a unified model of personality traits. Accordingly, personality can be efficiently summarized by individuals’ standing on five dimensions: Neuroticism, Extraversion, Openness, Agreeableness, and Conscientiousness.

Not surprisingly, the 1980s also produced a model of personalty, emotions (affect), and well-being that has survived until today. The model was first proposed by Costa and McCrae in 1980 (see Schimmack, 2019, for details). This model assumed that extraversion is a disposition to experience more positive affect, neuroticism is a disposition to experience more negative affect, and the balance of positive and negative affect is a major determinant of life-satisfaction. As extraversion and neuroticism are independent dimensions, the model also assumed that positive affect and negative affect are independent, which led to the creation of the widely used Positive Affect and Negative Affect Schedule (Watson et al., 1988) as a measure of well-being.

The model also assumed that general affective dispositions account for most of the stability in well-being over time, while environmental factors produce only momentary and short-lived fluctuations around dispositional levels of well-being (Diener, 1984; Lykken & Tellgen, 1996). This model dominated well-being research in psychology for 20 years (see Diener, Suh, Lucas, & Smith, 1999, for a review).

However, when Positive Psychology emerged at the beginning of the new millenium, psychologists focus shifted from the influence of stable dispositions to factors that could be changed with interventions to boost individuals’ wellbeing (Seligman & Csikszentmihalyi, 2000) and some articles even questioned the influence of dispositions on well-being (Diener, Lucas, & Scollon, 1996). As a result, the past 20 years have seen very little new research on dispositional influences on well-being. The last major article is a meta-analysis that showed positive correlations of extraversion and neuroticism with several well-being indicators (Steel, Schmidt, & Shultz, 2008).

Revisiting the Evidence

There is robust evidence for the influence of neuroticism on wellbeing. Most important, this relationship has been demonstrated in multi-method studies that control for shared method variance when self-ratings of personality are correlated with self-ratings of well-being (McCrae & Costa, 1991; Schimmack, Oishi, Funder, & Furr, 2004). However, the relationship between extraversion and well-being is not as strong or consistent as one would expect based on Costa and McCrae’s (1980) model. For example, McCrae and Costa failed to find evidence for this relationship in a multi-method study, and other studies that controlled for response styles also failed to find the predicted effect (Schimmack, Schupp, & Wagner, 2008).

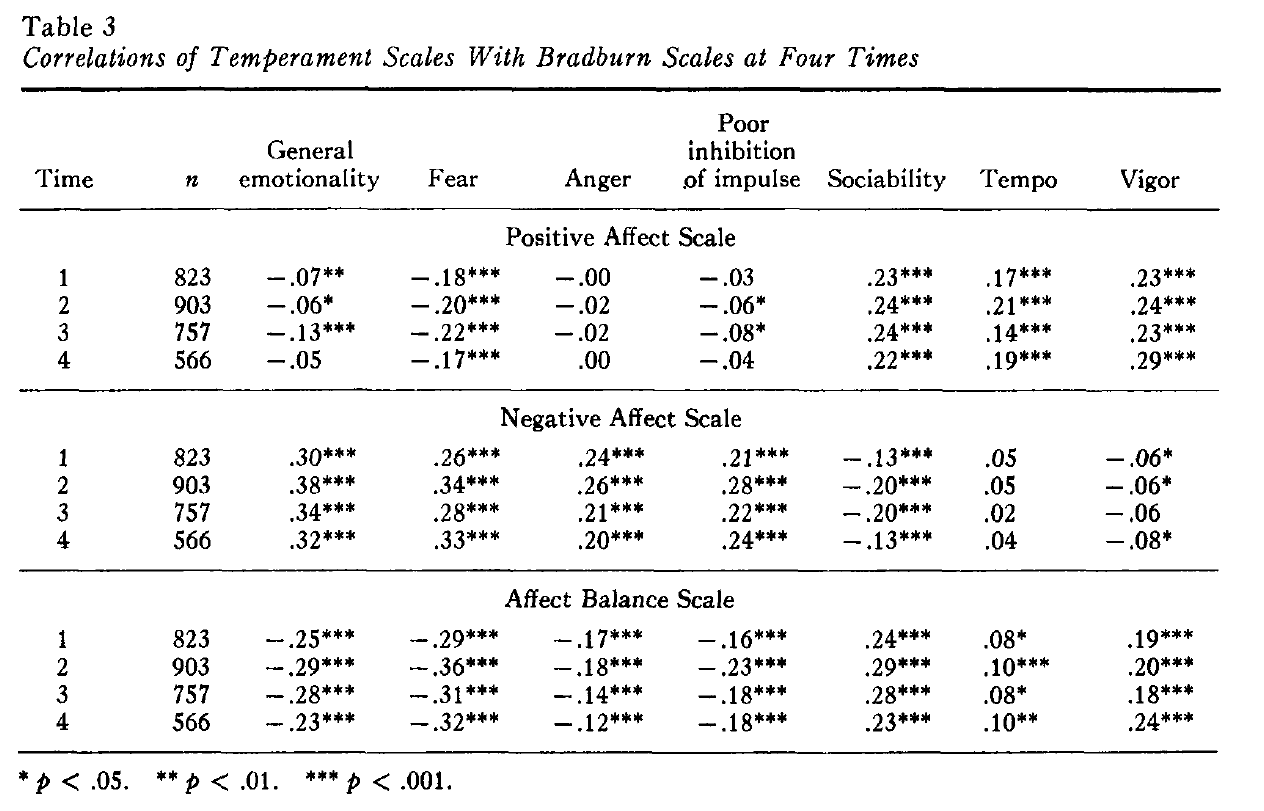
Taking a closer look at Costa and McCrae’s (1980) article, we see that they did not include life-satisfaction measures in their study. The key empirical finding supporting their model is that extraversion facets like sociabilty measured at time 1 predict positive affect and hedonic balance (positive affect minus negative affect) concurrently and longitudinally and that these correlations remain fairly stable over time. This suggests that personality is stable and contributes to the stable variance in the affect measures. However, the effect size is small (r = .22 to .24). This suggests that extraversion accounts for about 5% of the variance in affect. This finding hardly supports the claim that extraversion accounts for half of the stable variance in well-being.

It is symptomatic of psychology that subsequent articles run with the story while ignoring gaps in the actual empirical evidence. As longitudinal studies in psychology are rare, there have been few attempts to replicate Costa and McCrae’s findings.

Headey and Wearing (1989) replicated and extended Costa and McCrae’s study by including life-satisfaction measures as an indicator of wellbeing. They replicated the key findings and showed that personality also predicts future life-satisfaction. However, the effect size for extraversion was again fairly small; as was the effect of neuroticism, suggesting that most of the stable variance in life-satisfaction is not explained by extraversion and neuroticism.

A key limitation of both studies is that they do not take shared method variance into account. Although method variance may be transient, it is also possible that it is stable over time (Anusic et al., 2009). Thus, even the already modest effect sizes may still be inflated by shared method variance.

New Evidence

Data and Model

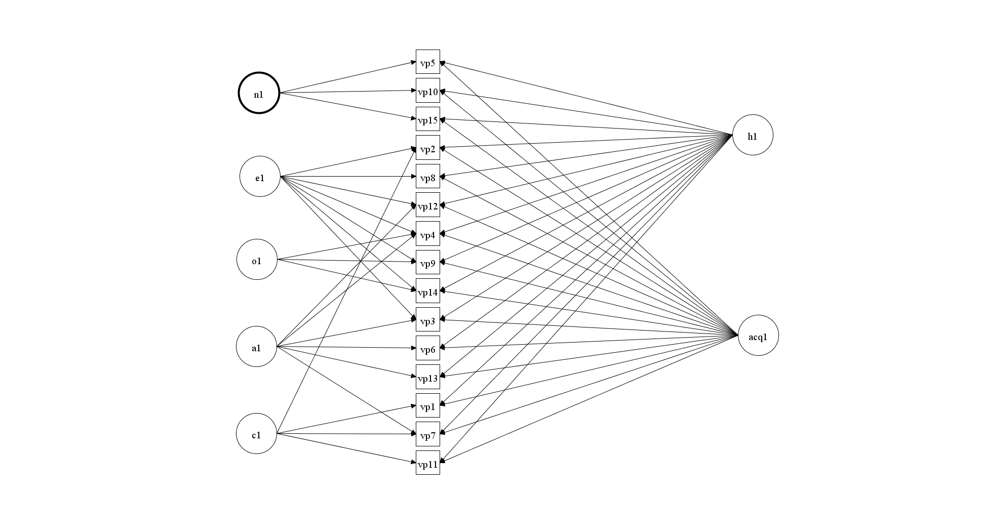
Fortunately, better data are now available to revisit the longitudinal relationships between personality and life-satisfaction. I used the data from the German Socio-Economic Panel (SOEP). The SOEP measured the Big Five personality traits on four occasions (waves) spanning a period of 12 years (2005, 2009, 2013, 2017). Personality was measured with the 15-item BFI-S. I created a measurement model for the BFI-S that shows measurement invariance across the four occasions (Schimmack, 2019a). I also related personality to the single-item life-satisfaction rating in the SOEP (Schimmack, 2019b). Here, I extend this analysis by taking advantage of the fourth measurement of personality in 2017, which makes it possible to separate trait and state variance in personality and well-being.

The SOEP measures life-satisfaction in two ways. First, it includes several domain-satisfaction items (health, finances, recreation, housing). Second, it includes a global life-satisfaction item. In a different post (Schimmack, 2019c), I examined the relationship between these items and found that global items are influenced by a general disposition factor and satisfaction with finances and health, while the other two domains are relatively unimportant. Based on this finding and related evidence (Zou, Schimmack, & Gere, 2013), I averaged the domain satisfaction judgments and used it as an indicator of life-satisfaction. This makes it possible to remove random measurement error from the measurement of life-satisfaction on a single occasion. I then fitted latent-trait-state (LST) models to the personality factors and the well-being factor. These models separate the longitudinal correlations into two components. A stable trait component and a changing state component. A third parameter estimates how stable state variance is over time.

There are several ways to relate personality to life-satisfaction in this model. I chose to predict life-satisfaction variance on each occasion to the personality variances on the same occasion. The model indirect function can then be used to examine how much of the variance is due to stable personality traits or due to personality states.

The availability of four waves of data also makes it possible to model stability of the residual variances in personality items. Typically, these residuals are allowed to correlate to allow for item-specific stability, but the use of correlated residuals makes it impossible to relate this variance to other constructs. With four waves, it is possible to fit an LST model to item-residuals. Exploration of the data showed that the neuroticism item “worry” showed consistent relationships with well-being. Thus, I fitted an LST model to this item and allowed for an influence of worry on life-satisfaction.

The synatax and the complete results are posted on OSF (SOEP.4W.B5.DSX.LS).

Results

Overall model fit was acceptable, CFI = .967, RMSEA = .019, SRMR = .030.

Trait Variance and Stability of State Variance

Table 1 shows the amount of trait variance and the stability of state variance in the personality predictor variables. A more detailed discussion of the implications of these results for personality research can be found elsewhere (Schimmack, 2019a). The results for the Big Five serve as a comparison for the trait variance in life-satisfaction.

TraitStability1Y-Stability
Neuroticism0.690.380.790.56
Extraversion0.740.380.780.51
Openness0.710.340.760.53
Agreeableness0.680.200.670.57
Conscientiousness0.600.290.730.64
Halo0.600.360.780.63
Acquiescence0.340.110.580.81
Worry0.640.520.850.60

Table 2 shows how life-satisfaction at each time point is related to personality predictors. For model identification purposes, it is necessary to fix one relationship to zero. I used openness because meta-analysis show that it is the weakest predictor of life-satisfaction (Steel et. al., 2008). I did not impose constraints across the four waves.

LS-T1LS-T2LS-T3LS-T4
Neuroticism-0.29-0.27-0.27-0.26
Extraversion0.080.070.080.09
Openness
Agreeableness0.080.050.040.03
Conscientiousness0.040.040.040.04
Halo0.190.280.240.26
Acquiescence0.180.080.120.16
Worry-0.35-0.34-0.35-0.33

The results show that out of the Big Five, neuroticism is the only notable predictor of life-satisfaction with a moderate effect size (r = -.26 to -.29). A notable finding is that extraversion is a weak predictor of life-satisfaction (r = .07 to .09). This finding is inconsistent with Costa and McCrae’s (1980) model. The results for agreeableness and conscientiousness are also weak. This finding is inconsistent with meta-analysis and with McCrae and Costa’s (1991) suggestion that high agreeableness and conscientiousness are also instrumental for higher life-satisfaction. Both halo and acquiescence bias are stronger predictors of life-satisfaction judgments than extraversion, agreeableness, and conscientiousness. Another notable finding is that the worry-facet of neuroticism is the strongest personality predictor; even stronger than the neuroticism factor (rs = -.33 to -.35). This finding is consistent with previous studies that facets of neuroticism and extraversion are better predictors of life-satisfaction than the global factors (Schimmack, Oishi, Funder, & Furr, 2004).

Table 3 shows how much of the variance in life-satisfaction is explained by trait factors that remain stable over time.

LS-T1LS-T2LS-T3LS-T4
Neuroticism0.050.050.050.05
Extraversion0.000.000.000.01
Openness
Agreeableness0.000.000.000.00
Conscientiousness0.000.000.000.00
Halo0.020.040.030.04
Acquiescence0.010.000.000.01
Worry0.080.080.080.07
Unexplained0.380.380.380.38
Total0.550.560.560.55

Given the weak effects of extraversion, agreeableness, and conscientiousness, it is not surprising that these Big Five traits explain less than 1% of the variance in life-satisfaction judgments. The only notable predictor is neuroticism, which explains 5-6% of the variance. In addition, the worry facet of neuroticism is an even stronger predictor of trait variance in life-satisfaction. This finding shows that more specific traits below the Big Five add to the prediction of life-satisfaction (Schimmack, Oishi, Furr, & Funder, 2004). Halo adds only 2% and acquiescence only 1%. By far the largest portion of the trait variance was unexplained with 41% of the variance. Combined this implies that approximately half of the variance in life-satisfaction is trait variance. This finding is consistent with estimates in a meta-analysis and other analyses of the SOEP data (Anusic & Schimmack, 2016; Schimmack, Krupp, Wagner & Schupp, 2010). The estimate of 55% trait variance is also smaller than the estimate of 70% trait variance in the Big Five personality traits. This finding is also consistent with meta-analytic comparison of personality and well-being measures (Anusic & Schimmack, 2016).

Table 4 shows the results for the state-predictors of life-satisfaction. Once more extraversion, agreeableness, and conscientiousness predict less than 1% of the variance. This time, neuroticism and worry are also relatively weak predictors because most of the relationship for this traits stems from the stable component. However, the results suggest that some changes in neuroticism and worry are related to changes in life-satisfaction. However, most of the state variance in life-satisfaction is not explained by the personality predictors (33% out of 44%).

LS-T1LS-T2LS-T3LS-T4
Neuroticism0.020.020.020.02
Extraversion0.000.000.000.00
Openness
Agreeableness0.000.000.000.00
Conscientiousness0.000.000.000.00
Halo0.010.030.020.03
Acquiescence0.020.000.010.02
Worry0.040.040.040.04
Unexplained0.330.340.340.34
Total0.440.440.440.45

Conclusion

These results challenge Costa and McCrae’s (1980) model of personality and well-being in several ways. First, extraversion is not a strong predictor of the stable variance in life-satisfaction. Second, even the influence of neuroticism accounts for only 10% of the stable trait variance in life-satisfaction. Adding other Big Five predictors also does not help because they have negligible relationships with life-satisfaction. Thus, most of the trait variance in life-satisfaction remains unexplained. It is either explained by more specific personality traits than the Big Five (facets) or by stable environmental factors (e.g., income). The SOEP data provide ample opportunity to look for additional predictors of trait variance. Also, researchers should conduct studies with broader personality questionnaires to find additional predictors of life-satisfaction. Searching for these predictors is an important area of research in an area that has stagnated over the past two decades.

Costa and McCrae’s model also underestimated the importance of state-factors. State factors are highly stable over fairly long periods of times and account for 50% of the reliable variance in life-satisfaction. As the Big Five mostly reflect stable traits, they cannot account for this important variance in life-satisfaction. Schimmack and Lucas (2010) argued that these factors are environmental factors because changes in life-satisfaction are shared between spouses. Thus, changes in actual life-circumstances may contribute to state variance in life-satisfaction. Consistent with this model, spouses were more similar in domains that are shared (housing, income) than in domains that are less shared (health, recreation).

Evidently, the conclusions are based on a single German sample. As impressive as these data are, it is important to compare results across samples from different populations. At least regarding the influence of extraversion, the present results are consistent with other studies that suggest the influence of extraversion on life-satisfaction (Kim, Schimmack, & Tsutsui, 2019). The idea that extraverts are happier has been exaggerated by Costa and McCrae’s model, while their own empirical results did not warrant this claim. The reason is that psychologists often ignore effect sizes.

Implications

The present results also have implications for developmental theories of personality. The idea of development is a process with an ideal outcome. For humans, the outcome is an adult human being with optimal capabilities. A collective of personality psychologists suggested that optimal personality development results in a personality type with optimal personality characteristics. I criticized this idea and argued that there is no such thing as an optimal personality. Just like there is no optimal height as the end-goal of human growth, there is no optimal level of extraversion or conscientiousness. In clinical psychology, the key criterion of mental health is that an intervention is beneficial for a patients’ well-being. Thus, we could argue that an optimal personality is a personality that maximizes individuals’ well-being. Meta-analyses suggests that extraveted, agreeable, and conscientious people have higher well-being. Thus, it might be beneficial for individuals to become more extraverted, agreeable, and conscientious. However, the present results challenge this view. After removing the evaluative aspect of personality from the Big Five only neuroticism remains a notable predictor of well-being. Thus, the key personality trait for self-improvement is neuroticism. Not surprisingly, this is also the key aspect that is targeted in self-help books and well-being programs. Until we have a better understanding of the relationship between personality and well-being, it seems premature to propose interventions that are aimed at changing individuals’ personality. Just like personality psychologists no longer endorse conversion therapy for sexual orientation, I urge for caution in submitting individuals who are carefree and impulsive to a conscientiousness conversion program. You never know when acting on the spur of a moment is the best course of action.

Open-SOEP: No Significant Personality Change over 12 Years

Studying personality stability and change is easy and hard. It is easy because the method is straightforward. Administer a valid measure of personality to a group of participants and repeat the measurement several times. Describing the method takes a sentence or two compared to pages that describe an intricate laboratory experiment with an elaborate deception. It is hard because it requires time and participants may drop out of a study. Meanwhile there is nothing to publish while a researcher is waiting for the next retest. In our fast paced world of academic publishing where researchers are expected to publish 5 or more articles a year, there is no place for slow research. As a result, evidence on personality change is scarce. The best evidence so far comes from a meta-analysis that patched together small studies with different measures, populations, and small samples. Although this meta-analysis is the best evidence available, it cannot be trusted because the evidence is inconclusive.

Psychologists have to thank economists and sociologists who are used to collaborate on big data collections. One of these collaborations is the German Socio-Economic Panel (SOEP). The SOEP is an ongoing longitudinal study with a representative sample that started in 1984. In 2005, the SOEP included the BFI-S; a 15-item personality measure that assesses the Big Five. Since then, the BFI-S has been administered in four-year intervals in 2009, 2013, and 2017. Thus, we now have longitudinal data spanning 12-years with four waves of data. This makes it possible to revisit the question of personality stability with much better data than a meta-analysis of heterogeneous studies can provide. Surely, the results are based on a German sample, but there is little evidence that personality development varies across cultures.

Method

One drawback of the SOEP is that each personality dimension is measured with just three items. This makes scale scores unreliable and scale scores can be contaminated with method variance (e.g., evaluative bias, acquiescence bias). To avoid these problems and to examine measurement invariance, it is better to analyze the data with a measurement model that examines personality change at the level of latent variables that correct for measurement error. I developed a measurement model for the SOEP (Schimmack, 2019a) and I already demonstrated invariance across the first three waves of the SOEP (Schimmack, 2019b). Here I added the fourth wave of data from 2017 to the dataset to produce even better information about long-term changes in personality.

To analyze the data, I first fitted the measurement model for the BFI-S to the data from each wave and imposed equality constraints to ensure measurement invariance. The longitudinal stability of personality was examined using the latent-trait-state (LTS) model that decomposes stability over time into two components; (a) a stable trait component that never changes and (b) a changing state component. The changing state component allows for factors that influence personalty to change over time and to change personality. These changing factors may produce changes that last a long time or changes that are more temporary. The time course of changes in personality is modeled with an autoregressive parameter that reflects how many of the changes at time 1 are still present at time 2.

The LTS model is typically fitted without modeling mean level changes. However, the model can also be used to model the mean structure in the data. In latent variable models, changes in personality are assumed to occur at the level of the latent traits, while item means (intercepts) are assumed to be constant over time. As the latent trait is stable, it cannot be used to model mean-level changes. Thus, one option is to free the means of the state factors. However, the influence of the state factors decreases over time, which is inconsistent with the idea of lasting changes in personality. Thus, a better option is to let the means of the occasion specific factors to vary freely, even if the occasion specific variance is zero. Although this model may lack realism, it would show the pattern of mean level changes in the data without imposing some model on the data (e.g., a linear trend).

The model specification and the complete results can be found on OSF (ttps://osf.io/vpcfd/). The overall model fit was acceptable, CFI = .971, RMSEA = .019, SRMR = .031.

Rank-order Stability and Change

A study of the first three waves in the SOEP replicated earlier findings of high retest stability in personality with stabilities over .9 over a one-year period (Conley, 1984; Schimmack, 2019c). However, three ways are insufficient to separate trait variance from state variance, and few studies with four waves of personality are available. Anusic and Schimmack (2016) used a meta-analytic approach to do so on the basis of smaller studies. Their model suggested that about 70% of the reliable variance in personality is trait variance and that the remaining 30% state variance are rather unstable with a low annual stability of .3. This would suggest that any changes in personality do not last long and individuals quickly revert back to their trait level of personality.

Table 1 shows the results for the SOEP data.

TraitStability1Y-Stability
Neuroticism0.670.380.79
Extraversion0.740.360.77
Openness0.710.380.79
Agreeableness0.690.180.65
Conscientiousness0.640.240.70
Halo0.640.310.75
Acquiescence0.320.100.56

The results show a similar split between trait and state variance as the meta-analysis, with about two-thirds of the variance being trait variance and one-third being state variance. A new finding is that the halo factor, an evaluative bias in personality ratings, also has 60% trait variance. Thus, this response style can also be considered a stable trait. In contrast, acquiescence bias has less trait variance and seems to be more influenced by momentary factors that are inconsistent over time.

The results for the stability of the state variance are different from the meta-analysis. The SOEP data suggest that changes in personality are more persistent than the meta-analysis suggested. The annual stability estimates are around .7. Thus, any changes that are evident at time 2 would still be evident over the next years. The stability over 4-years is around .3. These results are more encouraging for researchers who are interested in personality change than the meta-analytic results in Anusic and Schimmack, 2016). Nevertheless, the relatively small amount of state variance and the high stability of the state variance imply that it takes time to find even small changes in personality. Not surprisingly, it has been difficult to uncover predictors of personality change even in large samples like the SOEP (Specht et al., 2011).

In sum, the results confirm that personality ratings are highly stable over extended periods of time and that a large portion of this stability is caused by stable factors that ensure persistent individual differences in personality over the life span.

Mean Levels

Table 2 shows the results for the mean levels. Means in the first year, 2005, are used as the reference group. The results provide little evidence for personalty change in adulthood. None of the Big Five dimensions shows a consistent trend over time. The results for conscientiousness are most important because a meta-analysis suggested that conscientiousness increases substantially throughout adulthood. There is no evidence for such a trend in the SOEP.

NEOAC
20050.000.000.000.000.00
2009-0.13-0.12-0.16-0.18-0.07
2013-0.18-0.03-0.04-0.08-0.06
2017-0.16-0.06-0.05-0.11-0.26

The general pattern of decreases for all five dimensions suggests that acquiescence bias might have changed over time. Thus, I also fitted a model with free means for acquiescence bias but the results did not change. Thus, it does not account for the small decrease in the Big Five. Adding means for the halo factor, instead, reduces changes for most scales, but would suggest a stronger decrease in neuroticism. However, the pattern is never a gradual change, but a drop from time 1 to time 2 with no major changes afterwards. This suggests that some panel effect or period effects have small effects on personality ratings, but there is no evidence to support the claim that personality systematically changes throughout adulthood.

Conclusion

Personality research was attacked by situationists who claimed that personality is a mere social construction. In the 1980s, personality researchers had presented evidence that personality traits are real and stable using twin studies, multi-rater studies, and longitudinal studies. However, two meta-analysis by Roberts and colleagues suggested that personality exists but is less stable than personality psychologists assumed. These meta-analysis had a strong influence on personality psychology in the 2000s. They are featured in personality textbooks and often cited as evidence that personality still develops throughout adulthood. However, more recent evidence are more consistent with the view of personality as mostly stable throughout adulthood. Costa and McCrae famously compared personality to plaster. While it can be shaped and molded early on, it finally sets into a shape that can not be altered. Yes, there may be cracks here and there, but the overall shape is set. While this image may be too rigid, it is consistent with the evidence that even major life-events that occur during adulthood seem to have very little influence on personality (Specht et al., 2011).

The idea of personalty change is often coupled with the notion that personality develops and that there can be personal growth in adulthood. The problem with these notions is that it implies that there is a normative or desirable direction of personality change. For example, an increase in conscientiousness is seen as evidence of growing maturity. However, the measurement model that I used distinguishes between the denotative and connotative aspects of personality. Lazy is both descriptive and evaluative. However, evaluations are rooted in cultural norms and values. Why is it good to work as much as possible, to avoid mistakes at any costs? Should education and policies try to increase conscientiousness levels? Is there an optimal level? These are all very difficult questions that go well beyond the existing science of personality. Once we focus on the denotative aspect of personality, we see that some people work harder than others or that some people are more creative than others, and that these differences are fairly stable, without any evidence what causes this stability. Just like people differ in personality, they differ in other characteristics that have received more attention. Current culture aims towards greater acceptance of differences in sexual orientation, gender identity, body types, religion, etc. Maybe we should also include personalty traits there and let introverts be proud introverts and disagreeable people be proud disagreeable people. Maybe personality differences only exist because they were not a problem during human evolution or diversity is even an advantage that allows humans as a group to adapt to different circumstances. Thus, the strong evidence of personality stability is not necessary a problem that needs to be solved because there is normal personality. There is only normal variation in personality.

Measuring Well-Being in the SOEP

Psychology has a measurement problem. Big claims about personality, self-esteem, or well-being are based on sum-scores of self-ratings; or sometimes a single rating. This would be a minor problem if thorough validation research had demonstrated that sum-scores of self-ratings are valid measures of the constructs they are intended to represent, but such validation research is often missing. As a result, the validity of widely used measures in psychology and claims based on these measures is unknown.

The well-being literature is an interesting example of the measurement crisis because two opposing views about the validity of well-being measures co-exist. On the one hand, experimental social psychologists argue that life-satisfaction ratings are invalid and useless (Schwarz & Strack, 1999); a view that has been popularized by Noble Laureate Daniel Kahneman in his book “Thinking: Fast and Slow” (cf. Schimmack, 2018). On the other hand, well-being scientists often assume that life-satisfaction ratings are near perfect indicators of individuals’ well-being.

An editor of JPSP, which presumably means he or she is an expert, has no problem to mention both positions in the same paragraph without noting the contradiction.

There is a huge literature on well-being. Since Schwarz and Strack (1999), to take that arbitrary year as a starting point, there have been more than 11,000 empirical articles with “wellbeing” (or well-being or well being) in the title, according to PsychInfo. The vast majority of them, I submit, take the subjective evaluation of one’s own life as a perfectly valid and perhaps the best way to assess one’s own evaluation of one’s life. “

So, since Schwarz and Strack concluded that life-satisfaction judgments are practically useless, 11,000 articles have used life-satisfaction judgments as perfectly valid measures of life-satisfaction and nobody thinks this is a problem. No wonder, natural scientists don’t consider psychology a science.

The Validity of Well-Being Measures

Any attempt at validating well-being measures requires a definition of well-being that leads to testable predictions about correlations of well-being measures with other measures. Testing these predictions is called construct validation (Cronbach & Meehl, 1955; Schimmack, 2019).

The theory underlying the use of life-satisfaction judgments as measures of well-being assumes that well-being is subjective and that (healthy, adult) individuals are able to compare their actual lives to their ideal lives and to report the outcome of these comparison processes (Andrews & Whithey, 1973; Diener, Lucas, Schimmack, & Helliwell, 2009).

One prediction that follows from this model is that global life-satisfaction judgments should be correlated with judgments of satisfaction in important life domains, but not in unimportant life domains. The reason is that satisfaction with life as a whole should be related to satisfaction with (important) parts. It would make little sense for somebody to say that they are extremely satisfied with their life as a whole, but not satisfied with their family life, work, health, or anything else that matters to them. The whole point of asking a global question is the assumption that people will consider all important aspects of their lives and integrate this information into a global judgment (Andrews & Whithey, 1973). The main criticism of Schwarz and Strack (1999) was that this assumption does not describe the actual judgment process and that actual life-satisfaction judgments are based on transient and irrelevant information (e.g., current mood, Schwarz & Clore, 1983).

Top-Down vs. Bottom-Up Theories of Global and Domain Satisfaction

To muddy the waters, Diener (1984) proposed on the one hand that life-satisfaction judgments are, at least somewhat, valid indicators of life-satisfaction, while also proposing that correlations between satisfaction with life as a whole and satisfaction with domains might reflect a top-down effect.

A top-down effect implies that global life-satisfaction influences domain satisfaction. That is, health satisfaction is not a cause of life-satisfaction because good health is an important part of a good life. Instead, life-satisfaction is a content-free feeling of satisfaction that creates a halo in evaluations of specific life aspects independent of the specific evaluations of a life domain.

Diener overlooked that top-down processes invalidate life-satisfaction judgments as valid measures of wellbeing because a top-down model implies that global life-satisfaction judgments reflect only a general disposition to be satisfied without information about the actual satisfaction in important life domains. In the context of a measurement model, we can see that the top-down model implies that life-satisfaction judgments only capture the shared variance among specific life-satisfaction judgments, but fail to represent the part of satisfaction that reflects unique variance in satisfaction with specific life domains. In other words, top-down models imply that well-being does not encompass evaluations of the parts that make up an individuals entire life.

The problem that measurement models in psychology often consider unique or residual variances error variances that are often omitted from figures does not help. In the figure, the residual variances are shown and represent variation in life-aspects that are not shared across domains.

Some influential articles that examined top-down and bottom-up processes have argued in favor of top-down processes without noticing that this invalidates the use of life-satisfaction judgments as indicators of well-being or at least requires a radically different conception of well-being (well-being is being satisfied independent of how things are actually going in your life) (Heller, Watson, & Ilies, 2004).

An Integrative Top-Down vs. Bottom-Up Model

Brief et al. (1993) proposed an integrative model of top-down and bottom-up processes in life-satisfaction judgments. The main improvement of this model was to distinguish between a global disposition to be more satisfied and a global judgment of important aspects of life. As life-satisfaction judgments are meant to represent the latter, life-satisfaction judgments are the ultimate outcome of interest, not a measure of the global disposition. Brief et al. (1993) used neuroticism as an indicator for the global disposition to be less satisfied, but there are probably other factors that can contribute to a general disposition to be satisfied. The integrative model assumes that any influence of the general disposition is mediated by satisfaction with important life domains (e.g., health).

FIGURE 1. DisSat = Dispositional Satisfaction, DS1 = Domain Satisfaction 1 (e.g., health), DS2 = Domain Satisfaction 2, DS3 = Domain Satisfaction 3, LS = Life-Satisfaction.

It is important to realize that the mediation model separates two variances in domain satisfaction judgments, namely the variance that is explained by dispositional satisfaction and the variance that is not explained by dispositional satisfaction (residual variance). Both variances contribute to life-satisfaction. Thus, objective aspects of health that contribute to health satisfaction can also influence life-satisfaction. This makes the model an integrative model that allows for top-down and bottom-up effects.

One limitation of Brief et al.’s (1993) model was the use of neuroticism as sole indicator of dispositional satisfaction. While it is plausible that neuroticism is linked to more negative perceptions of all kinds of life-aspects, it may not be the only trait that matters.

Another limitation was the use of a health satisfaction as a single life domain. If people also care about other life domains, other domain satisfactions should also contribute to life-satisfaction and they could be additional mediators of the influence of neuroticism on life-satisfaction. For example, neurotic individuals might also worry more about money and financial satisfaction could influence life-satisfaction, making financial satisfaction another mediator of the influence of neuroticism on life-satisfaction.

One advantage of structural equation modeling is the ability to study constructs that do not have a direct indicator. This makes it possible to examine top-down effects without “direct” indicators of dispositional satisfaction. The reason is that dispositional satisfaction should influence satisfaction with various life domains. Thus, dispositional satisfaction is reflected in the shared variance among different domain satisfaction judgments and domain satisfaction judgments serve as indicators that can be used to measure dispositional satisfaction (see Figure 2).

Domain Satisfactions in the SOEP

It is fortunate that the creators of the Socio-Economic Panel in the 1980s included domain satisfaction measures and that these measures have been included in every wave from 1984 to 2017. This makes it possible to test the integrative top-down bottom-up model with the SOEP data.

The five domains that have been included in all surveys are health, household income, recreation, housing, and job satisfaction. However, job satisfaction is only available for those participants who are employed. To maximize the number of domains, I used all five domains and limited the analysis to working participants. The model can be used to build a model with four domains for all participants.

One limitation of the SOEP is the use of single-item indicators. This makes sense for expensive panel studies, but creates some psychometric problems. Fortunately, it is possible to estimate the reliability of single-item indicators in panel data by using Heise’s (1969) model which estimates reliability based on the pattern of retest correlations for three waves of data.

REL = r12 * r23 / r13

More data would be better and are available, but the goal was to combine the well-being model with a model of personality ratings that are available for only three waves (2005, 2009, & 2013). Thus, the same three waves for used to create an integrative top-down bottom-up model that also examined how domain satisfaction is related to global life-satisfaction across time.

The data set consisted of 3 repeated measures of 5 domain satisfaction judgments and a single life-satisfaction judgments for a total of 18 variables. The data were analyzed with MPLUS (see OSF for syntax and detailed results https://osf.io/vpcfd/ ).

Results

Overall model fit was acceptable, CFI = .988, RMSEA = .023, SRMR = .029.

The first results are the reliability and stability estimates of the five domain satisfactions and global life satisfaction (Table 1). For comparison purposes, the last column shows the estimates based on a panel analyses with annual retests (Schimmack, Krause, Wagner, & Schupp, 2010). The results show fairly consistent stability across domains with the exception of job satisfaction. Job satisfaction is less stable than other domains. The four-year stability is high, but not as high as for personality traits (Schimmack, 2019). A comparison with the panel data shows higher stability, which indicates that some of the error variance in 4-year retest studies is reliable variance that fluctuates over the four-year retest period. However, the key finding is that there is high stability in domain satisfaction judgments and life-satisfaction judgments. which makes it theoretically interesting to examine the relationship between the stable variances in domain satisfaction and life-satisfaction.

ReliabilityStability1Y-StabilityPanel
Job Satisfaction0.620.620.89
Health Satisfaction0.670.790.940.93
Financial Satisfaction0.740.810.950.91
Housing Satisfaction0.660.810.950.89
Leisure Satisfaction0.670.800.950.92
Life Satisfaction0.660.780.940.89

Table 2 examines the influence of top-down processes on domain satisfaction. Results show the factor loadings of domain satisfaction on a common factor that reflects dispositional satisfaction; that is, a general disposition to report higher levels of satisfaction. The results show that somewhere between 30% and 50% of the reliable variance in life-satisfaction judgments is explained by a general disposition factor. While this leaves ample room for domain-specific factors to influence domain satisfaction judgments, the results show a strong top-down influence.

T1T2T3
Job Satisfaction0.690.680.68
Health Satisfaction0.680.660.65
Financial Satisfaction0.600.610.63
Housing Satisfaction0.720.740.76
Leisure Satisfaction0.610.610.61

Table 3 shows the unique contribution of the disposition and the five domains to life-satisfaction concurrently and longitudinally.

DS1-LS1DS1-LS2DS1-LS3DS2-LS2DS2-LS3DS3-LS3
Disposition0.560.590.570.610.590.60
Job 0.140.100.050.170.080.12
Health0.230.220.210.280.270.33
Finances0.340.200.140.240.180.22
Housing0.040.030.030.040.040.06
Leisure0.060.100.060.130.070.09

The first notable finding is that the disposition factor accounts for the lion share of the explained variance in life-satisfaction judgments. The second important finding is that the relationship is very stable over time. The disposition measured at time 1 is an equally good predictor of life-satisfaction at time 1 (r = .56), time 2 (r = .59), and at time 3 (r = .57). This suggests that about one-third of the reliable variance in life-satisfaction judgments reflects a stable disposition to report higher or lower levels of satisfaction.

Regarding domain satisfaction, health is the strongest predictor with correlations between .21 and .33. Finances is the second strongest predictor with correlations between .14 and .34. For health satisfaction there is high stability over time. That is, time 1 health satisfaction predicts time 1 life-satisfaction nearly as well (r = .23) as time 3 life-satisfaction (r = .21). In contrast, financial satisfactions shows a bit more change over time with concurrent correlations at time 1 of r = .34 and a drop to r = .14 for life-satisfaction at time 3. This suggests that changes in financial satisfaction produces changes in life-satisfaction.

Job satisfaction has a weak influence on life-satisfaction with correlations ranging from r = .14 to .05. Like financial satisfaction, there is some evidence that changes in job satisfaction predict changes in life-satisfaction.

Housing and leisure have hardly any influence on life-satisfaction judgments with most relationships being less than .10. There is also no evidence that changes in these domain produce changes in life-satisfaction judgments.

These results show that most of the reliable variance in global life-satisfaction judgments remains unexplained and that a stable disposition accounts for most of the explained variance in life-satisfaction judgments.

Implications for the Validity of Life-Satisfaction Judgments

There are two ways to interpret the results. One interpretation is that is common in the well-being literature and hundreds of studies with the SOEP data is that life-satisfaction judgments are valid measures of well-being. Accordingly, well-being in Germany is determined mostly by a stable disposition to be satisfied. Accordingly, changing actual life-circumstances will have negligible effects on well-being. For example, Nakazato et al. (2011) used the SOEP data to examine the influence of moving on well-being. They found that decreasing housing satisfaction triggered a decision to move and that moving produces lasting increases in housing satisfaction. However, moving had no effect on life-satisfaction. This is not surprising given the present results that housing satisfaction has a negligible influence on life-satisfaction judgments. Thus, we would conclude that people are irrational by investing money in a better house, if we assume that life-satisfaction judgments are a perfectly valid measure of well-being.

The alternative interpretation is that life-satisfaction judgments are not as good as well-being researchers think they are. Rather than reflecting a weighted summary of all important aspects of life, they are based on accessible information that does not include all relevant information. The difference to Schwarz and Strack’s (1999) criticism is that bias is not due to temporarily accessible information (e.g., mood) that makes life-satisfaction judgments unreliable. As demonstrated here and elsewhere, a large portion of the variance in life-satisfaction judgments is stable. The problem is that the stable factors may be biases in life-satisfaction ratings rather than real determinants of well-being.

It is unfortunate that psychologist and other social sciences have neglected proper validation research of a measure that has been used to make major empirical claims about the determinants of well-being, and that this research has been used to make policy recommendation (Diener, Lucas, Schimmack, & Helliwell, 2009). The present results suggest that any policy recommendations based on life-satisfaction ratings alone are premature. It is time to take measurement more seriously and to improve the validity of measuring well-being.

Personality and Health- Satisfaction in the SOEP

Research on personality and health has a long tradition. Some research provides support for the concept of a hypochondriac personality. That is, some people react to physical symptoms with extreme distress and they tend to exaggerate the severity of symptoms or their consequences (see Seinfeld episode as an example, clip). Watson and Pennebaker (1989) found that neuroticism is consistently related to subjective health perceptions. Not surprisingly, neuroticism is also a predictor of health-satisfaction ratings (Brief et al., 1993).

One open question in wellbeing science is how personality is related to domain satisfaction (Diener, Lucas, & Oishi, 2018). One possibility is that personality traits like neuroticism influence global life-satisfaction judgments and that global life-satisfaction influences satisfaction with specific life domains. According to this model, life-satisfaction would mediate the relationship between neuroticism and health satisfaction (Heller, Watson, & Illies, 2004). The alternative model assumes that personality influences domain satisfaction and that satisfaction with important life domains leads to higher overall life-satisfaction (Brief et al., 1993; Schimmack, Oishi, & Diener, 2002). So far, empirical studies have been unable to settle these opposing views of the relationship between life-satisfaction and domain satisfaction. The SOEP data provide a unique opportunity in making progress on this front because personality, life-satisfaction and domain satisfaction have been assessed in three waves over an eight-year period.

I already posted analyses of life-satisfaction and job satisfaction (Schimmack, 2019a, 2019b). Here, I present the results for health satisfaction. These results will be used to build a larger model with multiple domains in a single model. The model is identical to the model that was used to analyze life-satisfaction (see OSF for code and detailed results; https://osf.io/vpcfd/ ). Model fit was acceptable, CFI = .97, RMSEA = .022, SRMR = .030.

Results

Observed stability was r = .54 from 2005 to 2009, r = .54 from 2009 to 2013, and r = .48 from 2005 to 2009. It is remarkable that the retest correlation spanning 8 years is just slightly lower than the 4-year retest correlations. Using Heise’s formula, this implies low reliability and high stability; REL = .54*.54/.48 = .61, 8-year stability = .48/.61 = .79. The reliability estimate is consistent with estimates based on annual assessments (Schimmack, Schupp, & Wagner, 2008). Thus, health satisfaction is rather stable and it is worthwhile to examine the predictors of stability in health satisfaction.

Personality measured at Time 1 was used as a predictor of health satisfaction at times 1 to 3. If personality contributes to stability in health satisfaction, personality traits should predict health satisfaction concurrently and prospectively. The results in Table 1 show that this was the case for neuroticism. The remaining personality traits were weak predictors of health satisfaction. Halo bias also predicted stability in health satisfaction but the effect was small and decreased over time. Overall, these results are consistent with the hypochondriac hypothesis.

JS-T1JS-T2JS-T3
Neuroticism-039-0.32-0.31
Extraversion0.080.080.08
Openness
Agreeableness0.090.090.07
Conscientiousness0.030..040..03
Halo0..200.190.14
Acquiescence

Table 2 examines whether changes in personality predict changes in health satisfaction. To do so, health satisfaction was regressed on the residual variances in personality at times 2 and 3.

JS-T2JS-T3
Neuroticism-0.14-0.22
Extraversion 0.010.06
Openness
Agreeableness-0.06-0.02
Conscientiousness0.020.01
Halo0.190.24
Acquiescence

As before, neuroticism and halo bias were the only notable predictors of change in health satisfaction. The results for halo bias show that health satisfaction ratings change as respondents tendencies to respond positively change. The results for neuroticism are more dfficult to interpret. Maybe changes in health status produce changes in neuroticism or changes in neuroticism produce changes in health perceptions. More complex models are needed to disentangle these complex relationships.

The final result was the stability of the residual variance in job satisfaction that is not explained by personality – as measured in the SOEP. Stability estimates were r = .86 and r = .86 over the 4-year intervals with an implied stability of r = .75 over the 8-year interval. Thus, personality is just one predictor of stability in health satisfaction and it contributes a relatively small amount to stability in job satisfaction. Other factors like objective health status may also contribute to stability in health satisfaction.

Conclusion

The results are largely consistent with previous evidence that neuroticism is the main predictor of health satisfaction (Brief et al., 1993). The results show that this relationship holds concurrently and prospectively over an eight-year period and that it holds while controlling for shared method variance in personality and health ratings. These results will be used for a more complex model that can distinguish between top-down and bottom-up effects of health satisfaction and life-satisfaction (Diener et al., 2018).

Personality and Job-Satisfaction in the SOEP

Research on job satisfaction has a long history in applied or industrial/organizational psychology. One line of research examines how environmental factors (job characteristics) influence job satisfaction. Another line of research examines the influence of personality on job satisfaction. Finally, a third line of research examines person x job interaction effects.

Timothy Judge is a leading researcher on personality influences on job satisfaction (see Judge & Kammeyer-Mueller, 2012, for a review). Evidence for personality influences on job satisfaction comes from two lines of research. First, longitudinal studies of job satisfaction show moderate stability over time even when employers change jobs. However, similarity between jobs may contribute to this stability. The second line of research relates measures of personality to job satisfaction. A meta-analysis suggested that the Big Five predict job satisfaction with neuroticism (r = -.29), extraversion (r = .26), and conscientiousness (r = .26) being the strongest predictors (Judge, Heller, & Mount, 2002).

The existing evidence has several limitations. First, meta-analysis combine ad-hoc convenience samples, which makes it unclear how much these results generalize to the general population. Second, meta-analytic studies can be biased by publication bias. Third, simple correlations tend to overestimate effect sizes because they fail to control for shared method variance in personality and job satisfaction measures. Finally, most studies are cross-sectional and do not examine the contribution of personality to stability in job satisfaction.

To address these concerns, I examined the relationship between personality and job satisfaction in the SOEP; a longitudinal panel study with annual assessments of job satisfaction. Personality was assessed three times, four years apart (2005, 2009, 2013). For the present analysis, I limited the data analysis to individuals who reported job satisfaction on all three waves (N = 4,064). This ensures that the sample focuses on employed individuals. For these initial analyses, I did not distinguish between individuals who changed employers and those who stayed in the same job.

The data were analyzed with a three-wave latent variable model that models retest correlations as a function of reliability and stability (Heise, 1969). This model makes it possible to estimate the reliability of single-item measures. Thus, the substantial correlations between personality and job satisfaction are corrected for unreliability and occasion-specific influences on job satisfaction. The same model was used to analyze personality and life-satisfaction (Schimmack, 2019; see OSF for syntax and detailed results https://osf.io/vpcfd/ ).

Results

Observed stability was r = .38 from 2005 to 2009, r = .39 from 2009 to 2013, and r = .36 from 2005 to 2009. It is remarkable that the retest correlation spanning 8 years is just slightly lower than the 4-year retest correlations. Using Heise’s formula, this implies low reliability and high stability; REL = .38*.39/.36 = .41, 8-year stability = .36/.41 = .88. The reliability estimate is lower than the reliability estimate based on annual assessments (Schimmack, Schupp, & Wagner, 2008). Thus, job satisfaction seems to fluctuate reliably form year to year. However, there is also a stable component that is highly stable over an eight year period. The main question is how much personality contributes to this stable component.

Personality measured at Time 1 was used as a predictor of job satisfaction at times 1 to 3. If personality contributes to stability in job satisfaction, personality traits should predict job satisfaction concurrently and prospectively. The results in Table 1 show that this was the case for neuroticism and for halo. Effect sizes for the other traits were very small. The effect size for neuroticism was comparable to Judge et al.’s meta-analysis (r = -.29), but these results do not replicate the estimates for extraversion or conscientiousness. One reason for this discrepancy could be that the current model controlled for evaluative biases in personality ratings, while effect size estimates in the meta-analysis were inflated by halo bias. The finding that halo bias was a stable predictor of job satisfaction ratings is consistent with this interpretation.

JS-T1JS-T2JS-T3
Neuroticism-0.24-0.18-0.23
Extraversion0.060.070.06
Openness
Agreeableness0.080.110.09
Conscientiousness0.100.060.04
Halo0.400.220.28
Acquiescence

Table 2 examines whether changes in personality predict changes in job satisfaction. To do so, job satisfaction was regressed on the residual variances in personality at times 2 and 3.

Table 3 shows the relationship between residual variances in personality and life-satisfaction at times 2 and 3. These results show whether changes in personality predict changes in well-being. The coefficients in Table 3 cannot be directly compared to those in Table 2 because they are standardized coefficients and the residual variance in personality is much smaller than the stable variances. However, the results do provide seminal information whether changes in personality can predict changes in life-satisfaction.

JS-T2JS-T3
Neuroticism-0.43-0.31
Extraversion-0.010.11
Openness
Agreeableness-0.07-0.12
Conscientiousness0.080.02
Halo0.160.24
Acquiescence

As before, neuroticism and halo bias were the only notable predictors of change in job satisfaction. The results for halo bias show that job satisfaction ratings change as respondents tendency to respond positively changes. The results for neuroticism are more interesting. One possible explanation for this finding is that neuroticism measures are not pure trait measures and that changes in anxiety are related to worries in the job domain. Another explanation is that neuroticism changes for other reasons and influences job satisfaction. To disentangle these explanations it is important to examine other domain satisfactions. If personality changes cause changes in job satisfaction, one would expect similar changes for other domains like health satisfaction.

The final result was the stability of the residual variance in job satisfaction that is not explained by personality – as measured in the SOEP. Stability estimates were r = .87 and r = .86 over the 4-year intervals with an implied stability of r = .75 over the 8-year interval. Thus, personality is just one predictor of stability in job satisfaction and it contributes a relatively small amount to stability in job satisfaction.

Conclusion

The results of this investigation only partially replicate previous results. Neuroticism is a moderate predictor of job-satisfaction that contributes to stability in job satisfaction. However, extraversion and conscientiousness play a much smaller role than previous meta-analyses suggested. A plausible reason is that meta-analyses relied on observed correlations that do not control for shared method variance. In contrast, the present study modeled method variance and found that evaluative bias (halo) in personality ratings also influences job-satisfaction ratings.

The present results also showed that job satisfaction is highly stable over an 8-year period even after removing the influence of personality. This suggests that job characteristics can also have lasting effects on job satisfaction. A practical implication of this finding is to identify these factors. The results suggest that helping people to find jobs that fit their personality or to improve job characteristics that influence job satisfaction can have lasting effects on job satisfaction and wellbeing. The SOEP data provide ample opportunity to explore additional predictors of stable variance in job satisfaction.

The results also have implications for theories of well-being. McCrae and Costa (1991) suggested that conscientiousness increases well-being because conscientiousness is instrumental for good job performance. However, job performance and job satisfaction are different constructs. While conscientiousness is a robust predictor of job performance, the relationship to job satisfaction is rather weak. Presumably, conscientious individuals work harder because they have higher performance goals which makes it harder to be satisfied. Whatever the reasons, the current results suggest that theories of personality and wellbeing need to be revised.

Measuring Personality in the SOEP

The German Socio-Economic-Panel (SOEP) is a longitudinal study of German households. The core questions address economic issues, work, health, and well-being. However, additional questions are sometimes added. In 2005, the SOEP included a 15-item measure of the Big Five; the so-called BFI-S (Lang et al., 2011). As each personality dimension is measured with only three items, scale scores are rather unreliable measures of the Big Five. A superior way to examine personality in the SOEP is to build a measurement model that relates observed item scores to latent factors that represent the Big Five.

Anusic et al. (2009) proposed a latent variable model for an English version of the BFI-S.

The most important feature of this model is the modeling of method factors in personality ratings. An acquiescence factor accounts for general response tendencies independent of item content. In addition, a halo factor accounts for evaluative bias that inflates correlations between two desirable or two undesirable items and attenuates correlations between a desirable and an undesirable item. The Figure shows that the halo factor is bias because it correlates highly with evaluative bias in ratings of intelligence and attractiveness.

The model also includes a higher-order factor that accounts for a correlation between extraversion and openness.

Since the article was published I have modified the model in two ways. First, the Big Five are conceptualized as fully independent which is in accordance with the original theory. Rather than allowing for correlations among Big Five factors, secondary loadings are used to allow for relationships between extraversion and openness items. Second, halo bias is modeled as a characteristic of individual items rather than the Big Five. This approach is preferable because some items have low loadings on halo.

Figure 2 shows the new model.

I fitted this model to the 2005 data using MPLUS (syntax and output: https://osf.io/vpcfd/ ). The model had acceptable fit to the data, CFI = .962, RMSEA = .035, SRMR = .029.

Table 1 shows the factor loadings. It also shows the correlation of the sum scores with the latent factors.

Item#NEOACEVBACQ
Neuroticism
worried50.49-0.020.19
nervous100.64-0.310.18
relaxed15-0.550.350.21
SUM0.750.000.000.000.00-0.300.09
Extraversion
talkative20.600.130.400.23
sociable80.640.370.22
reserved12-0.520.20-0.110.19
SUM0.000.750.00-0.100.050.360.09
Openess
original40.260.41-0.330.380.22
artistic90.150.360.290.17
imaginative140.300.550.220.21
SUM0.000.300.57-0.130.000.390.26
Agreeableness
rude30.12-0.51-0.320.19
forgiving60.230.320.24
considerate130.490.480.29
SUM0.00-0.070.000.580.000.500.11
Conscientiousness
thorough10.710.350.30
lazy7-0.16-0.41-0.350.20
efficient110.390.480.28
SUM0.000.000.000.090.640.510.11

The results show that all items load on their primary factor although some loadings are very small (e.g., forgiving). Secondary loadings tend to be small (< .2), although they are highly significant in the large sample. All items load on the evaluative bias factor, with some fairly large loadings for considerate, efficient, and talkative. Reserved is the most evaluatively neutral item. Acquiescence bias is rather weak.

The scale scores are most strongly related to the intended latent factor. The relationship is fairly strong for neuroticism and extraversion, suggesting that about 50% of the variance in scale scores reflects the intended construct. However, for the other three dimensions, correlations suggest that less than 50% of the variance reflects the intended construct. Moreover, the remaining variance is not just random measurement error. Evaluative bias contributes from 10% up to 25% of additional variance. Acquiescence bias plays a minor role because most scales have a reverse scored item. Openness is an exception and acquiescence bias contributes 10% of the variance in scores on the Openness scale.

Given the good fit of this model, I recommend it for studies that want to examine correlates of the Big Five or that want to compare groups. Using this model will produce better estimates of effect sizes and control for spurious relationships due to method factors.

Open-SOEP: Cohort vs. Age Effects on Personality

The German Socio-Economic Panel (SOEP) is a unique and amazing project. Since 1984, representative samples of German families have been surveyed annually. This project has produced a massive amount of data and hundreds of publications. The traditional journal publications make it difficult to keep track with developments and to find related articles. A better way to make use of these data may be open science where researchers can quickly share information.

In 2005, the SOEP included a brief, 15-item, measure of the Big Five personality traits. These data were used for cross-sectional studies that related personality to other variables measured in the SOEP such as well-being (Rammstedt, 2007). In 2009, the SOEP repeated the measurement of the Big Five. This provided longitudinal data for analyses of stability and change of personality. Researchers rushed to analyze the data and to report their findings. JPSP published two independent articles based on the same data (Lucas & Donnellan, 2011; Specht, Egloff, Schmukle, 2011). Both articles examined age-differences across birth-cohorts and over time. Ideally age-effects would show up in both analyses and produce similar trends in the data. Both articles also paid little attention to cohort differences in personality (i.e., Germans born in 1920 who grew up during Nazi times might differ from Germans born in 1950 who grew up during the revolutionary 60s).

In 2017, the Big Five questions were administered again, which makes it easier to spot age-trends and to distinguish age-effects from cohort effects. Recently, the first article based on the three-waves of data was published in JPSP (Wagner, Lüdtke, & Robitzsch, 2019). The article focused on retest correlations (consistency of individual differences over time), and did not examine mean levels of personality. The article does not mention cohort effects.

Cohort/Culture Effects

Like many Western countries, German culture has changed tremendously during the 20st century. In addition, German culture has been shaped by unique historical events such as the rise and fall of Hitler, the second world war, followed by the Wirschaftswunder, the division of the country into a democratic and a socialist country and the unification of Germany after the fall of the Berlin Wall. The SOEP data provide a unique opportunity to examine whether personality is shaped by culture.

So far, studies of cultural influences on personality have mostly relied on cross-cultural comparisons of Western cultures with non-Western cultures. The main finding of these studies is that citizens of modern, individualistic nations tend to be more extraverted and open to experiences than citizens in traditional, collectivistic cultures.

Based on these findings, one might expect higher levels of extraversion and openness in younger generations of Germans who grew up in a more individualistic culture than their parents and grandparents.

Method

The data are the Big Five ratings for the three waves in the SOEP (vp, zp, & bdp). Data were prepared and analyzed using R (see OSF for R-code). The three items for each of the Big Five scales were summed and analyzed as a function of 7 cohorts spanning 10 years (born 1978 to 1988 age 17-27 to age 77 to 87) and three waves (2005, 2009, 2013). The overall mean was subtracted from each of the 21 means and the mean differences were divided by the pooled standard deviation. This way, mean differences in the figures are standardized mean differences to ease interpretation of effect sizes.

Results

Openness to Experience

Openness to experience showed a clear cohort effect (Figure 1) with the lowest scores for the oldest cohort (1918-28) and the highest scores for the youngest cohort (1978 to 1988). The difference between the youngest and oldest cohorts is d = .72, which is considered a large effect size. In comparison, there is no clear age trend in Figure 1. While, scores decrease from t1 to t2, they increase from t2 to t3. All differences between t1 and t2 are small, |d| < .2.

Extraversion

Extraversion also shows a cohort effect in the predicted direction, but the effect size is smaller, d = .34.

In contrast, there are no age effects and the overall difference between 2005 and 2013 is d = -0.01.

Conscientiousness

I next examined conscientiousness because studies of age effects tend to show the largest age effects for this Big Five dimension. Regarding cohort effects, one might expect a decrease because older generations worked very hard to rebuild post-war Germany.

Consistent with the developmental literature, the youngest age-cohort shows an increase in conscientiousness from 2005 to 2013, although the effect size is small (d = .21). The other age-cohorts show very small decreases in conscientiousness except for the oldest age-cohort that shows a small decrease, d = -.22. Regarding cohort effects, there is no general tend, but the youngest cohort shows very low levels of conscientiousness even in 2013 when they are 25 to 35 years old.

Agreeableness

Developmental studies suggest that agreeableness increases as people get older. However, the SOEP data do not confirm this trend.

Within each cohort, agreeableness scores decrease although the effect sizes are very small. The overall decrease from 2005 to 2013 is d = -.09. In contrast, there is a clear cohort effect with agreeableness being the highest in the oldest generation. The decrease tends to level of for the last three generations. The effect size is moderate, d = -.38.

Neuroticism

The main result for neuroticism is that there is neither a pronounced cohort effect, d = -.09, nor age effect, d = -.13.

Conclusion

Previous analysis of personality data in the SOEP have focused on age effects and interpreted cross-sectional differences between older and younger Germans as age effects. However, these analyses were based on only two waves of data, which makes it difficult to interpret changes in personality scores over time. The third wave shows that some of the trends did not continue and suggest that there are no notable effects of aging in the SOEP data. The only age-effect consistent with the literature is an increase in conscientiousness in the youngest cohort of 17 to 27-year olds.

However, the data are consistent with cohort effects that are consistent with cross-cultural studies. The more individualistic a culture becomes, the more open and extraverted individuals become. Deeper analysis might help to elucidate which factors contribute to these changes (e.g., education level). The results also suggested that agreeableness decreased which might be another consequence of increasing individualism.

Overall, the results suggest that personality is influenced by cultural factors during adolescence and early adulthood, but that personality remains fairly stable throughout adulthood. This conclusion is also supported by other longitudinal studies (e.g., MIDUS) that show little changes in Big Five scores over time. Maybe Costa and McCrae were not entirely wrong when they compared personality to plaster that can be shaped while it is setting, but remains stable after it is dried.