In the 2010s, it became apparent that empirical psychology has a replication problem. When psychologists tested the replicability of 100 results, they found that only 36% of the 97 significant results in original studies could be reproduced (Open Science Collaboration, 2015). In addition, several prominent cases of research fraud further undermined trust in published results. Over the past decade, several proposals were made to improve the credibility of psychology as a science. Replicability reports are the results of one of these initiatives.The main problem in psychological science is the selective publishing of statistically significant results and the blind trust in statistically significant results as evidence for researchers’ theoretical claims. Unfortunately, psychologists have been unable to self-regulate their behavior and continue to use unscientific practices to hide evidence that disconfirms their predictions. Moreover, ethical researchers who do not use unscientific practices are at a disadvantage in a game that rewards publishing many articles without any concern about the replicability of these findings.My colleagues and I have developed a statistical tools that can reveal the use of unscientific practices and predict the outcome of replication studies (Brunner & Schimmack, 2021; Bartos & Schimmack, 2022). This method is called z-curve. Z-curve cannot be used to evaluate the credibility of a single study. However, it can provide valuable information about the research practices in a particular research domain. Replicability-Reports (RR) use z-curve to provide information about the research and publication practices of psychological journals. This information can be used by authors to chose journals they want to publish in, provides feedback to journal editors who have influence on selection bias and replicability of results published in their journals, and most importantly to readers of these journals.
Cognition & Emotion
The study of emotions largely disappeared from psychology after the second world war and during the rain of behaviorism or was limited to facial expressions. The study of emotional experiences reemerged in the 1980. Cognition & Emotion was established in 1987 as an outlet for this research.
So far, the journal has published close to 3,000 articles. The average number of citations per article is 46. The journal has an H-Index of 155 (i.e., 155 articles have 155 or more citations). These statistics show that Cognition & Emotion is an influential journal for research on emotions.
Nine articles have more than 1,000 citations. The most highly cited article is a theoretical article by Paul Ekman arguing for basic emotions (Ekman, 1992);
Report
Replication reports are based on automatically extracted test-statistics (F-tests, t-tests, z-tests) from the text potion of articles. The reports do not include results reported as effect sizes (r), confidence intervals, or results reported in tables or figures.
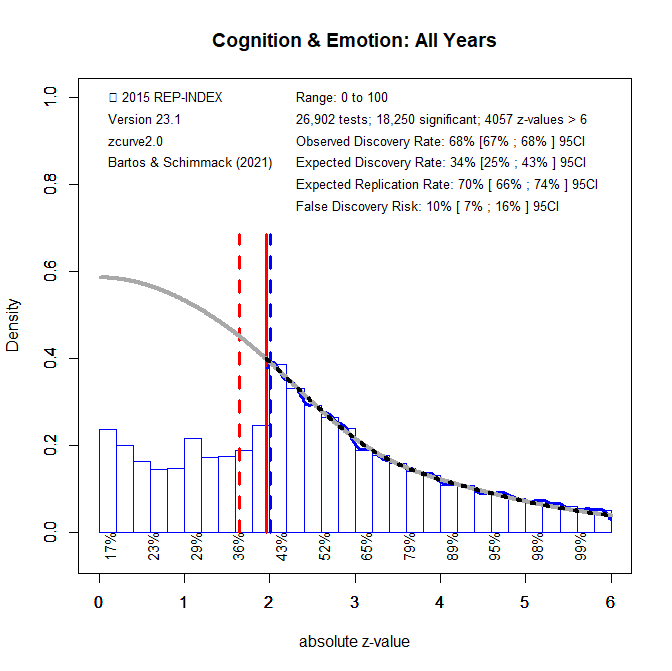
Figure 1 shows a z-curve plot for all articles from 2000-2022 (see Schimmack, 2023, for a detailed description of z-curve plots). The plot is essentially a histogram of all test statistics converted into absolute z-scores (i.e., the direction of an effect is ignored). Z-scores can be interpreted as the strength of evidence against the null-hypothesis that there is no statistical relationship between two variables (i.e., the effect size is zero and the expected z-score is zero).A z-curve plot shows the standard criterion of statistical significance (alpha = .05, z = 1.97) as a vertical red line. It also shows a dotted vertical red line at z = 1.65 because results with z-scores between 1.65 and 1.97 are often interpreted as evidence for an effect using a more liberal alpha criterion, alpha = .10, a one-sided test, or with qualifiers (e.g., marginally significant). Thus, values in this range cannot be interpreted as reporting of results that failed to support a hypothesis.
Z-curve plots are limited to values less than z = 6. The reason is that values greater than 6 are so extreme that a successful replication is all but certain, unless the value is a computational error or based on fraudulent data. The extreme values are still used for the computation of z-curve statistics, but omitted from the plot to highlight the shape of the distribution for diagnostic z-scores in the range from 2 to 6.Z-curve fits a statistical model to the distribution of these z-scores. The predicted distribution is shown as a grey curve. Importantly, the model is fitted to the significant z-scores, but the model makes a prediction about the distribution of non-significant results. This makes it possible to examine publication bias (i.e., selective publishing of significant results).
Selection for Significance
Visual inspection of Figure 1 shows that there are fewer observed non-significant results (z-scores between 0 and 1.65) than predicted z-scores. This is evidence of selection for significance. It is possible to quantify the bias in favor of significant results by comparing the proportion of observed significant results (i.e., the observed discovery rate, ODR) with the expected discovery rate (EDR) based on the grey curve. While the observed discovery rate is 68%, the expected discovery rate is 34%. The 95% confidence intervals of the ODR and EDR do not overlap. Thus, there is clear evidence of selection bias in this journal.
False Positive Risk
The replication crisis has led to concerns that many or even most published results are false positives (i.e., the true effect size is zero). The false positive risk is inversely related to the expected discovery rate and z-curve uses the EDR to estimate the risk that a published significant result is a false positive result.
An EDR of 34% implies that up to 10% of the significant results could be false positives. Thus, concerns that most published results are false are overblown. However, a focus on false positives is misleading because it ignores effect sizes. Even if an effect is not exactly zero, it may be too small to be relevant (i.e., practically significant). Readers of statistical results in this journal need to examine the range of plausible effect sizes, confidence intervals, to see whether results have practical significance. Unfortunately, these estimates are inflated by selection bias, especially when the evidence is weak and the confidence interval already includes effect sizes close to zero.
Expected Replication Rate
The expected replication rate estimates the percentage of studies that would produce a significant result again if exact replications with the same sample size were conducted. A comparison of the ERR with the outcome of actual replication studies shows that the ERR is higher than the actual replication rate. There are several factors that can explain this discrepancy such as the difficulty of conducting exact replication studies. Thus, the ERR is an optimist estimate. A conservative estimate is the EDR. The EDR predicts replication outcomes if significance testing does not favor studies with higher power (larger effects and smaller sampling error) because statistical tricks make it just as likely that studies with low power are published.
The ERR of 70% suggests that most results published in this journal are replicable, but the EDR allows for a replication rate as low as 34%. Thus, replicability is estimated to range from 34% to 70%. There is no representative sample of replication studies from this journal to compare this estimate with the outcome of actual replication studies. However, a journal with lower ERR and EDR estimates, Psychological Science, had an actual replication rate of 41%. Thus, it is plausible to predict a higher actual replication rate than this for Cognition & Emotion.
Time Trends
To examine changes in credibility over time, z-curves were fitted to test statistics for each year from 2000 to 2022. Confidence intervals were created by regressing the estimates on time and time-squared to examine non-linear relationships.
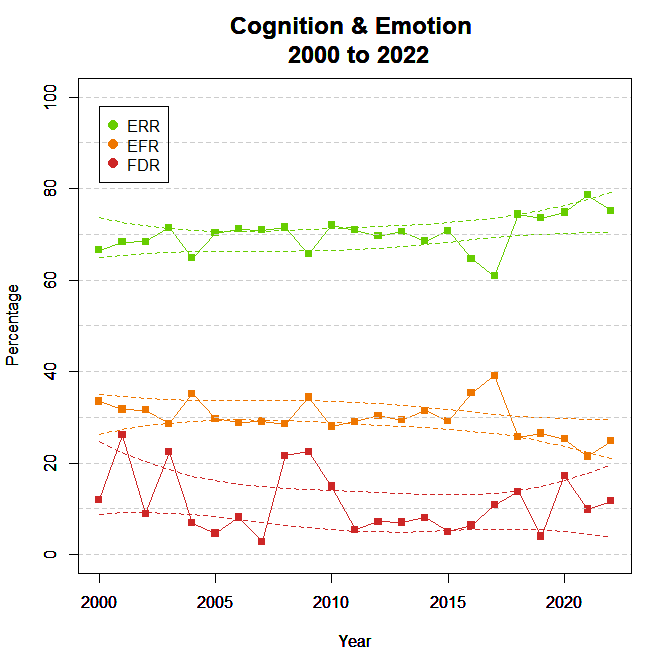
Figure 2 shows the ODR and EDR to examine selection bias. The ODR showed a significant linear trend, indicating more publications of non-significant results, b = -.79, percentage points per year (SE = .10). The EDR showed no significant linear, b = .23, SE = .41, or non-linear, b = -.10, SE = .07, trends.

The decreasing ODR implies that selection bias is decreasing, but it is not clear whether this trend also applies to focal hypothesis tests (see limitations section). The lack of an increase in the EDR implies that researchers continue to conduct studies with low statistical power and that the non-significant results often remain unpublished. To improve credibility of this journal, editors could focus on power rather than statistical significance in the review process.
Figure 3 shows the false discovery risk (FDR) and the estimated replication rate (ERR). It also shows the expected replication failure rate (EFR = 1 – ERR). A comparison of the EFR with the FDR provides information for the interpretation of replication failures. If the FDR is close to the EFR, many replication failures may be due to false positive results in original studies. In contrast, if the FDR is low, most replication failures are likely to be false negative results in underpowered replication studies.
There was a significant linear, b = .24, SE = .11, tend for the ERR, indicating an increase in the ERR. The increase in the ERR implies fewer replication failures in the later years. However, because the FDR is not decreasing, a larger portion of these replication failures could be false positives.
Retrospective Improvement of Credibility
he criterion of alpha = .05 is an arbitrary criterion to make decisions about a hypothesis. It was used by authors to conclude that an effect is present and editors accepted articles on the basis of this evidence. However, readers can demand stronger evidence. A rational way to decide what alpha criterion to use is the false positive risk. A lower alpha, say alpha = .005, reduces the false positive risk, but also increases the percentage of false negatives (i.e.., there is an effect even if the p-value is above alpha).
Figure 4 shows the implications of using different significance criteria for the observed discovery rate (lower alpha implies fewer significant results).
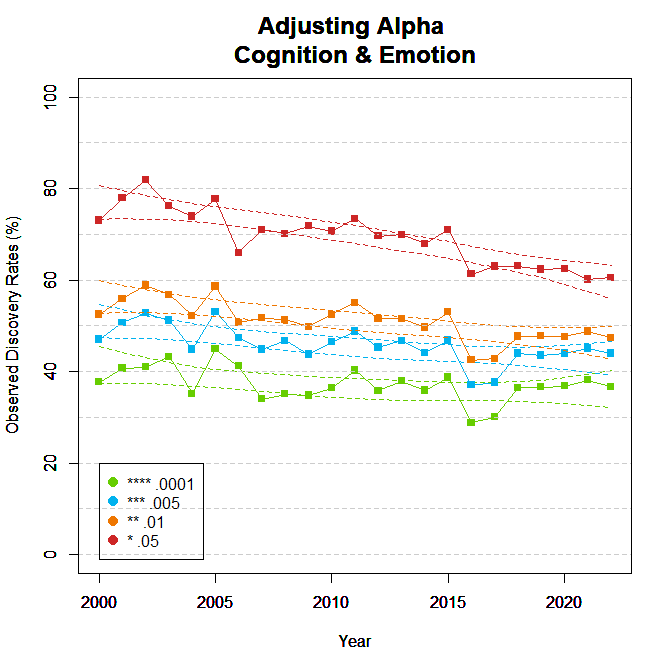
Lowering alpha to .01 reduces the observed discovery rate by 20 to 30 percentage points. It is also interesting that the ODR decreases more with alpha = .05 than for other alpha levels. This suggests that changes in the ODR are in part caused by fewer p-values between .05 and .01. These significant results are more likely to result from unscientific methods and are often do not replicate.
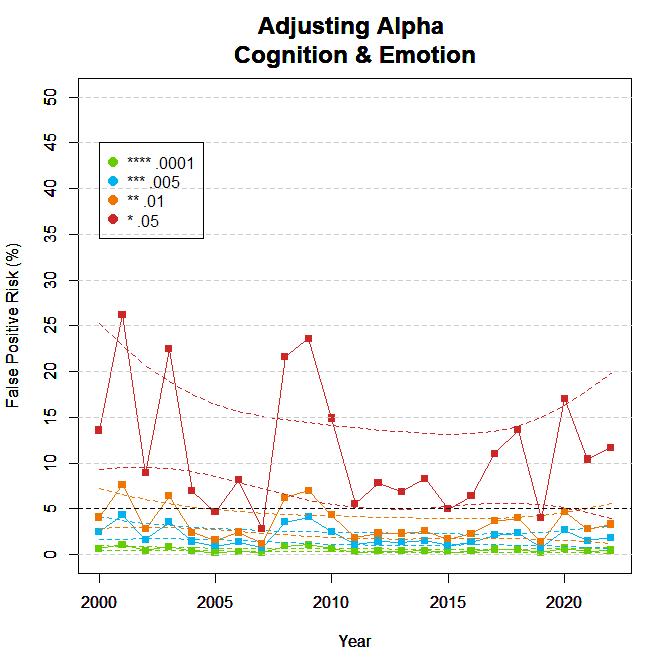
Figure 5 shows the effects of alpha on the false positive risk. Lowering alpha to .01 reduces the false positive risk to less than 5%. Thus, readers can use this criterion to reduce the false positive risk to an acceptable level.
Limitations
The main limitation of these results is the use of automatically extracted test statistics. This approach cannot distinguish between theoretically important statistical results and other results that are often reported, but do not test focal hypotheses (e.g., testing statistical significance of a manipulation check, reporting a non-significant result for a factor in a complex statistical design that was not expected to produce a significant result).
For the journal Cognition & Emotion a small set of articles were hand-coded as part of a study on the effects of open science reforms on the credibility of psychological science. Figure 6 shows the z-curve plot and results for 117 focal hypothesis tests.

The main difference between manually and automatically coded data is a much higher ODR (95%) for manually coded data. This finding shows that selection bias for focal hypothesis tests is much more severe than the automatically extracted data suggest.
The point estimate of the EDR, 37%, is similar to the EDR for automatically extracted data, 34%. However, due to the small sample size, the 95%CI for manually coded data is wide and it is impossible to draw firm conclusions about the EDR, but results from other journals and large samples also show similar results.
The ERR estimates are also similar and the 95%CI for hand-coded data suggests that the majority of results are replicable.
Overall, these results suggest that automatically extracted results are informative, but underestimate selection bias for focal hypothesis tests.
Conclusion
The replicability report for Cognition & Emotion shows clear evidence of selection bias, but also a relatively low risk of false positive results that can be further reduced by using alpha = .01 as a criterion to reject the null-hypothesis. There are no notable changes in credibility over time. Editors of this journal could improve credibility by reducing selection bias. The best way to do so would be to evaluate the strength of evidence rather than using alpha = .05 as a dichotomous criterion for acceptance. Moreover, the journal needs to publish more articles that fail to support theoretical predictions. The best way to do so is to accept articles that preregistered predictions and failed to confirm them or to invite registered reports that publish articles independent of outcome of a study. Readers can set their own level of alpha depending on their appetite for risk, but alpha = .01 is a reasonable criterion because it (a) maintains a false positive risk below 5%, and eliminates p-values between .01 and .05 that are often obtained with unscientific practices and fail to replicate.