updated 7/11/23
[slightly different results due to changes in the extraction code and a mistake in the formula for the false discovery risk with different levels of alpha]
In the 2010s, it became apparent that empirical psychology has a replication problem. When psychologists tested the replicability of 100 results, they found that only 36% of the 97 significant results in original studies could be reproduced (Open Science Collaboration, 2015). In addition, several prominent cases of research fraud further undermined trust in published results. Over the past decade, several proposals were made to improve the credibility of psychology as a science. Replicability reports are the results of one of these initiatives.The main problem in psychological science is the selective publishing of statistically significant results and the blind trust in statistically significant results as evidence for researchers’ theoretical claims. Unfortunately, psychologists have been unable to self-regulate their behavior and continue to use unscientific practices to hide evidence that disconfirms their predictions. Moreover, ethical researchers who do not use unscientific practices are at a disadvantage in a game that rewards publishing many articles without any concern about the replicability of these findings.My colleagues and I have developed a statistical tools that can reveal the use of unscientific practices and predict the outcome of replication studies (Brunner & Schimmack, 2021; Bartos & Schimmack, 2022). This method is called z-curve. Z-curve cannot be used to evaluate the credibility of a single study. However, it can provide valuable information about the research practices in a particular research domain. Replicability-Reports (RR) use z-curve to provide information about the research and publication practices of psychological journals. This information can be used by authors to chose journals they want to publish in, provides feedback to journal editors who have influence on selection bias and replicability of results published in their journals, and most importantly to readers of these journals.
Psychological Science
Psychological Science is often called the flagship journal of the Association for Psychological Science. It publishes journals from all areas of psychology, but most articles are experimental studies.
The journal started in 1990. So far, it has published over 5,000 articles with an average citation rate of 90 citations per article. The journal currently has an H-Index of 300 (i.e., 300 articles have received 300 or more citations).
Ironically, the most cited article (3,800 citations) is a theoretical article that illustrated how easy it is to produce statistically significant results with statistical tricks that capitalize on chance and increase the risk of a false discovery and inflate effect size estimates (Simmons, Nelson, & Simmonsoh, 2011). This article is often cited as evidence that published results lack credibility. The impact of this journal also suggests that most researchers are now aware that selective publishing of significant results is harmful.
After concerns about the replicability of psychological science emerged in the early 2010s, Erich Eid initiated changes to increase the credibility of published results. Further changes were made by Stephen Lindsay during his editorship from 2015 to 2019. Replicability reports provide an opportunity to examine the effect of these changes on the credibility of published results.
Report
Replication reports are based on automatically extracted test-statistics (F-tests, t-tests, z-tests) from the text potion of articles. The reports do not include results reported as effect sizes (r), confidence intervals, or results reported in tables or figures.

Figure 1 shows a z-curve plot for all articles from 2000-2022 (see Schimmack, 2023, for a detailed description of z-curve plots). The plot is essentially a histogram of all test statistics converted into absolute z-scores (i.e., the direction of an effect is ignored). Z-scores can be interpreted as the strength of evidence against the null-hypothesis that there is no statistical relationship between two variables (i.e., the effect size is zero and the expected z-score is zero).A z-curve plot shows the standard criterion of statistical significance (alpha = .05, z = 1.97) as a vertical red line. It also shows a dotted vertical red line at z = 1.65 because results with z-scores between 1.65 and 1.97 are often interpreted as evidence for an effect using a more liberal alpha criterion, alpha = .10, a one-sided test, or with qualifiers (e.g., marginally significant). Thus, values in this range cannot be interpreted as reporting of results that failed to support a hypothesis.
Z-curve plots are limited to values less than z = 6. The reason is that values greater than 6 are so extreme that a successful replication is all but certain, unless the value is a computational error or based on fraudulent data. The extreme values are still used for the computation of z-curve statistics, but omitted from the plot to highlight the shape of the distribution for diagnostic z-scores in the range from 2 to 6.Z-curve fits a statistical model to the distribution of these z-scores. The predicted distribution is shown as a grey curve. Importantly, the model is fitted to the significant z-scores, but the model makes a prediction about the distribution of non-significant results. This makes it possible to examine publication bias (i.e., selective publishing of significant results).
Selection for Significance
Visual inspection of Figure 1 shows that there are fewer observed non-significant results (z-scores between 0 and 1.65) than predicted z-scores. This is evidence of selection for significance. It is possible to quantify the bias in favor of significant results by comparing the proportion of observed significant results (i.e., the observed discovery rate, ODR) with the expected discovery rate (EDR) based on the grey curve. While the observed discovery rate is 71%, the expected discovery rate is 25%. The 95% confidence intervals of the ODR and EDR do not overlap. Thus, there is clear evidence of selection bias in this journal.
False Positive Risk
The replication crisis has led to concerns that many or even most published results are false positives (i.e., the true effect size is zero). The false positive risk is inversely related to the expected discovery rate and z-curve uses the EDR to estimate the risk that a published significant result is a false positive result.
An EDR of 25% implies that up to 16% of the significant results could be false positives. Thus, concerns that most published results are false are overblown. However, a focus on false positives is misleading because it ignores effect sizes. Even if an effect is not exactly zero, it may be too small to be relevant (i.e., practically significant). Readers of statistical results in Psychological Science need to examine the range of plausible effect sizes, confidence intervals, to see whether results have practical significance. Unfortunately, these estimates are inflated by selection bias, especially when the evidence is weak and the confidence interval already includes effect sizes close to zero.
Expected Replication Rate
The expected replication rate estimates the percentage of studies that would produce a significant result again if exact replications with the same sample size were conducted. A comparison of the ERR with the outcome of actual replication studies shows that the ERR is higher than the actual replication rate. There are several factors that can explain this discrepancy such as the difficulty of conducting exact replication studies. Thus, the ERR is an optimist estimate. A conservative estimate is the EDR. The EDR predicts replication outcomes if significance testing does not favor studies with higher power (larger effects and smaller sampling error) because statistical tricks make it just as likely that studies with low power are published.
The ERR of 67% suggests that most results published in this journal are replicable, but the EDR allows for a replication rate as low as 25%. Thus, replicability is estimated to range from 25% to 67%. Actual replications of results in this journal suggest a replication rate of 41% (Open Science Collaboration, 2015). This finding is consistent with the present results. Thus, replicability of results in Psychological Science is much lower than trusting readers might suspect.
Time Trends
To examine changes in credibility over time, z-curves were fitted to test statistics for each year from 2000 to 2022. Confidence intervals were created by regressing the estimates on time and time-squared to examine non-linear relationships.
Figure 2 shows the ODR and EDR to examine selection bias. The ODR showed a significant linear trend, indicating more publications of non-significant results, b = -.53 percentage points per year (SE = .09). The EDR showed significant linear, b = .70, SE = .31, and non-linear, b = .24, SE = .05, trends.

The decreasing ODR implies that selection bias is decreasing, but it is not clear whether this trend also applies to focal hypothesis tests (see limitations section). The curvilinear trend for the EDR is notable because it suggests that concerns about the credibility of published results were triggered by a negative trend in the EDR from 2000 to 2010. Since then, the EDR has been moving up. The positive trend can be attributed to the reforms initiated by Eric Eich and Steven Lindsey that have been maintained by the current editor Patricia J. Bauer.
Figure 3 shows the false discovery risk (FDR) and the estimated replication rate (ERR). It also shows the expected replication failure rate (EFR = 1 – ERR). A comparison of the EFR with the FDR provides information for the interpretation of replication failures. If the FDR is close to the EFR, many replication failures may be due to false positive results in original studies. In contrast, if the FDR is low, most replication failures are likely to be false negative results in underpowered replication studies.
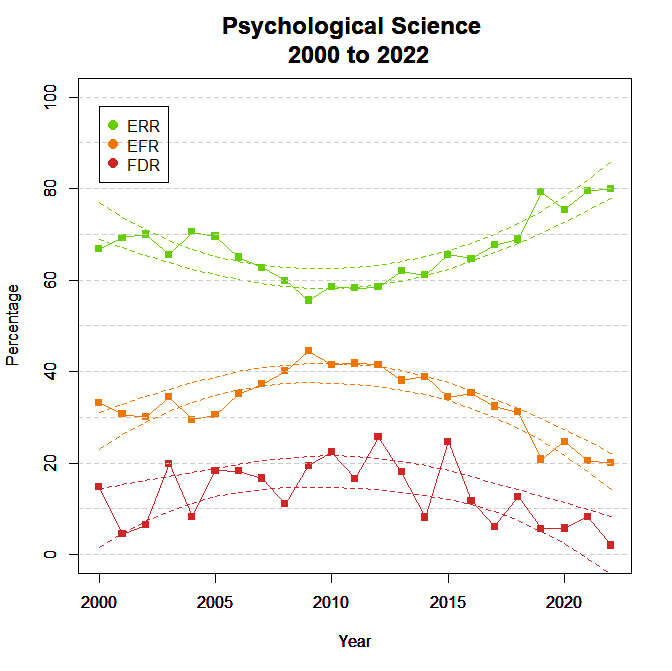
There were linear, b = .40, SE = .11, and quadratic, b = .14, SE = .02, time trends for the ERR. The FDR is based on the EDR that also showed linear and quadratic trends. The non-linear trends imply that credibility was lowest from 2005 to 2015. During this time up to 40% of published results might not be replicable and up to 50% of these results might be false positive results. The Open Science replication project replicated studies from 2008. Given the present findings, this result cannot be generalized to other years.
Retrospective Improvement of Credibility
The criterion of alpha = .05 is an arbitrary criterion to make decisions about a hypothesis. It was used by authors to conclude that an effect is present and editors accepted articles on the basis of this evidence. However, readers can demand stronger evidence. A rational way to decide what alpha criterion to use is the false positive risk. A lower alpha, say alpha = .005, reduces the false positive risk, but also increases the percentage of false negatives (i.e.., there is an effect even if the p-value is above alpha).
Figure 4 shows the implications of using different significance criteria for the observed discovery rate (lower alpha implies fewer significant results).

Lowering alpha to .01 reduces the observed discovery rate by 20 to 30 percentage points. The effect is stronger during the dark period from 2005 to 2015 because more results during this period had p-values between .05 and .01. These results often do not replicate and are more likely to be the result of unscientific research practices.
Figure 5 shows the effects of alpha on the false positive risk. Lowering alpha to .01 reduces the false positive risk considerably, but it remains above 5% during the dark period from 2005 to 2015. These results suggest that readers could use alpha = .005 from 2005 to 2015 and alpha = .01 during other years to achieve a false positive risk below 5%.

Limitations
The main limitation of these results is the use of automatically extracted test statistics. This approach cannot distinguish between theoretically important statistical results and other results that are often reported, but do not test focal hypotheses (e.g., testing statistical significance of a manipulation check, reporting a non-significant result for a factor in a complex statistical design that was not expected to produce a significant result).
For the journal Psychological Science, hand-coded data are available from coding by Motyl et al. (2017) and my own lab. The datasets were combined and analyzed with z-curve (Figure 4).

The ODR of 84% is higher than the ODR of 68% for automatic extraction. The EDR of 34% is identical to the estimate for automatic extraction. The ERR of 61% is 8 percentage points lower than the ERR for automatic extraction. Given the period effects on z-curve estimates, I also conducted a z-curve analysis for automatically extracted tests for the matching years (2003, 2004, 2010, 2016, 2020). The results were similar, ODR = 73%, EDR = 25%, and ERR = 64%. Thus, automatically extracted results produce similar results to results based on handcoded data. The main difference is that non-significant results are less likely to be focal tests.
Conclusion
The replicability report for Psychological Science shows (a) clear evidence of selection bias, (b) unacceptably high false positive risks at the conventional criterion for statistical significance, and modest replicability. However, time trend analyses show that credibility of published results decreased in the beginning of this century, but improved since 2015. Further improvements are needed to eliminate selection bias and increase the expected discovery rate by increasing power (reducing sampling error). Reducing sampling error is also needed to produce strong evidence against theoretical predictions that are important for theory development. The present results can be used as benchmark for further improvements that can increase the credibility of results in psychological science (e.g., more Registered Reports that publish results independent of outcomes). The results can also help readers of psychological science to chose significance criteria that match their personal preferences for risk and their willingness to “err on the side of discovery” (Bem, 2004).
2 thoughts on “Replicability Report 2023: Psychological Science”