The goal of empirical sciences is to rely on observations to test theories. As it is typically not possible to observe all relevant phenomena, empirical sciences often rely on samples to make claims that are assumed to generalize to all observations (i.e., the population). The generalization of results from samples to populations works pretty well, when the phenomenon is clear (e.g., it is easier to see things during the day than at night, older people are more likely to die than younger people, people who have sex are more likely to have children, etc., etc.). It becomes more difficult to draw the correct conclusions about populations when samples are small and the relationship between two variables is less obvious (e.g., does eating more vegetables lead to a longer life, does a subliminal presentation of a coke bottle make people drink more coke, does solving crosswords reduce the risk of dementia, etc., etc.). When empirical data are used to answer non-obvious questions, it is possible that a single study will produce the wrong answer. There are many names for these false answers such as Type 1 error (Neyman & Pearson, 1928), False Positives (Simons, Nelson, & Simonsohn, 2011, False Relationships (Ioannidis, 2005), or False Discoveries (Soric, 1989). I will use the term False Discoveries because it is used most commonly in the literature that discusses the risk of false discoveries (Bartos & Schimmack, 2022).
Whether a study produced a false discovery depends on many factors. Most important, it depends on the specification of the hypotheses that are being tested. For example, a study might find that exercising more than 1 hour a week extends life expectancy by 216 days. The researchers conclude that the population effect size exactly matches their estimate in the sample. This claim is unlikely to be true because sampling error will produce different estimates of the population effect size. Thus, the risk that the discovery is false is very high and practically 100%. It is well known among statisticians that point-estimates of point-hypotheses are virtually always false. The solution to this problem is to propose a range of values. The wider the range of values, the more likely it is that the discovery is true. For example, based on their finding of a difference of 216 days, researchers might simply claim that exercise has a positive effect on life-expectancy without saying anything about the magnitude of the effect. It could be 1 day or several years. This conclusion is more likely to be true than the conclusion that the effect is exactly 216 days. The problem with this conclusion is that it does not tell us how big the benefits are. Few people might push themselves to exercise regularly, if the benefit is 1 day. More people might be willing to do so, if the effect is 1 year or more. While precise estimates of effect sizes are desirable, it is often not possible to get more precise estimates because sampling error is too large.
Continuing with the example of exercise, a difference of 219 days is a very small difference compared to the large variability in mortality. Assume that the average life-expectancy is 80 years and that the standard deviation is 10 years. Accordingly, 95% of people die within an age range of 60 to 100 (the real distribution is skewed, but that is not relevant for this example). Compared to the natural variability in life expectancy, 219 days is a very small difference. 219 days are 0.60 years and 0.60 years are 0.060 standard deviations. Effects of this magnitude are statistically small and it would require large samples to provide evidence that there is a positive effect of exercise. A sample size of N ~ 4,500 participants is is needed to reduce sampling error to .03, which yields a statistically significant result with the standard criterion for statistical significance, z = .06/.03 = 2.00, p = .046.
In conclusion, while we would like to know the direction and magnitude of effects in populations, empirical studies are often unable to provide this information. Therefore, scientists settle for answers that their studies can provide. At a minimum, scientists try to determine the sign of a relationship. For example, researchers have studied whether having children INCREASES or DECREASES happiness or sex differences in hundreds of traits. While magnitude of differences is important, the first question is often whether there is relationship between two variables and the most common conclusion drawn in empirical articles is that there is a positive or negative relationship. Thus, the most common false discoveries are claims where the results of a study lead to the conclusion of a positive relationship when the population relationship is not positive or the conclusion that there is a negative relationship when there is no negative relationship in the population.
There is a lot of confusion among statisticians and users about statistics about the hypotheses that are being tested in empirical studies. The confusion arises from the fact that most studies test two hypotheses simultaneously with a single test (Hodges & Lehmann, 1954). Take having children and happiness as an example. There are many reasons why children could increase and decrease happiness and the overall effect in the population is unclear. To test the hypothesis that children increase happiness, we can test the hypothesis that the difference (happiness of people with children minus happiness of people without children) is positive, d > 0. To test the hypothesis that children make people less happy, we can test the hypothesis that the difference score is negative, d < 0. to test both hypotheses simultaneously, we can test the hypothesis that there is no difference d = 0 and a statistically significant result allows us to reject the d = 0 hypothesis in favor of d > 0, if we observe a positive difference and in favor of d < 0 if we observe a negative difference.
It is a misunderstanding that rejecting the hypothesis d = 0 only tells us that there is an effect and does not tell us anything about the direction of the effect. When we accept d > 0, we are not only rejecting d = 0, but also rejecting d < 0. And when we accept d < 0, we are not only rejecting d = 0, but also d > 0.
Any decision in favor of a hypothesis implies that there is a risk that the decision was wrong. We may conclude that children increase happiness, when in fact there is no effect or a negative effect or we may conclude that children decrease happiness when having children has no effect on happiness or increases happiness.
In conclusion, empirical studies aim to provide information about populations based on information in samples. Sampling error can distort the results in samples and lead to false conclusions. Conclusions about the magnitude of effects require large samples. Empirical studies, especially of new questions, often settle for conclusions about the direction of an effect. These conclusions can be false when a significant result in a sample suggests a relationship in one direction, but there is no relationship or a relationship in the opposite direction in the population.
What is statistical significance?
Without going into the details of significance testing, it is necessary to point out that scientists have control over the risk of a false discovery. As noted above, it is riskier to make precise predictions about an effect size (e.g., exercise increases life-expectancy by 100 to 300 days), than to draw conclusions about the direction of an effect (exercise increases longevity by 1 day or more).
Another way to control the risk of a false discovery is to reduce sampling error. It is sometimes argued that scientists could also increase effect sizes, but that is not always possible. How would we increase the effect size of having children on happiness? The easiest and sometimes only way to decrease sampling error is to increase sample sizes. As noted above, 4,500 people are needed to get a sampling error of .03 to produce a statistically significant result when the effect size is .06 standard deviations and we require a p-value below .05 to conclude that exercise has a positive effect on longevity. What does this 5% criterion for statistical significance mean. It means that if we repeat the study over and over again with 4,500 new people, we would get p-values below .05 no more than 5% of the time when exercise has no effect. When the effect size is exactly 0, we would expect half of the significant results to be negative (and give us false information that exercise decreases life-expectancy) and half of the results to be positive (false discovery of positive effects in the population).
Some statisticians have argued that the 5% criterion is to liberal in these days when so many scientists are testing many hypotheses and have computers to run many statistical tests. This might lead to many false discoveries. A simple solution to this problem is to lower the criterion value, which is done in some fields. For example, particle physics uses p < 0.0000006 as a criterion to avoid false discoveries (e.g., discovery of the Higgs-Boson particle). Molecular geneticists also use a similarly low criterion when they search for genetic variants that predict risks for depression or other mental illnesses. However, there is a cost to lowering the risk of a false discovery. A lower criterion value requires even larger samples to produce significant results. For example, N ~ 9,000 participants would be needed to obtain significance with an effect size of d = 0.06 to get significance with a criterion of p < .005 that some statisticians have suggested (Benjamin et al., 2017).
In sum, scientists can control the risk of false discoveries by demanding more or less empirical evidence for a claim. While demanding stronger evidence reduces the risk of false discoveries, it also limits the ability to make true discoveries with limited resources when effect sizes are small. Ideally, researchers would set their criterion for statistical evidence to maintain a low risk of false discoveries while allowing for as many true discoveries as possible. To do so, they need information about the risk of false discoveries.
How Many False Discoveries Do Scientists Make?
As explained before, to determine whether a discovery is true or false requires a comparison of the results in a sample to the effect in the population and population effects are by definition not observable. Not surprisingly, discussion of false positive rates resemble discussions among Medieval philosophers how many angles can dance on the head of a pin.
A popular claim is that the nil-hypothesis is practically never true because effect sizes are never exactly zero. Thus, rejecting the hypothesis that the effect size is exactly zero is never wrong and there are no false discoveries. This argument ignores that researchers do not just reject the null-hypothesis, but draw inferences about the sign of the effect. Thus, sign errors are possible. Moreover, many effect sizes can be so small that they are practically zero. For example, if exercise extends life expectancy by 1 day, the standardized effect size is 0.003 standard deviations (SD = 10 years). While this value is not zero, it is practically impossible to demonstrate that it is different from zero. Thus, the argument that false discoveries never occur is logically invalid.
The argument also sounds implausible in the face of concerns that many published results might be false discoveries because researchers use statistical tricks to produce significant results. Simmons et al. (2011) showed with simulations that these tricks could produce false discoveries in over 50% of studies. A large number of replication failures in some scientific disciplines (e.g., experimental social psychology) has also led to widespread concerns that false discoveries are common (Open Science Collaboration, 2015). Finally, Ioannidis speculated that some areas of medicine have false discovery rates over 50% because they test thousands of false hypotheses.
I call these speculating meta-physical because they rely on unproven assumptions and the wide variation in conclusions can be traced to the variation in assumptions. These speculations are not very helpful for applied researchers who want to reduce the risk of false discoveries while still being able to make discoveries with limited resources.
It is not possible to estimate the false discovery risk for a single study, but it is possible to do so for sets of studies from the same field. There have been numerous attempts to estimate the false discovery risk empirically, but simulation studies have shown problems with the underlying models. The main problem with these models is that they try to estimate the rate of false discoveries. This is impossible because it is impossible to distinguish small effect sizes from each other, especially in small samples. Nobody knows whether the population effect size is d = -.05, 0, or .05. Once more metaphysical assumptions are needed to make these models work, but the assumptions influence the conclusions. To avoid this problem, Bartos and Schimmack (2022) relied on Soric’s (1989) approach to estimate the maximum false discovery rate. The maximum false discovery rate is a function of the discovery rate and the discovery rate is the percentage of significant results in a set of studies.
Schimmack and Bartos (2023) applied their model to abstracts of medical journals that reported the results of clinical trials. They found that 70% of abstracts reported a significant result. However, they also found evidence of selection bias. After correcting for selection bias, they estimated a discovery rate of 30% and a false discovery risk of 14%.
Another dataset that can be used to examine false discoveries in clinical trials are Cochrane Reviews. Cochrane reviews are meta-analyses of clinical trials. There are many types of clinical trials and some meta-analyses are based on fewer than 10 studies. However, there are sufficient Cochrane Reviews that have 10 or more studies and examine the effectiveness of a treatment against a placebo (194 reviews with 4,394 studies). All studies were scored so that positive values indicated the same sign as the meta-analytic z-score and negative values indicates a sign error. There were 14.5% sign errors, but only 0.75% significant sign errors (z < -1.96). Thus, we have a very low estimate of the false discovery rate in clinical trials with a placebo control condition.
Figure 1 shows a histogram of the z-scores and the fit of the z-curve model to the data. While positive and negative values are shown in the figure, but only positive values are used to fit the model.

The model fits the positive values well, but it underestimates sign errors. The most plausible explanation for this is that there is heterogeneity in effect sizes. However, the difference is relatively small. Due to the larger number of sign-reversals, the Observed Discovery Rate (39%; i.e., the number of significant results in the right direction) is lower than the expected discovery rate (44%). Thus, there is no evidence of selection bias that produces more significant results than predicted by the model.
According to Soric’s formula, an EDR of 44% implies a maximum false discovery rate of 7%. This is much higher than the observed false discovery rate of 0.75%. The reason is that Soric’s model assumes that true hypotheses are tested with 100% power. If average power is lower, the false discovery risk decreases. It is possible to obtain a better estimate of the false discovery risk by taking the expected replication rate into account. The expected replication rate is 62% and is composed of false discoveries that produce significant results in a positive direction with a 2.5% probability. Assuming that 7% of significant results are false discoveries implies an average power to detect true positive effects of 67%. With this power estimate, the false discovery risk decreases to 4.5%. This is still considerably higher than the actual false discovery rate of 0.75%. Thus, z-curve estimates of the false discovery risk are conservative and likely to overestimate the actual rate of false discoveries.
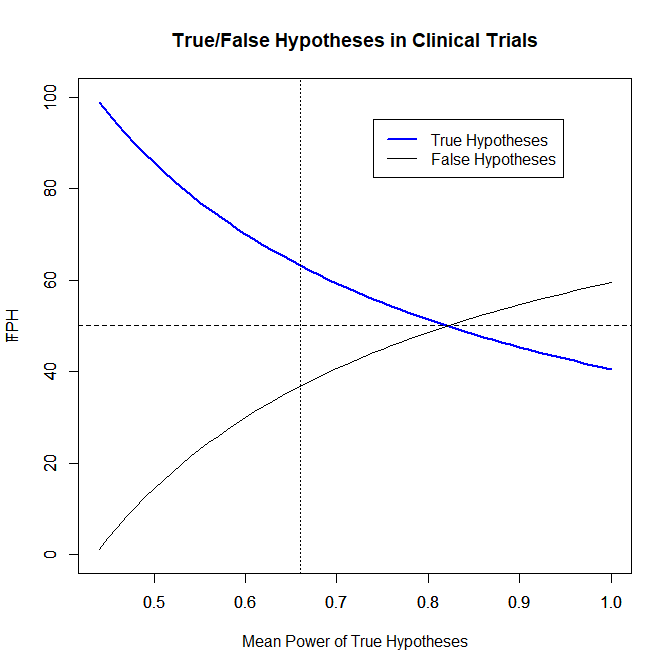
Z-curve also makes it possible to estimate the proportion of true and and false hypotheses that were tested. Once more, these estimates rely on the observable discovery rate and assumptions about the average power of studies that test true hypotheses. Figure 2 shows the percentage of true and false hypotheses for different levels of power. With 80% power, the ratio of true and false hypotheses is 1:1. With the estimated power of 67%, the ratio is about 3:2. Thus, there is no evidence that clinical trials test many more false than true hypotheses.
Conclusion
Concerns about high false discovery rates in science have produced many articles that ask for a new statistical approach to analyze data. Many of these articles are based on a misguided interpretation of significance testing and false assumptions about the number of false hypotheses that are being tested.
I showed that significance testing can be used to draw inferences about the direction of an effect in the population from a significant result in a sample. These directional inferences can be justified by interpreting the two-sided test of the null-hypothesis as two one-sided tests of the null-hypotheses that the effect is less or equal than zero (<= 0) or greater or equal than zero (> 0). While significance criteria control the rate of false discoveries in all tests, it remains unclear how many of the significant results are false discoveries. However, it is possible to estimate the false positive risk in sets of studies based on the percentage of significant results in all tests (i.e., the discovery rate). When no publication bias is present, the discovery rate can be directly observed. When selection bias is present, the discovery rate can be estimated using a model that takes selection bias into account (Bartos & Schimmack, 2022). I demonstrated that this approach produces conservative estimates of the false discovery risk and that the false discovery risk in clinical trials that test effectiveness against a placebo is very low. Thus, concerns about the credibility of clinical trials are based on wild speculations that are, ironically, not backed up by evidence. However, these results cannot be generalized to other disciplines. Claims about false discoveries in these areas need to be supported by empirical evidence and z-curve provides a valuable tool to provide this information, especially when selection bias is severe (e.g., experimental social psychology; Schimmack, 2020).
1 thought on “Meta-Science vs. Meta-Physics: How many false discoveries are there?”