You can find the report for 2024 here. https://replicationindex.com/2024/07/04/rr24-actapsy/
In the 2010s, it became apparent that empirical psychology has a replication problem. When psychologists tested the replicability of 100 results, they found that only 36% of the 97 significant results in original studies could be reproduced (Open Science Collaboration, 2015). In addition, several prominent cases of research fraud further undermined trust in published results. Over the past decade, several proposals were made to improve the credibility of psychology as a science. Replicability reports are the results of one of these initiatives.
The main problem in psychological science is the selective publishing of statistically significant results and the blind trust in statistically significant results as evidence for researchers’ theoretical claims. Unfortunately, psychologists have been unable to self-regulate their behavior and continue to use unscientific practices to hide evidence that disconfirms their predictions. Moreover, ethical researchers who do not use unscientific practices are at a disadvantage in a game that rewards publishing many articles without any concern about the replicability of these findings.
My colleagues and I have developed a statistical tools that can reveal the use of unscientific practices and predict the outcome of replication studies (Brunner & Schimmack, 2021; Bartos & Schimmack, 2022). This method is called z-curve. Z-curve cannot be used to evaluate the credibility of a single study. However, it can provide valuable information about the research practices in a particular research domain.
Replicability-Reports (RR) use z-curve to provide information about the research and publication practices of psychological journals. This information can be used by authors to chose journals they want to publish in, provides feedback to journal editors who have influence on selection bias and replicability of results published in their journals, and most importantly to readers of these journals.
Acta Psychologica
Acta Psychologica is an old psychological journal that was founded in 1936. The journal publishes articles from various areas of psychology, but cognitive psychological research seems to be the most common area.
So far, Acta Psychologica has published close to 6,000 articles. Nowadays, it publishes about 150 articles a year in 10 annual issues. Over the past 30 years, articles have an average citation rate of 24.48 citations, and the journal has an H-Index of 116 (i.e., 116 articles have received 116 or more citations). The journal has an impact factor of 2 which is typical of most empirical psychology journals.
So far, the journal has published 4 articles with more than 1,000 citations, but all of these articles were published in the 1960s and 1970s. The most highly cited article in the 2000s, examined the influence of response categories on the psychometric properties of survey items (Preston & Colman, 2000; 947 citations).
Given the multidisciplinary nature of the journal, the journal has a team of editors. The current editors are Mohamed Alansari, Martha Arterberry, Colin Cooper, Martin Dempster, Tobias Greitemeyer, Matthieu Guitton, and Nhung T Hendy.
Report
Replication reports are based on automatically extracted test-statistics (F-tests, t-tests, z-tests) from the text potion of articles. The reports do not include results reported as effect sizes (r), confidence intervals, or results reported in tables or figures.
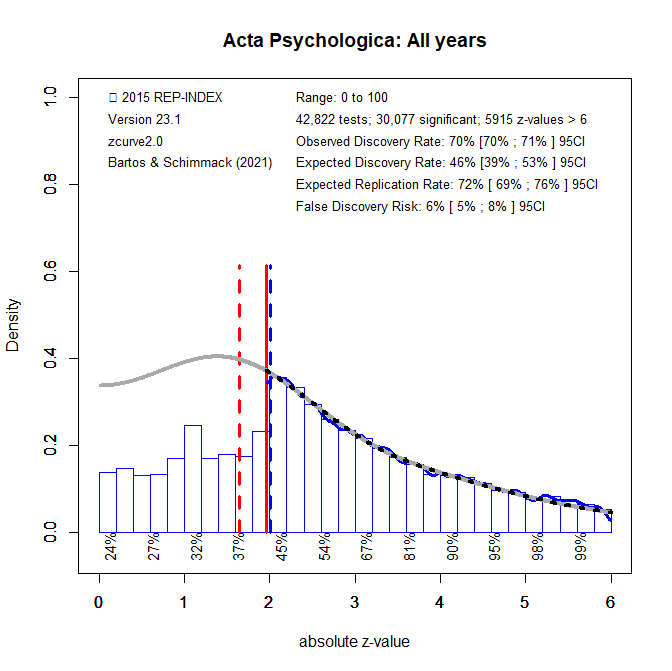
Figure 1 shows a z-curve plot for all articles from 2000-2022 (see Schimmack, 2023, for a detailed description of z-curve plots). The plot is essentially a histogram of all test statistics converted into absolute z-scores (i.e., the direction of an effect is ignored). Z-scores can be interpreted as the strength of evidence against the null-hypothesis that there is no statistical relationship between two variables (i.e., the effect size is zero and the expected z-score is zero).
A z-curve plot shows the standard criterion of statistical significance (alpha = .05, z = 1.97) as a vertical red line. It also shows a dotted vertical red line at z = 1.65 because results with z-scores between 1.65 and 1.97 are often interpreted as evidence for an effect using a more liberal alpha criterion, alpha = .10, a one-sided test, or with qualifiers (e.g., marginally significant). Thus, values in this range cannot be interpreted as reporting of results that failed to support a hypothesis.
Z-curve plots are limited to values less than z = 6. The reason is that values greater than 6 are so extreme that a successful replication is all but certain, unless the value is a computational error or based on fraudulent data. The extreme values are still used for the computation of z-curve statistics, but omitted from the plot to highlight the shape of the distribution for diagnostic z-scores in the range from 2 to 6.
Z-curve fits a statistical model to the distribution of these z-scores. The predicted distribution is shown as a grey curve. Importantly, the model is fitted to the significant z-scores, but the model makes a prediction about the distribution of non-significant results. This makes it possible to examine publication bias (i.e., selective publishing of significant results).
Selection for Significance
Visual inspection of Figure 1 shows that there are fewer observed non-significant results (z-scores between 0 and 1.65) than predicted z-scores. This is evidence of selection for significance. It is possible to quantify the bias in favor of significant results by comparing the proportion of observed significant results (i.e., the observed discovery rate, ODR) with the expected discovery rate (EDR) based on the grey curve. While the observed discovery rate is 70%, the expected discovery rate is 46%. The 95% confidence intervals of the ODR and EDR do not overlap. Thus, there is clear evidence of selection bias in this journal.
False Positive Risk
The replication crisis has led to concerns that many or even most published results are false positives (i.e., the true effect size is zero). The false positive risk is inversely related to the expected discovery rate and z-curve uses the EDR to estimate the risk that a published significant result is a false positive result.
An EDR of 46% implies that no more than 6% of the significant results are false positives. The 95%CI puts the upper limit at false positive results at 8%. Thus, concerns that most published results are false are overblown. However, a focus on false positives is misleading because it ignores effect sizes. Even if an effect is not exactly zero, it may be too small to be relevant (i.e., practically significant). Readers of original articles need to focus on confidence intervals of effect size estimates and take into account that selection for significance inflates effect size estimates. Thus, published results are likely to show the correct direction of a relationship, but may not provide enough information to determine whether a statistically significant result is theoretically or practically important.
Expected Replication Rate
The expected replication rate estimates the percentage of studies that would produce a significant result again if exact replications with the same sample size were conducted. A comparison of the ERR with the outcome of actual replication studies shows that the ERR is higher than the actual replication rate. There are several factors that can explain this discrepancy such as the difficulty of conducting exact replication studies. Thus, the ERR is an optimist estimate. A conservative estimate is the EDR. The EDR predicts replication outcomes if significance testing does not favor studies with higher power (larger effects and smaller sampling error) because statistical tricks make it just as likely that studies with low power are published.
The ERR of 72% suggests that the majority of results published in Acta Psychologica is replicable, but the EDR allows for a replication rate as low as 46%. Thus, replicability is estimated to range from 46% to 72%. Actual replications of cognitive research suggest that 50% of results produce a significant result again (Open Science Collaboration, 2015). This finding is consistent with the present results. Taking the low false positive risk into account, most replication failures are likely to be false negatives due to insufficient power in the original and replication studies. This suggests that replication studies should increase sample sizes to have sufficient statistical power to replicate true positive effects.
Time Trends
To examine changes in credibility over time, z-curves were fitted to test statistics for each year from 2000 to 2022. The results were regressed on time and time-squared to allow for non-linear relationships.
Figure 2 shows the ODR and EDR to examine selection bias. The ODR showed a significant linear trend, indicating more publications of non-significant results, b = -.43 percentage points per year (SE = .13). The EDR showed no significant trends, p > .20.

The decrease in the ODR implies that selection bias is decreasing over time. However, a low EDR still implies that many studies that produced non-significant results remain unpublished. Moreover, it is unclear whether researcher are reporting more focal results as non-significant. To investigate this question it is necessary to hand-code focal tests (see Limitation section).
Figure 3 shows the false discovery risk (FDR) and the estimated replication rate (ERR). It also shows the expected replication failure rate (EFR = 1 – ERR). A comparison of the EFR with the FDR provides information for the interpretation of replication failures. If the FDR is close to the EFR, many replication failures may be due to false positive results in original studies. In contrast, if the FDR is low, most replication failures are likely to be false negative results in underpowered replication studies.
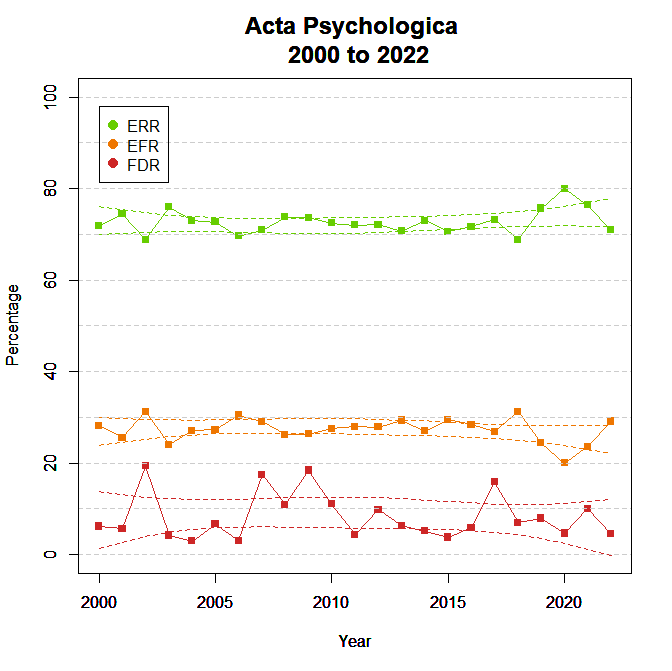
There were no linear or quadratic time trends for the ERR, p > .2. The FDR is based on the EDR that also showed no time trends. Thus, the estimates for all years can be used to obtain more precise estimates than the annual ones. Based on the results in Figure 1, the expected failure rate is 28% and the FDR is 5%. This suggests that replication failures are more likely to be false negatives due to modest power rather than false positive results in original studies. To avoid false negative results in replication studies, these studies should use larger samples.
Retrospective Improvement of Credibility
The criterion of alpha = .05 is an arbitrary criterion to make decisions about a hypothesis. It was used by authors to conclude that an effect is present and editors accepted articles on the basis of this evidence. However, readers can demand stronger evidence. A rational way to decide what alpha criterion to use is the false positive risk. A lower alpha, say alpha = .005, reduces the false positive risk, but also increases the percentage of false negatives (i.e.., there is an effect even if the p-value is above alpha).
Figure 4 shows the implications of using different significance criteria for the observed discovery rate (lower alpha implies fewer significant results).
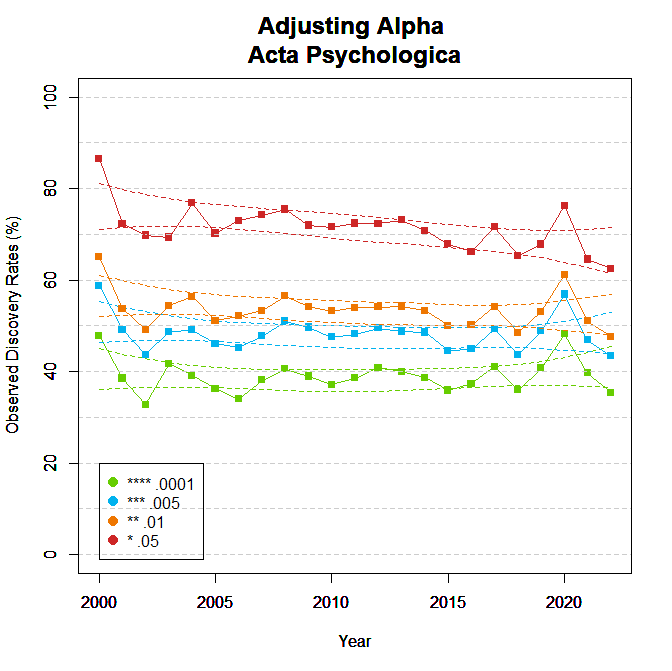
Using alpha = .01 lowers the discovery rate by about 20 percentage points. The stringent criterion of alpha = .001 lowers it by another 20 percentage points to around 40% discoveries. This would mean that many published results that were used to make claims no longer have empirical support.
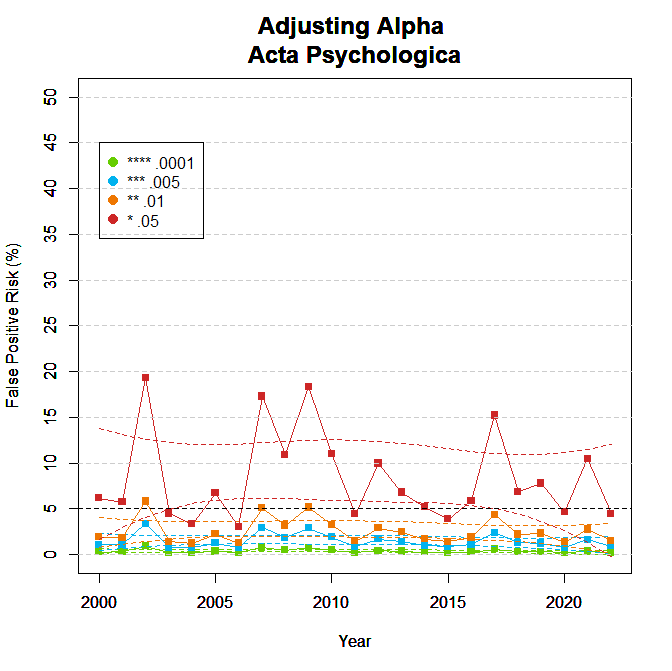
Figure 5 shows the effects of alpha on the false positive risk. Even alpha = .01 is sufficient to ensure a false positive risk of 5% or less. Thus, alpha = .01 seems a reasonable criterion to avoid too many false positive results without discarding too many true positive results. Authors may want to increase statistical power to increase their chances of obtaining a p-value below .01 when their hypotheses are true to produce credible evidence for their hypotheses.
Limitations
The main limitation of these results is the use of automatically extracted test statistics. This approach cannot distinguish between theoretically important statistical results and other results that are often reported, but do not test focal hypotheses (e.g., testing statistical significance of a manipulation check, reporting a non-significant result for a factor in a complex statistical design that was not expected to produce a significant result).
For the journal Acta Psychologica, hand-coded data are available for the years 2010 and 2020 from a study that examines changes in replicability from 2010 to 2020. Figure 6 shows the results.

The most notable difference is the higher observed discovery rate for hand-coding of focal hypothesis tests (94%) than for automatically extracted test statistics (70%). Thus, results based on automatically extracted data underestimate selection bias.
In contrast, the expected discovery rates are similar in hand-coded (46%) and automatically extracted (46%) data. Given the small set of hand-coded tests, the 95% confidence interval around the 46% estimate is wide, but there is no evidence that automatically extracted data overestimate the expected discovery rate and by implication underestimate the false discovery rate.
The ERR for hand-coded focal tests (70%) is also similar to the ERR for automatically extracted tests (72%).
This comparison suggests that the main limitation of automatic extraction of test statistics is that this method underestimates the amount of selection bias because authors are more likely to report non-focal tests than focal results that are not significant. Thus, selection bias remains a pervasive problem in this journal.
Conclusion
The replicability report for Acta Psychologica shows clear evidence of selection bias, although there is a trend selection bias may be decreasing in the last years. The results also suggest that replicability is in a range from 40% to 70%. This replication rate does not deserve to be called a crisis, but it is does suggest that many studies are underpowered and require luck to get a significant result. The false positive risk is modest and can be controlled by setting alpha to .01. Finally, time trend analysis show no important changes in response to the open science movement. An important goal is to reduce the selective publishing of studies that worked (p < .05) and to hide studies that did not work (p > .05). Preregistration or registered reports can help to address this problem. Given concerns that most published results in psychology are false positives, the present results are reassuring and suggest that most results with p-values below .01 are true positive results.