Category Archives: SWLS

The Pie Of Happiness

This blog post reports the results of an analysis that predicts variation in scores on the Satisfaction with Life Scale (Diener et al., 1985) from variation in satisfaction with life domains. A bottom-up model predicts that evaluations of important life domains account for a substantial amount of the variance in global life-satisfaction judgments (Andrews & Withey, 1976). However, empirical tests of this prediction fail to show this (Andrews & Withey, 1976).

Here I used the data from the Panel Study of Income Dynamics (PSID) well-being supplement in 2016. The analysis is based on 8,339 respondents. The sample is the largest national representative sample with the SWLS, although only respondents 30 or order are included in the survey.

The survey also included Cantril’s ladder, which was included in the model, to identify method variance that is unique to the SWLS and not shared with other global well-being measures. Andrews & Withey found that about 10% of the variance is unique to a specific well-being scale.

The PSID-WB module included 10 questions about specific life domains: house, city, job, finances, hobby, romantic, family, friends, health, and faith. Out of these 10 domains, faith was not included because it is not clear how atheists answer a question about faith.

The problem with multiple regression is that shared variance among predictor variables contributes to the explained variance in the criterion variable, but the regression weights do not show this influence and the nature of the shared variance remains unclear. A solution to this problem is to model the shared variance among predictor variables with structural equation modeling. I call this method Variance Decomposition Analysis (VDA).

MODEL 1

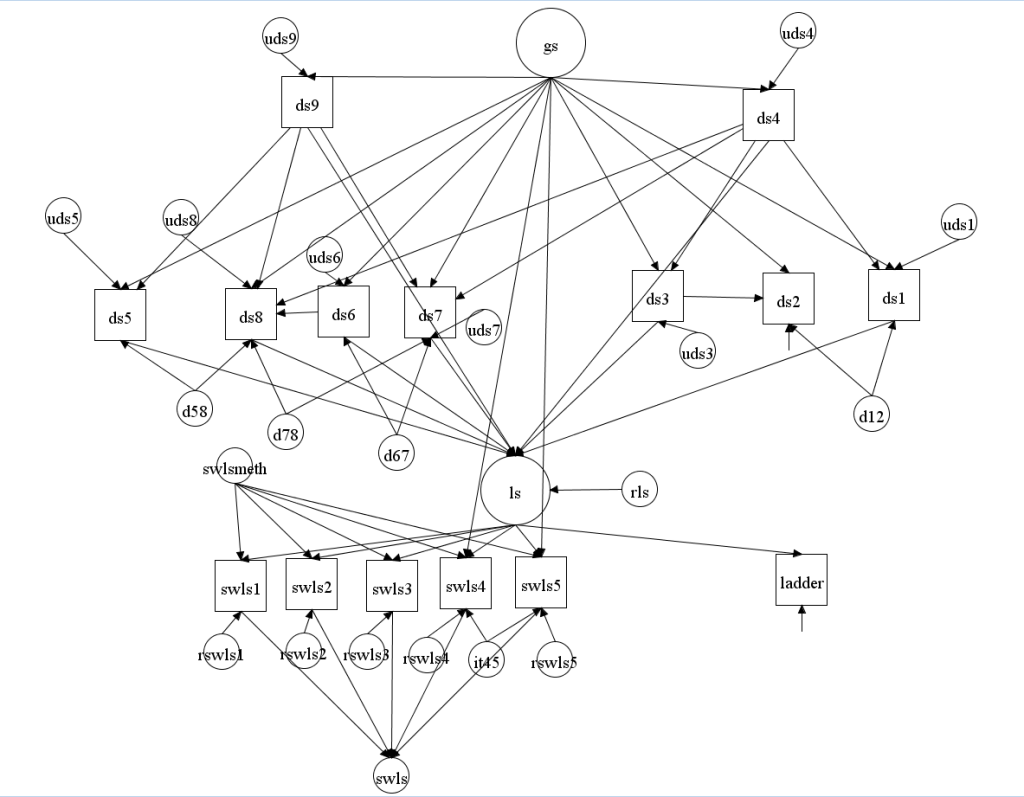
Model 1 used a general satisfaction (GS) factor to model most of the shared variance among the nine domain satisfaction judgments. However, a single factor model did not fit the data, indicating that the structure is more complex. There are several ways to modify the model to achieve acceptable fit. Model 1 is just one of several plausible models. The fit of model 1 was acceptable, CFI = .994, RMSEA = .030.

Model 1 used two types of relationships among domains. For some domain relationships, the model assumes a causal influence of one domain on another domain. For other relationship, it is assumed that judgments about the two domains rely on overlapping information. Rather than simply allowing for correlated residuals, this overlapping variance was modelled as unique factors with constrained loadings for model identification purposes.

Causal Relationships

Financial satisfaction (D4) was assumed to have positive effects on housing (D1) and job (D3). The rational is that income can buy a better house and pay satisfaction is a component of job satisfaction. Financial satisfaction was also assumed to have negative effects on satisfaction with family (D7) and friends (D8). The reason is that higher income often comes at a cost of less time for family and friends (work-life balance/trade-off).

Health (D9) was assumed to have positive effects on hobbies (D5), family (D7), and friends (D8). The rational was that good health is important to enjoy life.

Romantic (D6) was assumed to have a causal influence on friends (D8) because a romantic partner can fulfill many of the needs that a friend can fulfill, but not vice versa.

Finally, the model includes a path from job (D3) to city (D2) because dissatisfaction with a job may be attributed to few opportunities to change jobs.

Domain Overlap

Housing (D1) and city (D2) were assumed to have overlapping domain content. For example, high house prices can lead to less desirable housing and lower the attractiveness of a city.

Romantic (D6) was assumed to share content with family (D7) for respondents who are in romantic relationships.

Friendship (D8) and family (D7) were also assumed to have overlapping content because couples tend to socialize together.

Finally, hobby (D5) and friendship (D8) were assumed to share content because some hobbies are social activities.

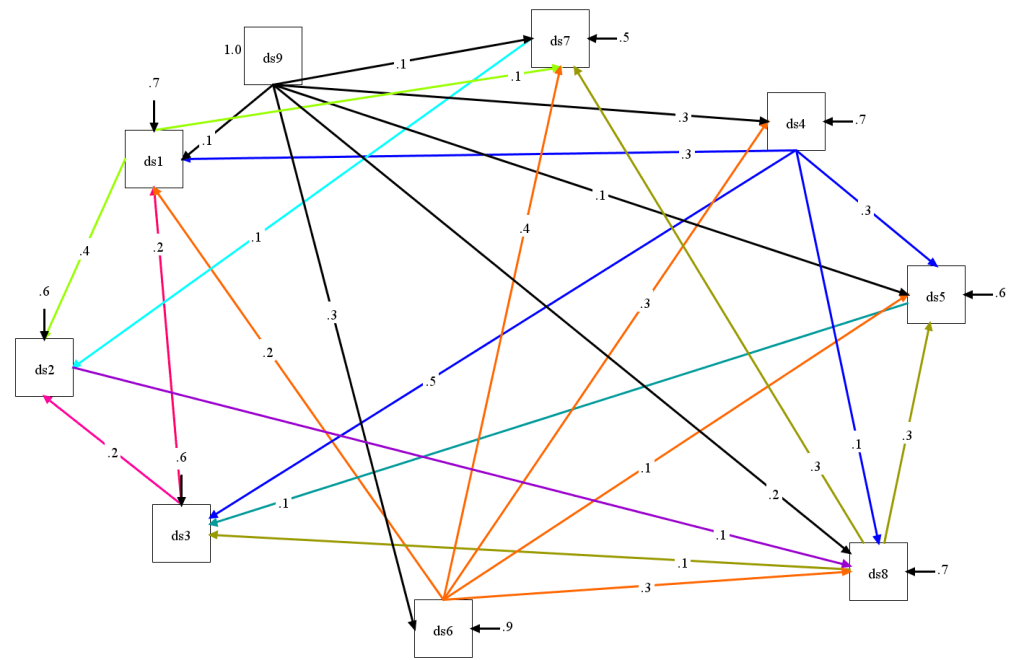
Figure 2 shows the same figure with parameter estimates.

The most important finding is that the loadings on the general satisfaction (GS) factor are all substantial (> .5), indicating that most of the shared variance stems from variance that is shared across all domain satisfaction judgments.

Most of the causal effects in the model are weak, indicating that they make a negligible contribution to the shared variance among domain satisfaction judgments. The strongest shared variances are observed for romantic (D6) and family (D7) (.60 x .47 = .28) and housing (D1) and city (D2) (.44 x .43 = .19).

Model 1 separates the variances of the nine domains into 9 unique variances (the empty circles next to each square) and five variances that represent shared variances among the domains (GS, D12, D67, D78, D58). This makes it possible to examine how much the unique variances and the shared variances contribute to variance in SWLS scores. To examine this question, I created a global well-being measurement model with a single latent factor (LS) and the SWLS items and the Ladder measures as indicators. The LS factor was regressed on the nine domains. The model also included a method factor for the five SWLS items (swlsmeth). The model may look a bit confusing, but the top part is equivalent to the model already discussed. The new part is that all nine domains have a causal error pointing at the LS factor. The unusual part is that all residual variances are named, and that the model includes a latent variable SWLS, which represents the sum score of the five SWLS items. This makes it possible to use the model indirect function to estimate the path from each residual variance to the SWLS sum score. As all of the residual variance are independent, squaring the total path coefficients yields the amount of variance that is explained by a residual and the variances add up to 1.

GS has many paths leading to SWLS. Squaring the standardized total path coefficient (b = .67) yields 45% of explained variance. The four shared variances between pairs of domains (d12, d67, d78, d58) yield another 2% of explained variance for a total of 47% explained variance from variance that is shared among domains. The residual variances of the nine domains add up to 9% of explained variance. The residual variance in LS that is not explained by the nine domains accounts for 23% of the total variance in SWLS scores. The SWLS method factor contributes 11% of variance. And the residuals of the 5 SWLS items that represent random measurement error add up to 11% of variance.

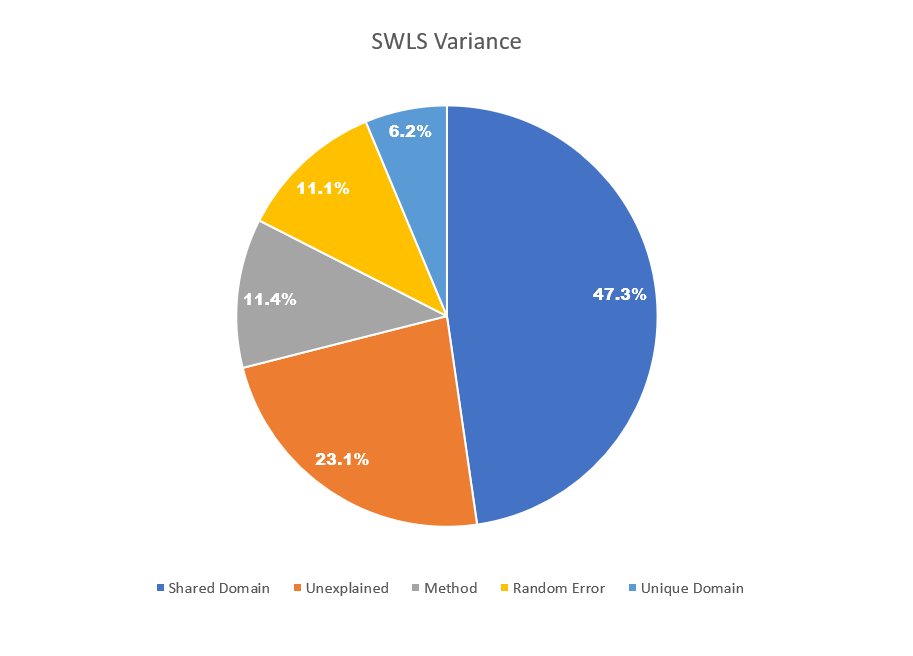
These results show that only a small portion of the variance in SWLS scores can be attributed to evaluations of specific life domains. Most of the variance stems from the shared variance among domains and the unexplained variance. Thus, a crucial question is the nature of these variance sources. There are two options. First, unexplained variance could be due to evaluations of specific domains and shared variance among domains may still reflect evaluations of domains. In this case, SWLS scores would have high validity as a global measure of subjective evaluations of domains. The other possibility is that shared variance among domains and unexplained variance reflects systematic measurement error. In this case, SWLS scores would have only 6% valid variance if they are supposed to reflect global evaluations of life domains. The problem is that decades of subjective well-being research have failed to provide an empirical answer to this question.

Model 2: A bottom-up model of shared variance among domains

Model 1 assumed that shared variance among domains is mostly produced by a general factor. However, a general factor alone was not able to explain the pattern of correlations and additional relationships were added to the model Model 2 assume that shared variance among domains is exclusively due to causal relationships among domains. Model fit was good, CFI = .994, RMSEA = .043.

Although the causal network is not completely arbitrary, it is possible to find alternative models. More important, the data do not distinguish between Model 1 and Model 2. Thus, the choice of a causal network or a general factor is arbitrary. The implication is that it is not clear whether 47% of the variance in SWLS scores reflect evaluations of domains or some alternative, top-down, influence.

This does not mean that it is impossible to examine this question. To test these models against each other, it would be necessary to include objective predictors of domain (e.g., income, objective health, frequency of sex, etc.) in the model. The models make different predictions about the relationship of these objective indicators to the various domain satisfactions. In addition, it is possible to include measures of systematic method variance (e.g., halo bias) or predictors of top-down effects (e.g., neuroticism) in the model. Thus, the contribution of domain-specific evaluations to SWLS scores is an empirical question.

Conclusion

It is widely assumed that the SWLS is a valid measure of subjective well-being and that SWLS scores reflect a summary of evaluations of specific life domains. However, regression analyses show that only a small portion of the variance in global well-being judgments is explained by unique variance in domain satisfaction judgments (Andrews & Withey, 1976). In fact, most of the variance stems from the shared variance among domain satisfaction judgments (Model 1). Here I show that it is not clear what this shared variance represents. It could be mostly due to a general factor that reflects internal dispositions (e.g., neuroticism) or method variance (halo bias), but it could also result from relationships among domains in a complex network of interdependence. At present it is unclear how much top-down and bottom-up processes contribute to shared variance among domains. I believe that this is an important research question because it is essential for the validity of global life-satisfaction measures like the SWLS. If respondents are not reflecting about important life domains when they rate their overall well-being, these items are not measuring what they are supposed to measure; that is, they lack construct validity.

Construct Validity of the Satisfaction with Life Scale

With close to 10,000 citations in WebofScience, Ed Diener’s article that introduced the “Satisfaction with Life Scale” (SWLS) is a citation classic in well-being science. While single-item measures are used in large national representative surveys (e.g., General Social Survey, German Socio-Economic Panel, World Value Survey), psychologists prefer multi-item scales because they have higher reliability and therewith also higher validity.

Study 1 in Diener et al. (1985) demonstrated that the SWLS shows convergent validity with single-item measures like Cantril’s ladder, r = .62, .66), and Andrews and Withey’s Delighted-Terrible scale, r = .68, .62. Attesting to the higher reliability of the 5-item SWLS is the finding that the internal consistency was .87 and the retest reliability was r = .82. These results suggest that the SWLS and single-item measures measure a single construct with different amounts of random measurement error.

The important question for well-being scientists who use the SWLS and other global well-being measures is whether these items measure what they are intended to measure. To answer this question, we need to know what life-satisfaction measures are intended to measure.

Diener et al. (1985) draw on Andrews and Withey’s (1976) model of well-being perceptions. Accordingly, life-satisfaction judgments are based on subjective evaluations of important concerns.

Judgments of satisfaction are dependent upon a comparison of one’s circumstances with what is thought to be an appropriate standard. It is important to point out that the judgment of how satisfied people are with their present state of affairs is based on a comparison with a standard which each individual sets for him· or herself; it is not externally imposed. It is a hallmark of the subjective well-being area that it centers on the person’s own judgments, not upon some criterion which is judged to be important by the researcher (Diener, 1984).

This definition of life-satisfaction makes two important points. First, it is assumed that respondents are thinking about their circumstances when they judge their life-satisfaction. That is, we we can think about life-satisfaction as an attitude with an individual’s life as the attitude object. Just like individuals are assumed to think about the important features of Coca Cola when they are asked to report their attitudes towards Coca Cola, respondents are assumed to think about the important features of their lives, when they report their attitudes towards their lives.

The second part of the definition makes it clear that attitudes towards lives are based on subjectively chosen criteria to evaluate lives. Just like individuals may like the taste of Coke or dislike the taste of Coke, the same life circumstance can be evaluated differently by different individuals. Some may be extremely satisfied with an income of $100,000 and some may be extremely dissatisfied with the same income. For students, some students may be happy with a GPA of 2.9, others may be unhappy with the same GPA. The reason is that the evaluation criteria or standards can very across individuals and that there is no objective criterion that is used to evaluate life circumstances. This makes life-satisfaction judgments an indicator of subjective well-being.

The reliance on subjective evaluation criteria also implies that individuals can give different weights to different life domains. For some people, family life may be the most important domain, for others it may be work (Andrews & Withey, 1976). The same point is made by Diener et al. (1985).

For example, although health, energy, and so forth may be desirable, particular individuals may place different values on them. It is for this reason that ,we need to ask the person for their overall evaluation of their life, rather than summing across their satisfaction with specific domains, to obtain a measure of overall life-satisfaction (p. 71).

This point makes sense. If life-satisfaction judgments on evaluations of life circumstances and individuals place different emphasis on different life domains, more important domains should have a stronger influence on global life-satisfaction judgments (Schimmack, Diener, & Oishi, 2002). However, starting with Andrews and Withey (1976), empirical tests of this prediction have failed to confirm it. When individuals are asked to rate the importance of life domains, and these weights are used to compute a weighted average, the weighted average is not a better predictor of global judgments than a simple unweighted average (Rohrer & Schmukle, 2018).

Although this fact has been known since 1974, its theoretical significance has been ignored. There are two possible interpretations of this finding. On the one hand, it could be that importance ratings are invalid. That is, people don’t really know what is important to them and the actual importance is best revealed by the regression weights when global life-satisfaction ratings are regressed on domain satisfaction either across participants or within-participants over time. The alternative explanation is more troubling. In this case, global life-satisfaction judgments are invalid. Maybe these judgments are not based on subjective evaluations of life-circumstances.

Schwarz and Strack (1999) made the point that global life-satisfaction judgments are based on quick heuristics that produce invalid information. The problem of their criticism is that they focused on unstable sources such as mood or temporarily accessible information as the main sources of life-satisfaction judgments. This model fails to explain the high temporal stability of life-satisfaction judgments. (Schimmack & Oishi, 2005).

However, it is possible that stable factors produce systematic method variance in life-satisfaction judgments. For example, Andrews and Withey (1976) suggested that halo bias could influence ratings of domain satisfaction and life-satisfaction. They used informant ratings to rule out this possibility, but their test of this hypothesis was statistically flawed (Schimmack, 2019). Thus, it is possible that a substantial portion of the reliable variance in SWLS scores is halo bias.

Diener et al. (1985) tried to address the problem of systematic measurement error in two ways. First, they included the Marlowe-Crowne Social Desirability (MCSD) scale to measure social desirable responding and found no correlation with SWLS scores, r = .02. The problem is that the MCSD is not a valid measure of socially desriable responding or halo bias, but rather a measure of agreeableness and conscientiousness. Thus, the correlation is better interpreted as evidence that life-satisfaction is fairly independent of these personality traits. Second, Study 3 with 53 elderly residents of Urbana-Champaign included an interview with two trained interviewers. Afterwards, the interviewers made ratings of the interviewees’ well-being. The averaged interviewer’ ratings correlated r = .43 with the self-ratings of well-being. The problem here is that individuals who are motivated to present a positive image in their SWLS ratings are also likely to present a positive image in an interview. Moreover, the conveyed sense of well-being could reflect individuals’ personality more than their life-circumstances. Thus, it is not clear how much of the agreement between self-ratings and interviewer-ratings reflects evaluations of actual life-circumstances.

The most recent review article by Ed Diener was published last year; “Advances and Open Questions in the Science of Subjective Well-Being” (Diener, Lucas, & Oishi, 2018). The article makes it clear that the construct has not changed since 1985.

Subjective well-being (SWB) reflects an overall evaluation of the quality of a person’s life from her or his own perspective” (p. 1).

As the term implies, SWB refers to the extent to which a person believes or feels that his or her life is going well. The descriptor “subjective” serves to define and limit the scope of the construct: SWB researchers are interested in evaluations of the quality of a person’s life from that person’s own perspective.” (p. 2)

The authors also explicitly state that subjective well-being measures are subjective because individuals can focus on different aspects of their lives depending on their importance to them.

it is the subjective nature of the construct that gives it its power. This is due to the fact that different people likely weight different objective circumstances differently depending on their goals, their values, and even their culture” (p. 3).

The fact that global measures allow individuals to assign different weights to different domains is seen as a strength.

Presumably, subjective evaluations of quality of life reflect these idiosyncratic reactions to objective life circumstances in ways that alternative approaches (such as the objective list
approach) cannot. Thus, when evaluating the impact of events, interventions, or public-policy decisions on quality of life, subjective evaluations may provide a better mechanism for assessment than alternative, objective approaches
(p. 3).

The problem is that this claim requires empirical evidence to show that global life-satisfaction judgments are indeed more valid measures of subjective well-being than simple averages because they properly weigh information in accordance with individuals’ subjective preferences, and since 1976 this evidence has been lacking.

Diener et al.’s (2018) review glosses over this glaring problem for the construct validity of the SWLS and other global well-being measures.

Because most measures are simple self-reports, considerable research addresses the psychometric properties of these types of assessments. This research consistently shows that existing self-report measures exhibit strong psychometric properties including high internal consistency when multiple-item measures are used; moderately strong test-retest reliability, especially over short periods of time; reasonable convergence with alternative measures (especially those that have also been shown to have high levels of reliability and validity); and theoretically meaningful patterns of associations with other constructs and criteria (see Diener et al., 2009, and Diener, Inglehart, & Tay, 2013, for reviews). There is little debate about the quality of SWB measures when evaluated using these traditional criteria.

While it is true that there is little debate, this does not mean that there is strong evidence for the construct validity of the SWLS. The open question is how much respondents are really conducting a memory search for information about important life domains, evaluate these domains based on subjective criteria, and then report an overall summary of these evaluations. If so, subjective importance weights should improve predictions, but they often do not. Moreover, in regression models individual life domains often contribute small amounts of unique variance (Andrews & Withey, 1976), and some important aspects like health often account for close to zero percent of the variance in life-satisfaction judgments.

Convergent Validity

One key feature of construct validity is convergent validity between two independent methods that measure the same construct (Campbell & Fiske, 1959). Ideally, multiple methods are used and it is possible to examine whether the pattern of correlations matches theoretical predictions (Cronbach & Meehl, 1955; Schimmack, 2019). Diener et al. (2018) mention some evidence of convergent validity.

For example, Schneider and Schimmack (2009) conducted a meta-analysis of the correlation between self and informant reports, and they found that there is reasonable agreement (r = .42) between these two methods of assessing SWB.

The problem with this evidence is that the correlation between two measures only shows that both methods are valid, but it is not possible to quantify the amount of valid variance in self-ratings or informant ratings, which requires at least three methods (Andrews & Withey, 1976; Zou, Schimmack, & Gere, 2013). Theoretically, it would be possible that most of the variance in self-ratings is valid and that informant ratings are rather invalid. This is what Andrews and Withey (1976) claimed with estimates of 65% valid variance in self-ratings and 15% valid variance in informant ratings, with a correlation of r = .32. However, their model was incorrect and allowed for method variance in self-ratings to inflate the factor loading of self-ratings.

Zou et al. (2013) avoided this problem by using self-ratings and ratings by two informants as independent methods and found no evidence that self-ratings are more valid than informant ratings; a finding that is mirrored in ratings of personality traits (Anusic et al., 2009). Thus, a correlation of r = .3, implies that 30% of the variance in self-ratings is valid and 30% of the variance in informant ratings is valid.

While this evidence shows that self-ratings of life-satisfaction show convergent validity with informant ratings, it also shows that a substantial portion of the reliable variance in self-ratings is not shared with informants. Moreover, it is not clear what information produces agreement between self-ratings and informant ratings. This question has received surprisingly little attention, although it is critical for the construct validity of life-satisfaction judgments. Two articles have examined this question with opposite conclusions. Schneider and Schimmack (2010) found some evidence that satisfaction in important life domains contributed to self-informant agreement. This finding would support the bottom-up model of well-being judgments that raters are actually considering life circumstances when they make well-being judgments. In contrast, Dobewall, Realo, Allik, Esko, andMetspalu (2013) proposed that personality traits like depression and cheerfulness accounted for self-informant agreement. In this case, informants do not need ot know anything about life circumstances. All they need to know is whether an individual has a positive or negative lens to evaluate their lives. If informants are not using information about life circumstances, they cannot be used to validate self-ratings to show that self-ratings are based on evaluations of life circumstances.

Diener et al. (2018) cite a number of additional findings as evidence of convergent validity.

Physiological measures, including brain activity (Davidson, 2004) and hormones (Buchanan, al’Absi, & Lovallo, 1999), along with behavioral measures such as the amount of smiling (e.g., Oettingen & Seligman, 1990; Seder & Oishi, 2012) and patterns of online behaviors (Schwartz, Eichstaedt, Kern, Dziurzynski, Agrawal et al., 2013) have also been used to assess SWB. (p. 7).

This evidence has several limitations. First, hormones do not reflect evaluations and are at best indirectly related to life-evaluations. Asymmetries in prefrontal brain activity (Davidson, 2004) have been shown to reflect approach and avoidance motivation more than pleasure and displeasure, and brain activity is a better measure of momentary states than the evaluation of fairly stable life circumstances. Finally, they also may reflect individuals’ personality more than their life circumstances. The same is true for the behavioral measures. Most important, correlations with a single indicators do not provide information about the amount of valid variance in life-satisfaction judgments. To quantify validity it is necessary to examine these findings within a causal network (Schimmack, 2019).

Diener et al. (2019) agree with my assessment in their final conclusions about measurement of subjective well-being.

The first (and perhaps least controversial) is that many open questions remain
regarding the associations among different SWB measures and the extent to which these measures map on to theoretical expectations; therefore, understanding how the measures relate and how they diverge will continue to be one of the most important goals of research in the area of SWB. Although different camps have emerged that advocate for one set of measures over others, we believe that such advocacy is premature. More research is needed about the strengths, weaknesses, and relative merits of the various approaches to measurement that we have documented in this review
(p. 7).

The problem is that well-being scientists have made no progress on this front since Andrews and Withey (1976) conducted the first thorough construct validation studies. The reason is that social and personality psychology suffers from a validation crisis (Schimmack, 2019). Researchers simply assume that measures are valid rather than testing it or they use necessary, but insufficient criteria like internal consistency (alpha), retest reliability as evidence. Moreover, there is a tendency to ignore inconvenient findings. As a result, 40 years after Andrews and Withey’s (1976) seminal article was published, it remains unclear (a) whether respondents aggregate information about important life domains to make global judgments, (b) how much of the variance in life-satisfaction judgments is valid, and (c) which factors produce systematic biases in life-satisfaction judgments that may lead to false conclusions about the causes of life-satisfaction and to false policy recommendations.

Health is probably the best example to illustrate the importance of valid measurement of subjective well-being. It makes intuitive sense that health has an influence on well-being. Illness often disables individuals from pursuing their goals and enjoying life as everybody who had the flu knows. Diener et al. (2018) agree.

“One life circumstance that might play a prominent role in subjective well-being is a person’s health” (p. 15).

It is also difficult to see how there could be dramatic individual differences in the criteria that are used to evaluate health. Sure, fitness levels may be a matter of personal preference, but nobody is enjoying a stroke, heart attack, or cancer, or even having the flu.

Thus, it was a surprising finding that health seemed to have a small influence on global well-being judgments.

“Initial research on the topic of health conditions often concluded that health played only a minor role in wellbeing judgments (Diener et al., 1999; Okun, Stock, Haring,
& Witter, 1984).”

More problematic was the finding that subjective evaluations of health seemed to play no role in these judgments in multivariate analyses that controlled for shared variance among ratings of several life domains. For example, in Andrews and Withey’s (1976) studies satisfaction with health contributed only 1% unique variance in the global measure.

In contrast, direct importance ratings show that health is rated as the second most important domain (Rohrer & Schmukle, 2018).

Thus, we have to conclude that health doesn’t seem to matter for people’s subjective well-being. Or we can conclude that global measures are (partially) invalid measures because respondents do not weigh life domains in accordance with their importance. This question clearly has policy relevance as health care costs are a large part of wealthy nations’ GDP and financing health care is a controversial political issue, especially in the United States. Why would this be the case, if health is actually not important for well-being. We could argue that it is important for life expectancy (Veenhoven’s happy life-years) or that it matters for objective well-being, but not for subjective well-being, but clearly the question why health satisfaction plays a small role in global measures of subjective well-being is an important one. The problem is that 40 years of well-being science have passed without addressing this important question. But as they say, better late than never. So, let’s get on with it and figure out how responses to global well-being questions are made and whether these cognitive processes are in line with the theoretical model of subjective well-being.