Post-war American Psychology is rooted in behaviorism. The key assumption of behaviorism is that psychology (i.e., the science of the mind) should only study phenomena that are directly observable. As a result, the science of the mind became the science of behavior. While behaviorism is long dead (see the 1990 funeral here), it’s (harmful) effect on psychology is still noticeable today. One lasting effect is psychologists aversion to make causal attributions to the mind (cognitive processes). While cognitive processes cannot be directly observed with the human senses (we cannot see, touch, smell, or hear what goes on in somebody’s mind), we can indirectly observe these processes on the basis of observable behaviors. A whole different discipline that is called psychometrics has developed elaborate theories and statistical models to relate observed behaviors to unobserved processes in the mind. Unfortunately, psychometrics is often not covered in the education of psychologists. As a result, psychologists often make simple mistakes when they apply psychometric tools to psychological questions.

In the language of psychometrics, observed behaviors are observed variables and unobserved mental processes are unobserved variables that are also often called latent (i.e., of a quality or state) existing but not yet developed or manifest; hidden or concealed) variables. The goal of psychometrics is to find systematic relationships between observed and latent variables that make it possible to study mental processes. We can compare this process to the task of early astronomers to make sense of the lights in the night sky. Bright stars are like observable indicators and the task of astronomers is to explain the behavior of these observable variables with unobserved forces. Astronomy has come a long way from seeing astrological signs in the sky, but psychology is pretty much at this early stage of science, where most of the unknown cognitive processes that cause observable behaviors are unknown. In fact, some psychologists still resist the idea that observable behavior can be explained by latent variables (Borsboom et al., 2021). Others, however, have used psychometric tools, but fail to understand the basic properties of psychometric models (e.g., Digman, 1997; DeYoung & Peterson, 2002; Musek, 2007). Here, I give a simple introduction to the basic logic of psychometric models and illustrate how applied psychologists can get lost in latent variable space.

Figure 2 shows the most basic psychometric model that relates an observed variable to an unobserved cause. I am using a widely used measure of life-satisfaction as an example. Please rate your life on a scale from 0 = worst possible life to 10 = best possible life. Thousands of studies with millions of respondents have used this question to study “the secret of happiness.” Behaviorists would treat this item as a stimulus and participants responses on the 11-point rating scales as behaviors. One problem for behaviorists is that participants will respond differently to the same question. Responses vary from 0 (very rarely) all the way to 10 (more often, but still rare). The modal response in affluent Western countries is 7. Behaviorism has no answer to the question why participants respond differently to the same situation (i.e., question). Some researchers have tried to provide a behavioristic answers by demonstrating that responses can be manipulated (e.g., responses are different in a good or bad mood; Schwarz & Strack, 1999; Kahneman, 2011). However, these effects are small and do not explain why responses are highly stable over time and across different situations (Schimmack & Oishi, 2005). To explain why some people report higher levels of life-satisfaction than others, we have to invoke unobserved causes within respondents’ minds. Just like forces that creates the universe, these causes are not directly observable, but we know they must exist because we observe variation in responses that cannot be explained by variation in the situation (i.e., same situation and different behaviors imply internal causes).
Psychologists have tried to understand the mental processes that produce variation in Cantril ladder scores for nearly 100 years (Andrews & Whitey, 1976; Cantril, 1965; Diener, 1984; Hartmann, 1936). In the 1980s, focus shifted from thoughts about one’s life (e.g., I hate my work, I love my spouse, etc.) to the influence of personality traits (Costa & McCrae, 1980). Just like life-satisfaction, personality is a latent variable that can only be measured indirectly by observing differences in behaviors in the same situation. The most widely used observed variables to do so are self-ratings of personality.

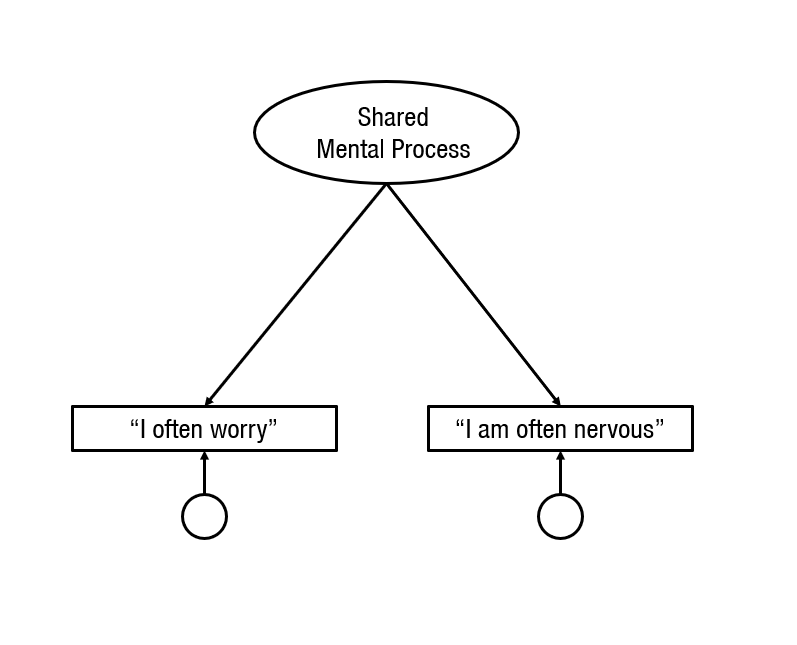
The key problem for the measurement of unobserved mental processes is that variation in observed scores can be caused by many different mental processes. To go beyond the level of observed variation in behaviors, it is necessary to separate the different causes that contribute to the variance in observed scores. The first step is to separate causes that produce measurement error. The most widely used approach to do so is to ask the same or similar questions repeatedly and to consider variability in responses as measurement error. The next figure shows a model for responses to two similar items.

When two or more observed variables are available, it is possible to examine the correlation between two variables. if two observed variables share a common cause, they are going to be correlated. The strength of the correlation depends on the relative strength of the shared mental process and the unique mental processes. Psychometrics works in reverse and makes inferences about the unobserved causes by examining the observed correlations. To do so, it is necessary to make some assumptions, and this is where things can go wrong, when researchers do not understand these assumptions.
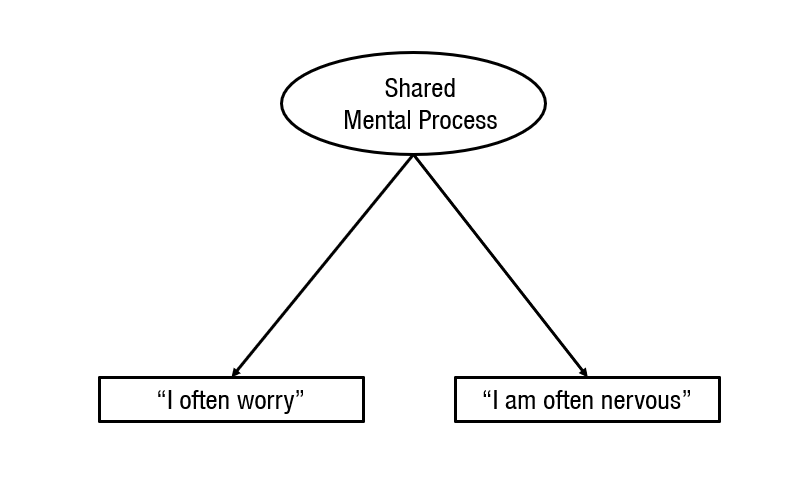
A common assumption is that the shared causal processes are important and meaningful, whereas the unique mental processes are unimportant, irrelevant, and error variance. Based on this assumption, the model is often drawn differently. Sometimes, the shared unobserved variable is drawn on top, and the unshared unobserved variables are drawn at the bottom (top = important, bottom = unimportant).

Sometimes, the unique mental processes are drawn smaller and without a name.
And sometimes, they are simply omitted because they are considered unimportant and irrelevant.
The omission of the unshared causes makes sense when psychometricians communicate with each other because they are trained in understanding psychometric models and use figures merely as a short-hand to communicate with each other. However, when psychometricians communicate with psychologists things can go horribly wrong because psychologists may not realize that the omission of residuals is based on assumptions that can be right or wrong. They may simply assume that the unique variances are never important and can always be omitted. However, this is a big mistake with undesirable consequences. To demonstrate this, I am always going to show the unique causes of all variables in the following models.
When psychologists ask similar questions repeatedly, they are assuming that the unique causes of the responses are measurement error. In the present example, individuals may interpret the words “worry” and “nervous” somewhat differently and this may elicit different mental processes that result in slightly different responses. However, the two terms are sufficiently similar that they also elicit similar cognitive processes that produce a correlation between responses to the two items. Under this assumption, the common causes reflect the causes that are of interest and the unique causes produce error variance. Under the assumption that unique causes produce error variance, it is possible to average responses to similar items. These averages are called scales. Averaging amplifies the variance that is produced by shared causes.

This is illustrated in the next figure where the average is fully determined by the two observed variables “I often worry” and “I am often nervous.” To make this a measurement model, we have to relate the average scores to the unobserved variables. Now we see that the shared mental process variable has two ways to influence the average scores, whereas each of the unique causes has only one way to contribute to the average. As the number of variables increases the ratio (2:1) becomes even bigger for the shared variable (3 variables, 3:1). This implies that the shared mental processes more and more determine the average scores. This is the only part of measurement theory that psychologists are taught and understand as reflected in the common practice to report Cronbach’s alpha (a measure of the shared variance in the average scored) as evidence that a measure is a good measure (Flake & Fried, 2020). However, the real measurement problems are not addressed by averaging across similarly-worded items. This is revealed in the next figure.
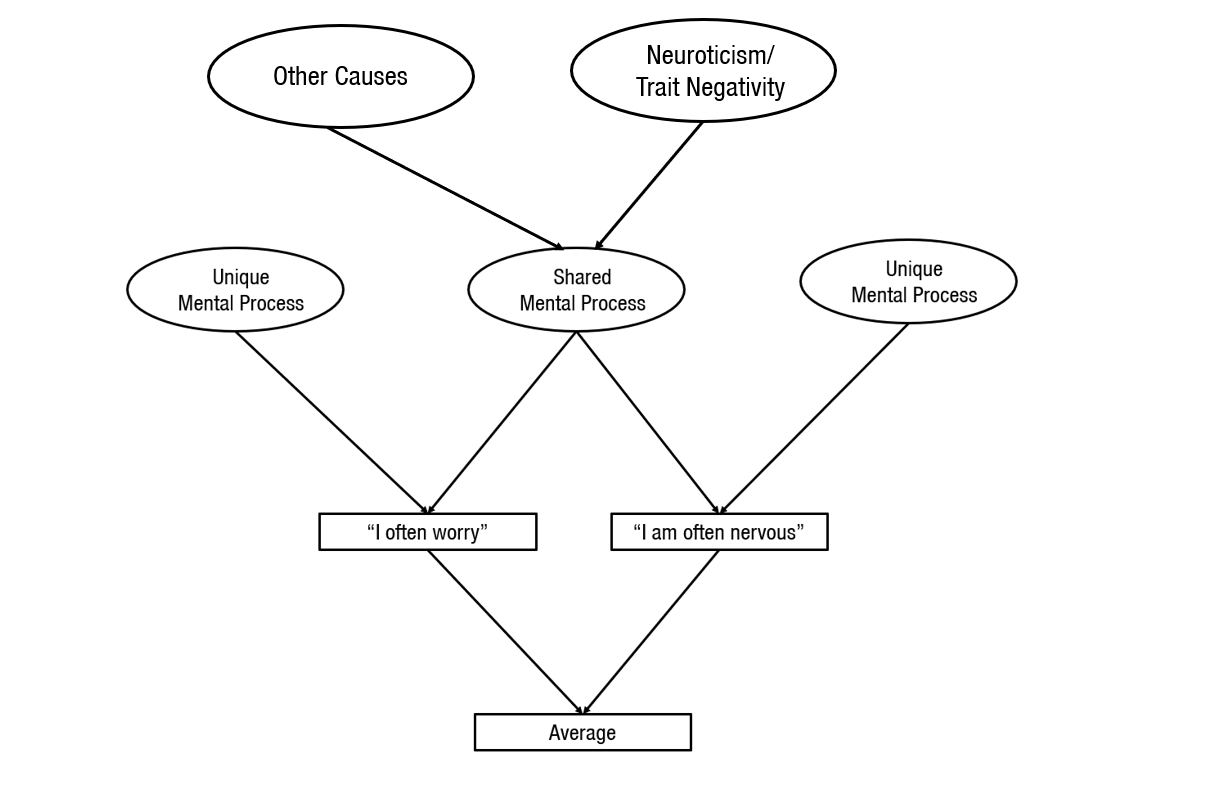
To use the average of responses to similarly worded items as an observed measure of an unobserved personality trait, we have to assume that the shared mental processes that produce most of the variance in the average scores are caused by the personality trait that we are trying to measure. In the present example, personality psychologists use items like “worry” and “nervous” to measure a trait called Neuroticism. Despite 100 years of research, it is still not clear what Neuroticism is and some psychologists still doubt that Neuroticism even exists. Those who do believe in Neuroticism assume it reflects a general disposition to have more negative thoughts (e.g., low self-esteem, pessimism) and feelings (anxiety, anger, sadness, guilt). The main problem in current personality research is that item-averages are often treated as if they are perfect observed indicators of an unobserved personality trait (see next figure).

Ample research suggests that average scores of neuroticism items are also influenced by other factors such as socially desirable responding. Thus, it is a simplification to assume that item-averages are identical or isomorphous to the personality trait that they are designed to measure. Nevertheless, it is common for personality psychologists to study the influence of unobserved causes like Neuroticism by means of item averages. As we see later, even when psychologists use latent variable models, Neuroticism is just a label for an item-average. The problem with this practice is that it gives the illusion that we can study the causal effects of unobservable personality traits by examining the correlations of observable item-averages.
In this way, measurement problems are treated as unimportant, just like behaviorists considered mental processes as unimportant and relegated them to a black box that should not be examined. The same attitude prevails today with regards to personality measurement, when boxes (observed variables) are given names without checking that the labels actually match the content of the box (i.e., the unobserved causes that a measure is supposed to reflect). Often psychological constructs are merely labels for item-averages. Accordingly, neuroticism is ‘operationalized’ with an item-average and neuroticism can be defined as “whatever a neuroticism scale measures.”

When Things Go from Bad to Worse
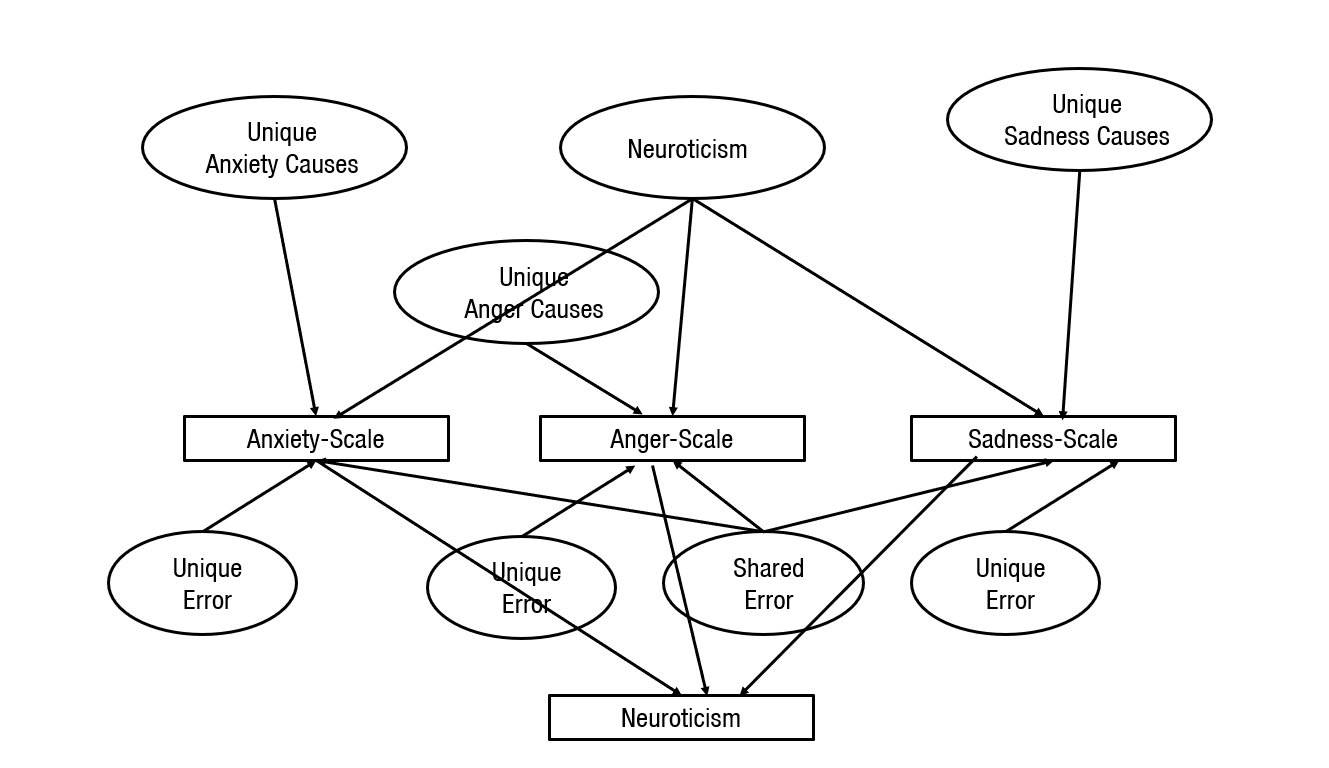
In the 1980s, personality psychologists came to a broad consensus that the diversity of human traits (e.g., anxious, bold, curious, determined, energetic, frank, gentle, helpful, etc.) can be organized into a taxonomy with five broad traits, known as the Big Five. The basic idea is illustrate in the next Figure with Neuroticism. According to Big Five theory, Neuroticism is a general disposition to experience more anxiety, anger, and sadness. However, each emotion also has its one dispositions. Thus, variation in scales that measure anxiety, anger, and sadness is influenced by both Neuroticism (i.e., the general disposition) and specific causes. In addition, scales can also be influenced by general and specific measurement errors. The figure makes it clear that the scores in the item-averages can reflect many different causes aside from the intended broader personality trait called Neuroticism. This makes it risky to rely on these item averages to draw inferences about the unobserved variable Neuroticism.
A true science of personality would try to separate these different causes and to examine how they relate to other variables. However, personality psychologists often hide the complexity of personality measurement by treating personality scales as if they directly reflect a single cause). While this is bad enough, things get even worse when personality psychologists speculate about even broader personality traits.
The General Personality Factor (Musek, 2007)
The Big Five were considered to be roughly independent from each other. In fact, they were found with a method that looked for independent factors (another name for unobserved variables) more commonly used in personality research. However, when Digman (1997) examined correlations among item-averages, he found some systematic patterns in these correlations. This led him to postulate even broader factors than the Big Five that might explain these patterns. The problem with these theories is that they are no longer trying to relate observed variables to unobserved variables. Rather, Digman started to speculate about causal relationships among unobserved variables on the basis of imperfect indicators of the Big Five.
The first problem with Digman’s attempt to explain correlations among unobserved variables was that he lacked expertise in the use of psychometric models. As a result, he made some mistakes and his results could not be replicated (Anusic et al., 2009). A few years later, a study that controlled for some of the measurement problems by using self-ratings and informant ratings suggested that the Big Five are more or less independent and that correlations reflect measurement error (Biesanz & West, 2004; see also Anusic et al., 2009). However, other studies suggested that higher-order factors exists and may have powerful effects on people’s lives, including their well-being. Subsequently, I am going to show that these claims are based on a simple misunderstanding of measurement models that treat unique variance in the Big Five scales as error variance.
Musek (2007) proposed that correlations among Big Five scales can be explained with a single higher-order factor. This model is illustrated in his Figure 1.

First, it is notable that the unique mental processes that contribute to each of the Big Five scales are called e1 to e5 and the legend of the figure explains that e stands for error variances. This terminology can be justified if we treat Big Five scales only as observed variables that help us to observe the unobserved variable GFP. As GFP is not directly observable, we have to infer its presence from the correlations among the observed variables, namely the Big Five scales. However, labeling the unique causes that produce variation in Neuroticism scores error variance is dangerous because we may think that the unique variance in Neuroticism is no longer important; just error. Of course, this variance is not error variance in some absolute sense. After all, Neuroticism scales exists only because personality psychologists assume that Neuroticism is a real personality trait that is related to even more specific traits like anxiety, anger, and sadness. Thus, all of the variance in a neuroticism scale is assumed to be important and it would be wrong to assume that only the variance shared with other Big Five scales is important. To avoid this misinterpretation, it would be better to keep the unique causes in the model.
Another problem of this model is that the model itself provides no information about the actual causes of the correlations among the Big Five scales. This is different when items are written for the explicit purpose of measuring something that they have in common. In contrast, the correlations among the Big Five traits are an empirical phenomenon that requires further investigation to understand the nature of the causal processes that produce correlations. In other words, GFP is just a name for “shared cognitive processes;” it does not tell us what these shared cognitive processes are. To examine this question, it is necessary to see how the GFP is related to other things. This is where things go horribly wrong. Rather than relating the unobserved variable in Figure 1 to other measures, Musek (2007) averages all Big Five items to create an item average that is supposed to represent the unobserved variable. He then uses correlations of the GFP scale to make inferences about the GFP factor. The problems of this approach are illustrated with the next figure.

The figure illustrates that the general personality scale is not a good indicator of the general personality factor. The main problem is that the scale scores are also influenced by the unique causes that contribute to variation in the Big Five scales (on top of measurement error that is not shown in the picture to avoid clutter, but should not be forgotten). The problem is hidden when the unique causes are represented as errors, but unique variance in neuroticism is not error variance. It reflects a disposition to have more negative thoughts and this disposition could have a negative influence on life-satisfaction. This contribution of unique causes is hidden when Big Fife scale scores are averaged and labeled General Personality.
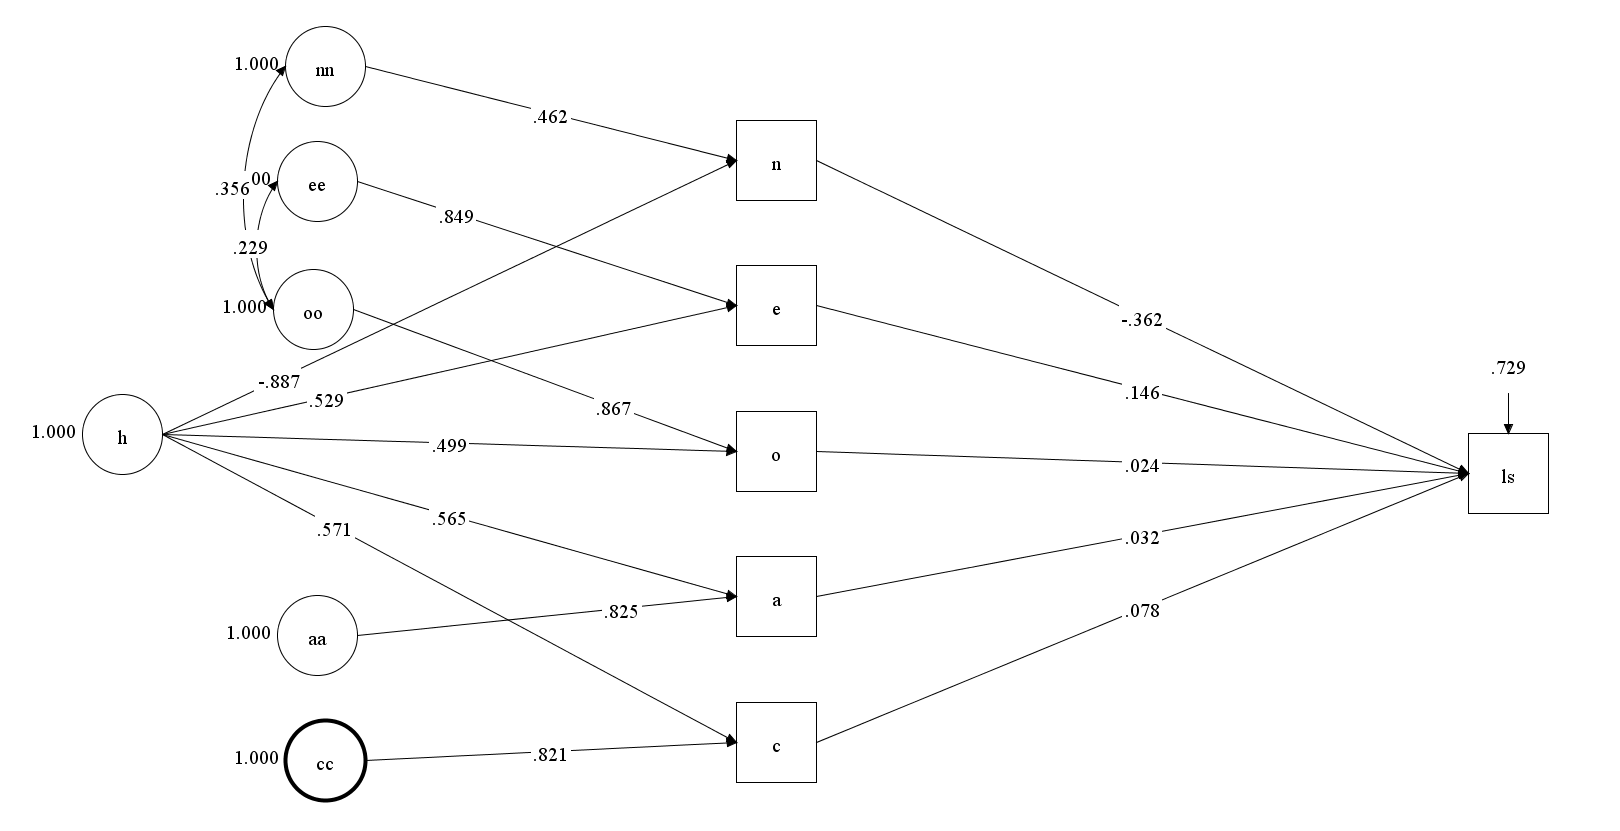
Musek (2007) reports a correlation of r = .5 (Study 1) between the general personality scale and a life-satisfaction scale. Musek claims that this high correlation must reveal a true relationship between the general factor of personality and life-satisfaction and cannot reflect a method artifact like social desirable responding. It is unclear why Musek (2007) relied on an average of Big Five scale scores to examine the relationship of the general factor with life-satisfaction. Latent variable modeling makes it possible to examine the relationship of the general factor directly without the need for scale scores. Fortunately, it is possible to conduct this analysis post-hoc based on the reported correlations in Table 1.

The first model created a general personality scale and used the scale as a predictor of life-satisfaction. The only difference to a simple correlation is that the model also includes the implied measurement model. This makes the model testable because it imposes restrictions on the correlations of the Big Five scales with the life-satisfaction scale. The fit of the model was acceptable, but not great, suggesting that alternative models might produce even better fit, RMSEA = .078, CFI = .958.

In this model, it is possible to trace the paths from the unobserved variables to life-satisfaction. The strongest relationship was the path from the general personality factor (h) to life-satisfaction, b = .42, se = .04, but the model also implied that unique variances of the Big Five scales contribute to life-satisfaction. These effects are hidden when the general personality scale is interpreted as if it is a pure measure of the general personality factor.
A direct test of the assumption that the general factor is the only predictor of life-satisfaction requires a simple modification of the model that links life-satisfaction directly to the general factor (h). This model actually fits the data better, RMSEA = .048, CFI = .984. This might suggest that the unique causes of variation in the Big Five are unrelated to life-satisfaction.

However, good fit is not sufficient to accept a model. It is also important to rule out plausible alternative models. An alternative model assumes that the Big Five factors are necessary and sufficient to explain variation in life-satisfaction. There is no reason to create a general scale and use it as a predictor. Instead, life-satisfaction can simply be regressed onto the Big Five scales as indicator of the Big Five factors. In fact, it is always possible to get good fit for a model that uses indicators as predictors of outcomes because the model does not impose any restrictions (i.e., the model is just identified). The only reason why this model fits worse than the other model is that fit indices like RMSEA and CFI reward parsimony and this model uses 5 predictors of life-satisfaction whereas the previous model had only one predictor. However, parsimony cannot be used to falsify a model.
In fact, it is possible to find an even better fitting model because only two of the five Big Five scales were significant predictors of life-satisfaction. This finding is consistent with many previous studies that these two Big Five traits are the strongest predictors of life-satisfaction. If the model is limited to these two predictors, it fits the data better than the model with a direct path from the general factor, CFI = .987, RMSEA = .045. Musek (2007) was unable to realize that the unique variances in neuroticism and extraversion make a unique contribution to life-satisfaction because the general personality scale does not separate shared and unique causes of variation in the Big Five scales.
The Correlated Big Two
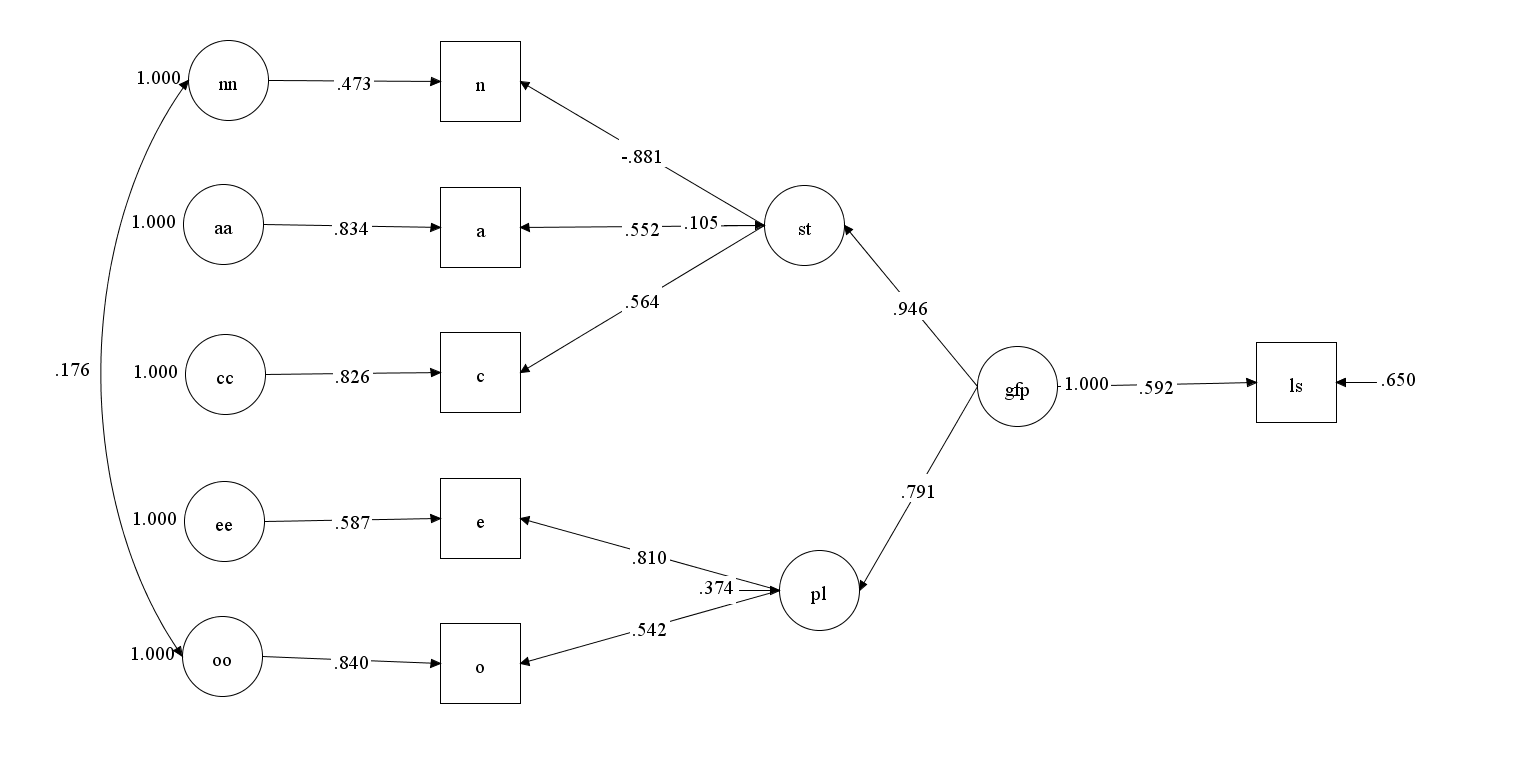
In contrast to Musek (2007), DeYoung and Peterson favor a model with two correlated higher-order factors (DeYoung, Peterson, & Higgins, 2002; see Schimmack, 2022, for a detailed discussion).

As Musek (2007) they treat the unique causes of variation in Big Five traits as error (e1-e5) and assume that relationships of the higher-order factors with criterion variables are direct rather than being mediated by the Big Five factors. Here, I fitted this model to Musek’s (2007) data. Fit was excellent, CFI = .996, RMSEA = .030.

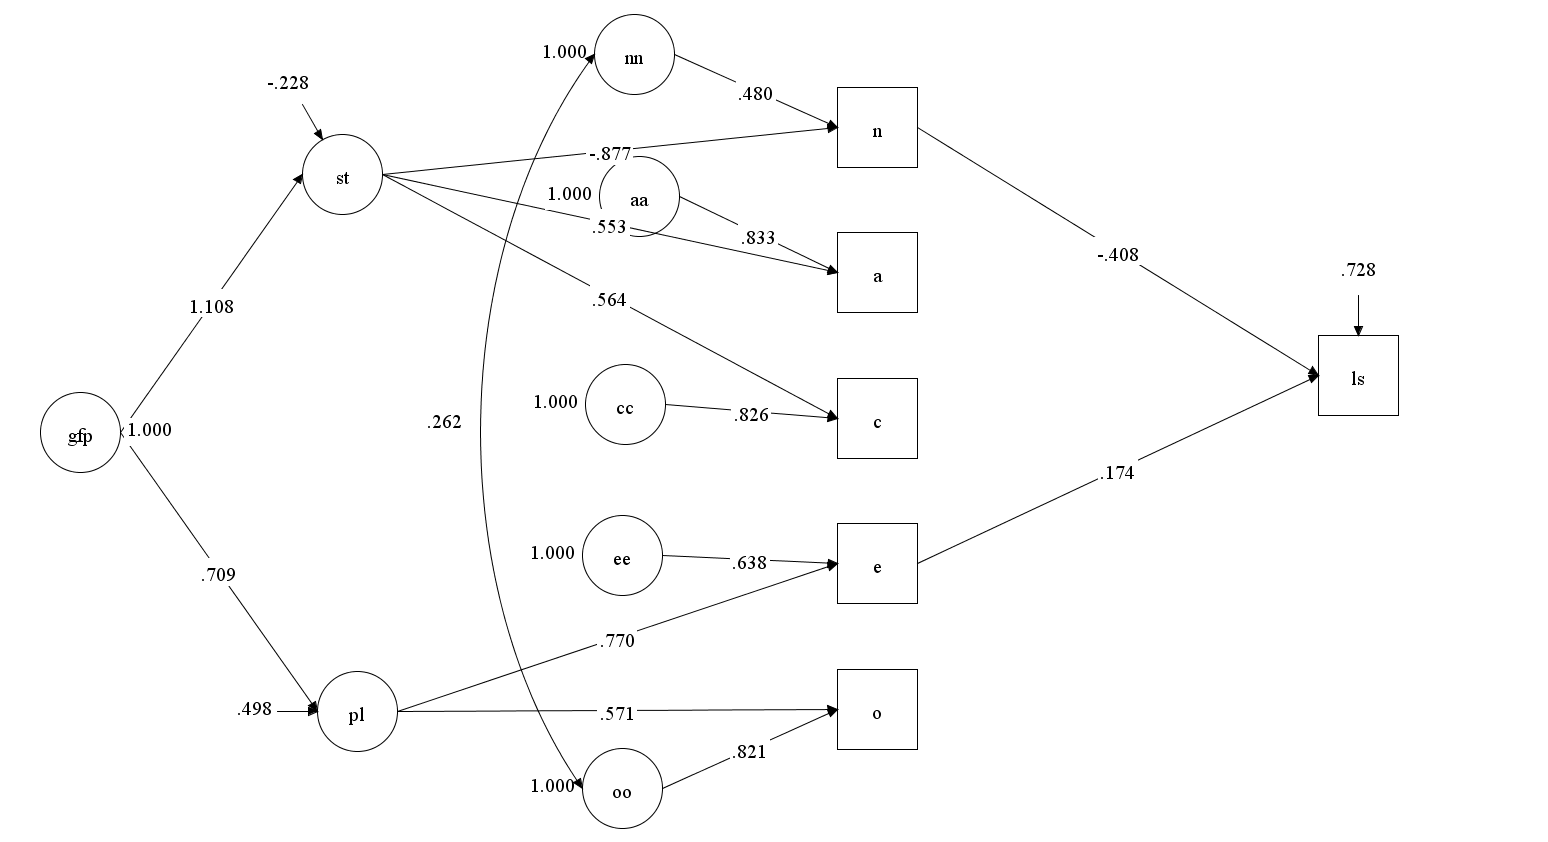
Based on this model, life-satisfaction would be mostly predicted by stability rather than neuroticism and extraversion or a general factor. However, just because this model has excellent fit doesn’t mean it is the best model. The model simply masks the presence of a general factor by modeling the shared variance between Plasticity and Stability as a correlated residual. It is also possible to model it with a general factor. In this model, Stability and Plasticity would be an additional level in a hierarchy between the Big Five and the General Factor. This model does not impose any additional restrictions and fits the data as well as the previous model, CFI = .996, RMSEA = .030. Thus, even though Stability and Plasticity can be identified, it does not mean that this distinction is important for the prediction of life-satisfaction. The general factor could still be the key predictor of life-satisfaction.
However, both models make the assumption that the unique causes of variation in Big Five scales are unrelated to life-satisfaction, and we already saw that this assumption is false. As a result, the model that relates life-satisfaction to neuroticism and extraversion fits the data, CFI = .994, RMSEA = .035, and the paths from extraversion and neuroticism to life-satisfaction were significant.
Musek (2007) and DeYoung et al. (2006) ignored the possibility that unique causes of variation in the Big Five contribute to the prediction of other variables because they made the mistake to equate unique variances with error variances. This interpretation is based on the basic examples that are used to illustrate latent variable models for beginners. However, the interpretation of all aspects of a latent variable model, including the residual or unique variances has to be guided by theory. To avoid these mistakes, psychometricians need to stop presenting their models as if they can be used without substantive theory and substantive researchers need to get better training in the use of psychometric tools.
Conclusion
Compared to other sciences like physics, astronomy, chemistry, or biology, psychology has made little progress over the past 40 years. While there are many reasons for this lack of progress, one problem is the legacy of behaviorism to focus on observable behaviors and to rely on experimentation as the only scientific approach to test causal theories. Another problem is an ideological bias against personality as a causal force that produces variation between individuals (Mischel, 1968). To make progress, personality science has to adopt a new scientific approach that uses observed behaviors to test causal theories of unobservable forces like personality. While personality scales can be used to predict behaviors and life-outcomes, they cannot explain behaviors and life-outcomes. Latent variable modeling provides a powerful tool to test causal theories. The biggest advantage of latent variable modeling is that model fit can be used to reject models. A cynic might think that this is the main reason why they are ot used more by psychologists because it is more fun to build a theory and confirm it rather than to find out that it was false, but fun doesn’t equal scientific progress.
P.S. What about Network Models?
Of course, it is also possible to reject the idea of unobserved variables altogether and draw pictures of the correlations (or partial correlations) among all the observed variables. The advantage of this approach is that it always produces results that can be used to tell an interesting story about the data. The disadvantage is that it always produces a result and therefore doesn’t test any theory. Thus, these models cannot be used to advance personality psychology towards a science that progresses by testing and rejecting false theories.
