In 1997, Digman (1997) published an article that aimed to explain correlations among self-rating scales of the Big Five personality traits in terms of two orthogonal higher-order factors. One factor related Extraversion and Openness and the other factor related Emotional Stability (the opposite of Neuroticism), Agreeableness, and Conscientiousness.
This model has had relatively little influence on personality psychology, except for work by Colin DeYoung. The first article on the higher-order factors was published when he was a graduate student with his supervisor Jordan B. Peterson (DeYoung, Peterson, & Higgins, 2002).
In this article, the authors relabel Digman’s factors as stability (Emotional Stability, Agreeableness, & Conscientiousness) and Plasticity (Extraversion & Openness). They suggested that Stability is related to serotonin and Plasticity is related to dopamine.
“We present a biologically predicated model of these two personality factors,relating them to serotonergic and dopaminergic function,an d we label them Stability (Emotional Stability, Agreeableness, and Conscientiousness) and Plasticity (Extraversion and Openness)” (p. 533).
The article, however, does not test relationships between biological markers of these neurotransmitter systems and variation in personality. In this regard, the article merely introduces a hypothesis, but does not provide empirical support for or against it. The only empirical evidence in support of the hypothesis would be that Big Five factors are actually related to each other in the way Digman proposed. Evidence to the contrary would falsify a biological model that predicts these relationships.
The main empirical prediction of the model is that Stability and Plasticity predict variation in self-ratings of conformity.
“Based on this model,we hypothesize that Stability will positively predict conformity (as indicated by socially desirable responding) and that Plasticity will negatively predict
conformity” (p. 533)
The authors claim to have found support for this prediction.
“A structural equation model indicates that conformity is indeed positively related to Stability
(university sample: b =0.98; community sample: b =0.69; P<0.01 for both) and negatively related to Plasticity (university sample: b= -0.48, P<0.07; community sample: b= -0.42, P<0.05).”
Readers familiar with structural equation modeling may be surprised by the strong relationship between Stability and Conformity, especially in the student sample. A standardized parameter of .98 implies that these constructs are nearly perfectly correlated. Relationships of this magnitude are usually not a cause of celebration. They either imply a lack of discriminant validity (i.e., two measures are actually measuring the same construct) or model misspecification.
To understand what is going on in this study, it is helpful to inspect the actual pattern in the data. Fortunately, it was a common practice in personality psychology to share this information in the form of the raw correlation matrices even before open science became the norm in other fields of psychology. We can therefore inspect the published correlation matrix.
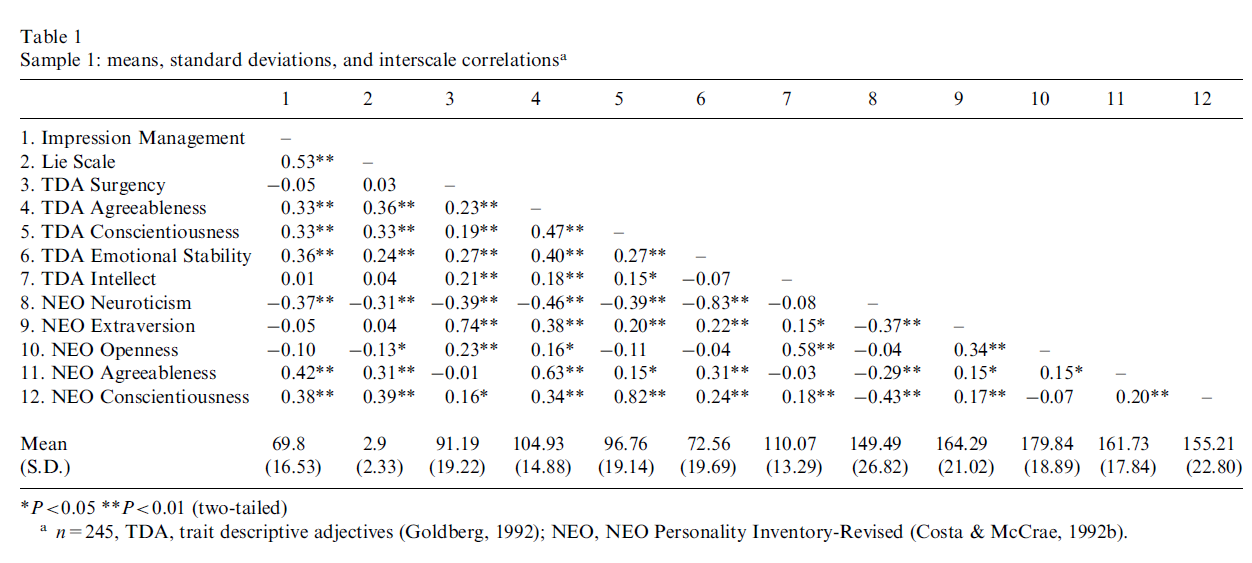
First, the two conformity measures (1. Impression Management, 2. Lie Scale) show a moderate correlation, r .53, indicating that they measure a common construct.
Second, both conformity measures show sizeable correlations with the Stability traits Emotional Stability/Neuroticism, r1 = -.37, .36, r2 = .24, -.31, Agreeableness, r1 = .33, .42, r2 = .36, .31, and Conscientiousness, r1 = .33, .38, r2 = .33, .39. In contrast, conformity measures are unrelated to the Plasticity traits, Extraversion/Surgency, r1 = -.05, -.05, r2 = .03, .04 and Openness/Intellect r1 = .01, -.10, .04, -.13. The latter finding raises concerns about the negative relationship between the Plasticity factor and Conformity factor in DeYoung and Peterson’s model and by extension their theory that predicted this negative relationship.
Third, we can examine the correlations among the Big Five measures. According to Digman’s model, Stability and Plasticity are expected to be independent. Accordingly cross-meta-factor correlations (e.g., Extraversion & Agreeableness or Emotional Stability & Openness) should be close to zero. Inspection of Table 1 shows that this is not the case. For example, TDA Surgency correlates r = .23 with TDA Agreeableness, r = .19 with TDA Conscientiousness, r = .16 with NEO Conscientiousness, and r = -.39 with NEO Neuroticism. These correlations need to be modeled to have a good fitting model.
Fourth, we can examine whether the pattern of correlations confirms the key prediction of Digman’s model. Namely Stability traits should be more strongly correlated with each other than with Plasticity traits and vice versa. The comparison of these correlations follows Campbell and Fiske’s (1959) approach to examine convergent and discriminant validity. It is easy to see that the pattern of correlations does not fully support the predicted structure. For example, the Plasticity correlations of TDA Surgency with TDA Intellect, r = .21 and NEO Openness, r = .23 are weaker than the correlation with TDA Emotional Stability, r = .27, and NEO Neuroticism, r = -.39. Results like these raise concerns that the published model misrepresents the actual pattern in the data.
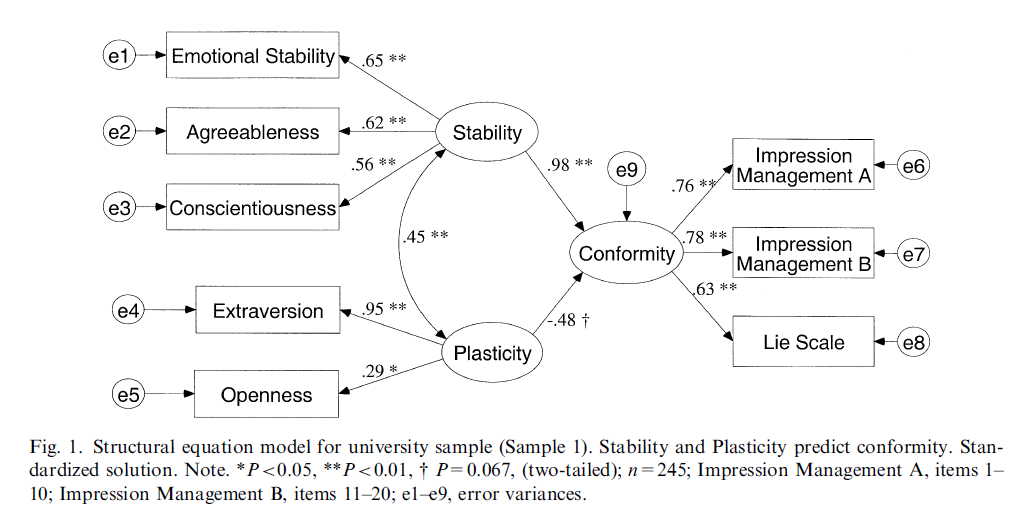
The published model is shown in Figure 2. As noted before, the high relationship between the Stability factor and the Conformity factor is a concern. A similar concern arises from the high loading of Extraversion on the Plasticity factor, b = .95. Accordingly, Plasticity is nearly identical with Extraversion.
It is well known that even well-fitting models do not proof that the proposed model generated the observed pattern of correlations. It is good practice to compare preferred models to plausible alternative models. Model comparison can be used to weed out bad models, but the winner may still not be the right model. That is, we can falsify false models, but we cannot verify the right model.
I first fitted a measurement model to the correlations among the Big Five indicators in Table 1. It is noteworthy that the authors were unable to fit a model to the data in Table 1.
“While it would have been an attractive possibility to use the two measures of each Big Five trait for Sample 1 in order to create a hierarchical factor model,with latent variables for Stability and Plasticity derived from latent variables for each of the Big Five, the many intercorrelations
among the 10 Big Five scales rendered such a model impractical” (p. 542).
There justification makes no sense to anybody who is familiar with structural equation modeling and there are published models with 2, 3, or 4 indicators to create a measurement model of the Big Five factors (Anusic et al., 2009). To achieve satisfactory fit, it is necessary to allow for some secondary loadings and correlated residuals. These parameters reflect the fact that Big Five scales are impure indicators of the Big Five factors that are contaminated with specific item content. Purists may object to the exploratory approach, but they would have to terminate modeling because a simple structure model does not have satisfactory fit. Thus, the only way to proceed and to test the model is to modify the model to have adequate fit and to conduct further tests with better data in the future.
Modification of the measurement model was terminated when no major modification indices were present, chi2 < 10. Final model fit was acceptable, CFI = .989, RMSEA = .055.
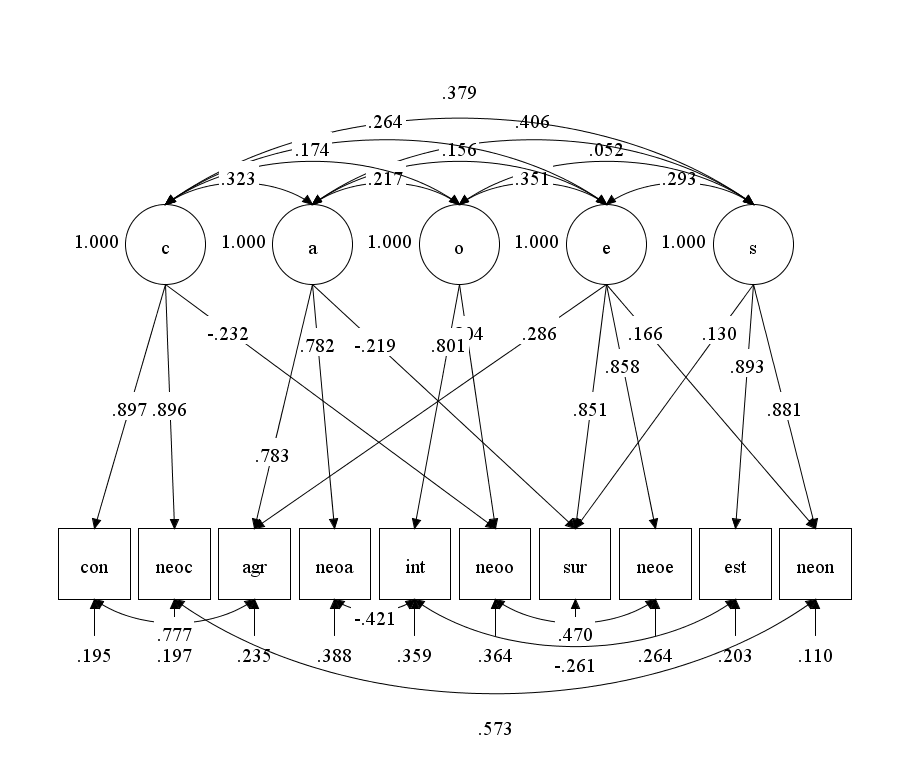
All primary loadings were high, b > .7. All secondary loadings were below .3. Notable correlated residuals were present for TDA conscientiousness (con) and TDA agreeableness (agr) and NEO conscientiousness (neoc) and Neo Neuroticism (neon). Neuroticism was reverse scored so that higher scores reflect Emotional Stability.
The correlations among the Big Five factors show generally positive correlations, which is a typical finding. There is some evidence for convergent and discriminant validity of the meta-traits. The highest correlations are for Agreeableness and Emotional Stability, r = .406 (Stability), Conscientiousness and Emotional Stability r = .379 (Stability), and Openness and Extraversion, r = .351 (Plasticity), and Agreeableness and Conscientiousness, r = .323 (Stability).
However, a model that tried to model the Big Five correlations with two independent meta-traits reduced model fit, CFI = .972, RMSEA = .074. As can be seen in Figure 1, DeYoung and Peterson solved this problem by letting the Stability and Plasticity factor correlate without providing a theoretical explanation for this correlation. Adding this correlation to the model improved model fit.
It is now possible to add conformity to the model to reproduce the published results. Model fit remained acceptable, but the standardized effect of Stability on Conformity exceeded 1, b = 1.30. This problem could be solved by relaxing the equality constraint for the loadings of Extraversion and Openness on Plasticity, which was needed in the model without a criterion. However, even this model had the problem that the residual variance in conformity was negative. The reason is hat the model is misspecified.
The key problem with this model is the ad-hoc, atheoretical correlation between the two higher order factors. With the help of hindsight, we know from multi-trait multi-method studies that correlations among all Big Five traits are an artifact of response styles (Biesanz & West, 2004). One of these studies was even published by DeYoung (2006), so there should be no disagreement with him. Anusic et al. (2009) showed that we do not need multi-method data to control for these rating biases. Instead a method-factor can e added to the model. I have improved on Anusic et al.’s approach and started to model this method factor as a factor that has a direct influence on indicators. As a result, Big Five factors are independent of method variance. In this model, stability and plasticity are independent if they are identified.
Figure 2 shows the results.
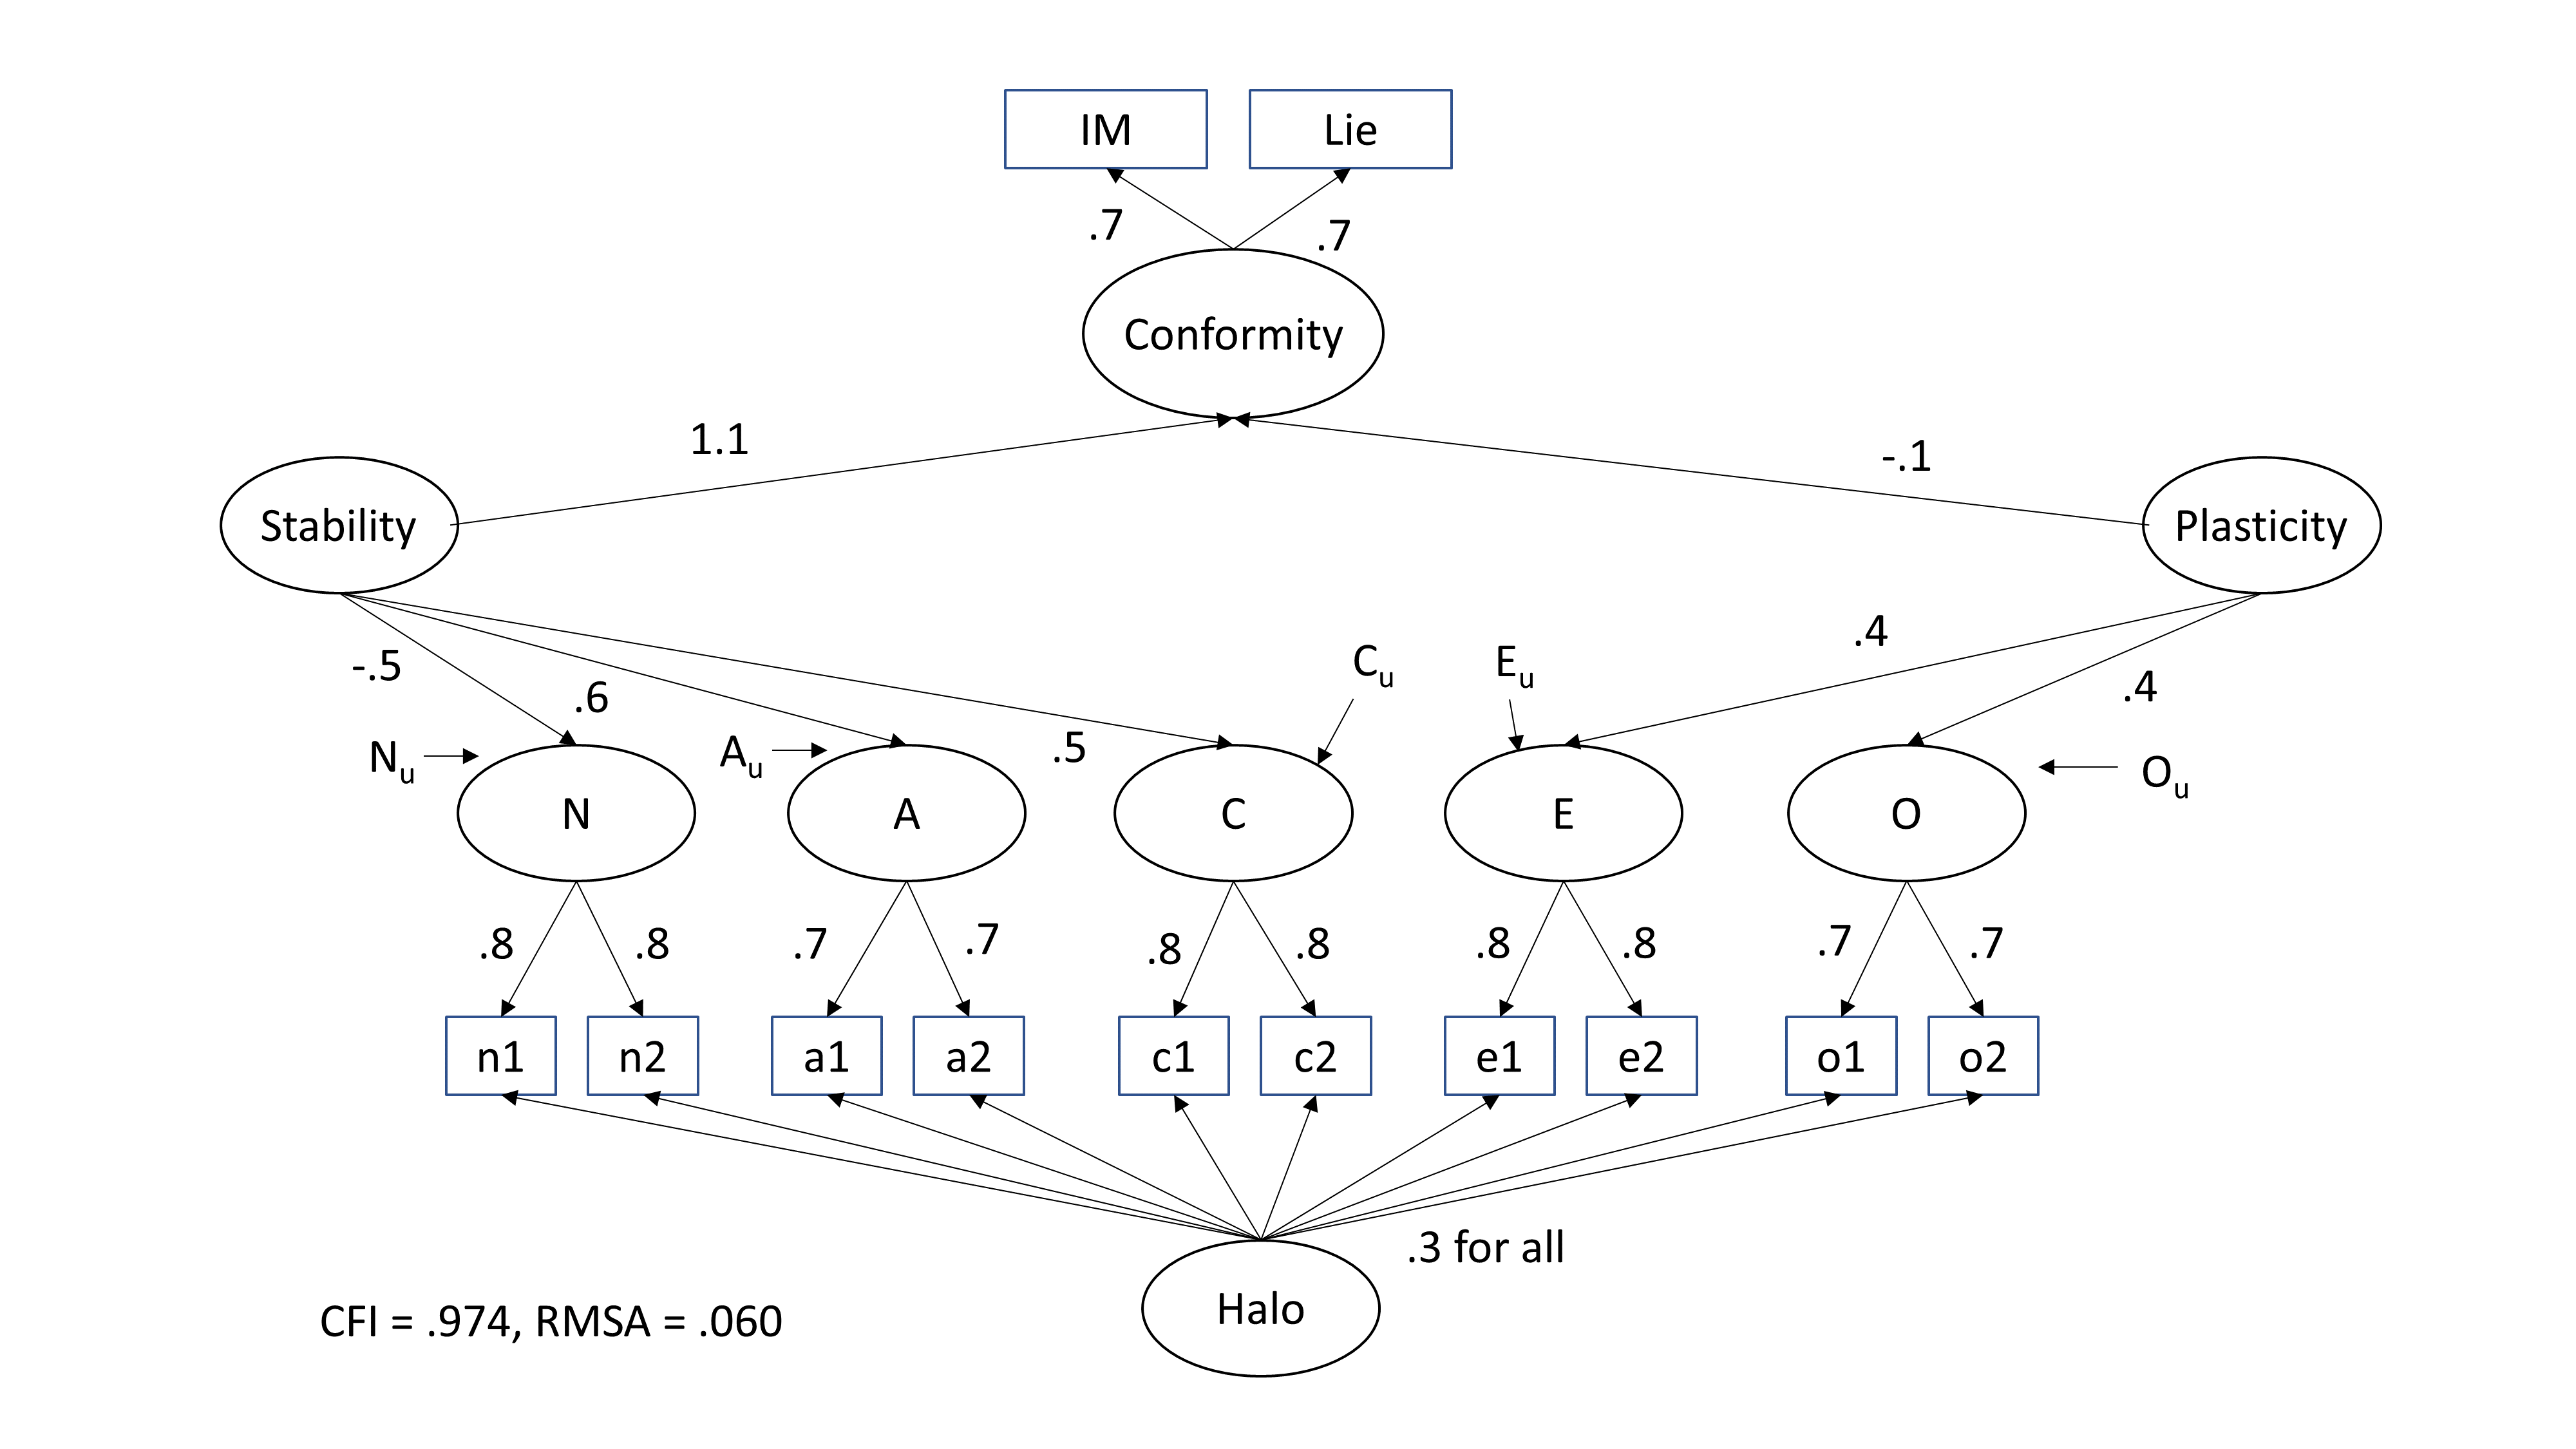
In tis model, plasticity was no longer a significant predictor of conformity, b = -.064, but the small sample size does not provide precise effect size estimates , 95%CI = -.389 to .261. The standardized coefficient for Stability remained greater than 1, b = 1.124, but the 95%CI included 1, 95%CI = .905 to 1.343.
This pointed towards another crucial problem with DeYoung and Peterson’s model. Their model assumes that the unique variance of Neuroticism, Agreeableness, and Conscientiousness is unrelated to conformity. This assumption might be false. An alternative model would still assume that Stability is related to Conformity, but that this relationship is indirect; that is, it is mediated by the Big Five factors. This model fitted the data slightly better, but fit cannot distinguish between these two models, CFI = .975, RMSEA = .059.

More importantly, in this model the residual variance in conformity was positive, suggesting that conformity is not fully explained by the Big Five factors. About one-quarter of the variance in conformity was unexplained, uniqueness = 28%. The total indirect effect of Stability on Conformity was b = .61, implying that .61^2 = 27% of the variance in Conformity were explained by Stability. This implies that the remaining (1-.28) – .27 = 45% of the explained variance in Conformity are explained by unique variance in the Big Five Stability Factors (Neuroticism, Agreeableness, & Conscientiousness).
The new analyses of the results suggest that the published model is misleading in several ways.
1. Plasticity is not a negative predictor of Conformity
2. Stability explains 30% of the variance in Conformity not 100%.
3. The correlations of Agreeableness, Conscientiousness, and Neuroticism with Conformity are not spurious (i.e., Stability is a third variable). Instead, Agreeableness, Conscientiousness, and Neuroticism mediate the relationship of Stability with Conformity.
4. The published model overestimates the amount of shared variance among Big Five factors because it does not control for response biases and made false assumptions about causality.
Does it matter?
The discussion section of the article used the model to make wide-reaching claims about personality, drawing explicitly on the finding that plasticity is a negative predictor of conformity.
As shown here, these conclusions are based on a false model. At best, we can conclude from tis article that (a) the meta-traits were still identified even after response styles were controlled and (b) conformity measures appear to be related to stability factors and not plasticity factors. However, since the publication of this article, better studies with multi-method data have examined how Big Five factors are correlated (Anusic et al., 2009; Biesanz & West, 2004; DeYoung, 2006). These studies show mixed results and are still limited by the use of scale scores as indicators of the Big Five factors. Thus, it remains unclear whether meta-traits really exist and how much variance in the Big Five traits they explain.
The existence of meta-traits is also not very important for studies that try to predict criterion variables like conformity from the Big Five. There is no theoretical justification to assume that the unique variance components of the Big Five are unrelated to the criterion. As a result, the Big Five can be used as predictors and any effect of the meta-traits would show up as an indirect effect that is mediated by the Big Five.
This model was also used by another Jordan Peterson student, in a study that predicted environmental concerns from the Big Five (Hirsch, 2010).

The most notable finding is that neuroticism, agreeableness, and conscientiousness are all positive predictor of environmental concerns. This is a problem for a model that assumes stability is a positive predictor because this would imply a negative relationship between neuroticism and environmental concerns (negative loading on stability * positive effect on environmental concerns = negative correlation between neuroticism and environmental concerns). Once more, we see that it is unreasonable to assume that the unique variances of the Big Five are unrelated to criterion variables. Criterion variables cannot be used to validate the meta-traits. What would be needed are causal factors that produce the shared variance among Big Five traits. However, it has been difficult to find specific causes of personality variation. Thus, the only evidence for these factors is limited to patterns of correlations among Big Five measures. Even if these correlations are real, they do not imply that the unique variances in the Big Five are irrelevant. Thus, from a practical point of view it is irrelevant whether the Big Five are modeled as correlated factors or with meta-traits that explain these correlations in terms of some hypothetical common causes.
I noticed that some evolutionary psychologists strangely think it useful: they think the meta-traits corresponding to the two “life history strategies”. But it also seems to be true that only some bizzare scholars actually rely on meta-traits for the necessary LHS explanation.
(“The General Factor of Personality: A Hierarchical Life History Model”, David Buss ed., The Handbook of Evolutionary Psychology, vol. 2, pp.943-967)