Lew Goldberg has made important contributions to personality psychology. He contributed to the development of the Big Five model that is currently the most widely accepted model of the higher-order factors of personality that describe the relationship among the basic trait words used in everyday language.
He also pioneered open science when he made a large pool of personality items available to all researchers and created open and free measures that mimic proprietary measures like Costa and McCrae’s NEO scales. Because these measures were designed to measure the original scales as closely as possible, the validity of the scales is defined in terms of correlations with the existing scales. The goal of the IPIP project was not to examine validity or to improve on existing measures. As Lew pointed out in a personal correspondence to me, users of IPIP measures could have created new measures based on the initial 300 items. The fact that users of these items have failed to do so shows a lack of interested in construct validation. Thanks to Lew Goldberg, we have open items and open data to develop better measures of personality.
The extended 300-item IPIP measure has been used to provide thousands of internet users free feedback about their personality, and Johnson made his data from these surveys openly available (OSF-data).
The present critical examination of the psychometric properties of the IPIP scales would not be possible without these contributions. My main criticism of personality measurement is that personality psychologists have not used the statistical tools that are needed to validate a personality measure. A common and false belief among personality psychologists is that these tools are not suitable for personality measures. A misleading article by McCrae, Costa and colleagues in the esteemed Journal of Personality and Social Psychology did not help. The authors were unable to fit a Big Five model to their data. Rather than questioning the model, they decided that the method is wrong because “we know that the Big Five model is right”. This absurd conclusion has been ridiculed by psychometricians (Borsboom, 2006), but led only to a defensive response by personality psychologists (Clark, 2006). For the most part, personality psychologists today continue to create scales or use scales that lack proper validation. The IPIP-300 is no exception. This blog post is just illustrates with a simple example how bad measurement can derail science.
The IPIP-300 aims to measure 30 personality traits that are called facets. Facets are constructs that are more specific than the Big Five and closer to everyday trait concepts. Each facet is measured with 10 items. The 10 items are summed or averaged to give individuals a score for one of the 30 facets. Each facet has a name. There are two ways to interpret these names. One interpretation is that the name is just a short-hand for a scientific construct. For example, the term Depression is just a name for the sum-scores of 10-items from the IPIP. To know what this sum score actually measures, one might need to examine the item content, learn about the correlations of this sum-score with other sum-scores, or understand the scientific theory that let to the creation of the 10-items. Accordingly, the Depression scale measures whatever it is supposed to measure and what this is is called Depression. In this case, we could change the name of the scale without changing anything in our understanding of the scale. We could call it the D-scale or just facet number 3 of Neuroticism. Depression is just a name. The alternative view assumes that the 10-items were selected to measure a construct that is at least somewhat related to what we mean by depression in our everyday language. For example, we would be surprised to see the item “I like ginger” or “I often break the rules” in a list of items that are supposed to measure depression. The use of everyday trait worlds as labels for scales does usually imply that researchers are aiming to measure a construct that is at least similar to the everyday meaning of the label. Unfortunately, this is often not the case and interpreting scales based on their labels can lead to misunderstandings.
To illustrate the problem of misch-mesch-urement, I am using two facets scales from the IPIP-300 that are labeled Depression and Modesty. I used the first 10,000 observations in Johnson’s dataset and selected only US respondents with complete data (N = 6,786). The correlation between Depression and Modesty was r = .35, SE = .01. I replicated this finding with the next 10,000 observations, again selecting only US respondents with complete data (N = 5,864), r = .39, SE = .01. The results clearly show a moderate positive relationship between the two scale scores. A correlation of r = .35 implies that a respondent who is above average in Depression has about a 67.5% probability to be also above average in Modesty. We could now start speculating about the causal mechanism that produces this correlation. Maybe bragging (not being modest) reduces the risk of depression. Maybe being depressed lowers the probability of bragging. Maybe it is both and maybe there are third variables at play. However, before we even start down this path, we have to consider the possibility that the sum score labels are misleading and we are not even seeing the correlation between the constructs that we have in mind when we talk about depression and modesty. This question is examined by fitting a measurement model to the items that were used to create the sum scores.
Of course, the two scales were chosen because a simple measurement model does not fit the data. This is shown with a simplified figure of a measurement model that assumes the 10 items of a scale all reflect a common construct and some random measurement error. The items are summed to reduce the random measurement error so that the sum score mostly reflects the common construct. The main finding is that this simple model does not meet standard criteria of acceptable fit such as a Comparative Fit Index (CFI) greater than .95 or a Root Mean Square Error of Approximation (RMSEA) below .06. Another finding is that the correlation between the factors (i.e., unobserved variables that are assumed to cause the shared variance among items) is even stronger, r = .69, than the correlation among the scales. This would be interpreted as evidence that measurement error reduces the correlation with scales and the correlation among the factors shows the true correlation. However, the model does not fit and the correlation should not be interpreted.
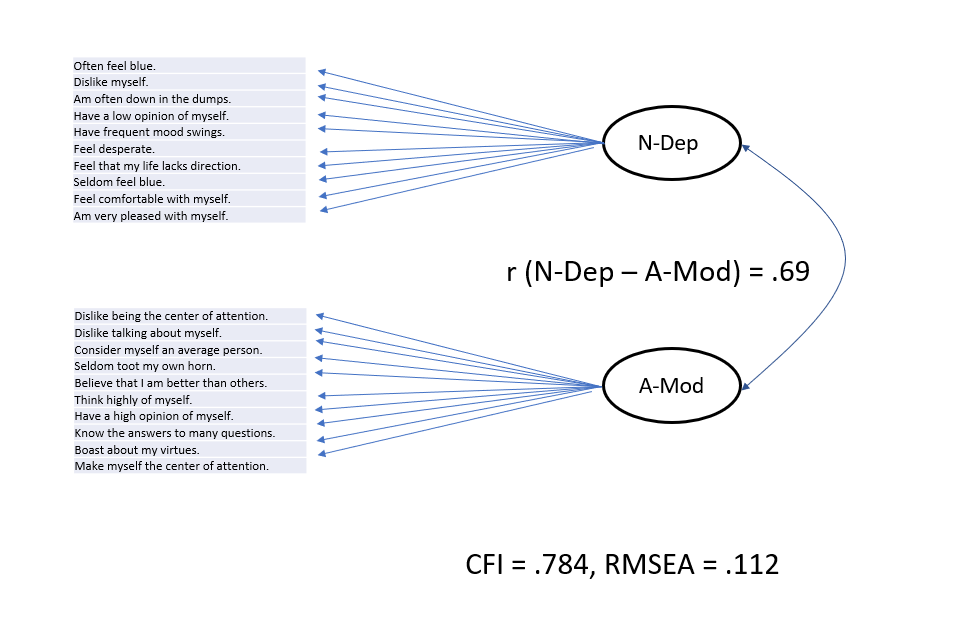
Inspection of the items suggests some reasons why the simple model may not fit and why the positive correlation is at least inflated, if not totally an artifact. For example, the item “Have a low opinion of myself” is used as an item to measure Depression, while the item “Have a high opinion of myself ” is reversed and used to measure Modesty (reverse scoring means that low ratings on this item are scored as high modesty). Just looking at the items, we might suspect that they are both measures of low and high self-esteem, respectively. While it is plausible that Depression and Modesty are linked to low self-esteem, but it is a problem to use self-esteem items to measure both. This will produce an artificial positive correlation between the scales and lead to the false impression that Depression and Modesty are positively correlated when they are actually unrelated or even negatively related. This is what I call the misch-masch problem of personality measurement. Scales are foremost averages of items and it is not clear what these scales measure if the scales are not properly evaluated with a measurement model.
As items are closer to the level of everyday conversations about personality, it is not difficult to notice other similarities between items. For example, “often feel blue” and “rarely feel blue” are simply oppositely worded questions about the same feeling. These items should correlate more strongly (negatively) with each other than the item “rarely feel blue” and “feel comfortable with myself”. However, our interpretation of items may differ from the interpretation of the average survey respondent. Thus, we need to examine empirically the pattern of correlations. One reason why personality researchers do not do this is another confusion caused by a bad label. The best statistical tool to explore the pattern of correlations among items with called Confirmatory Factor Analysis. The label “Confirmatory” has led to the false impression that this method can only be used to confirm a theoretical model. But when a model like the simple model in Figure 1 does not fit, we do not have a theory to suggest a more complex model. We could of course explore the data, but the term confirmatory implies that this would be wrong or an abuse of a method that should not be used for exploration. This is pure nonsense. We can use CFA to explore the data, find a plausible model that fits the data, and then confirm this model with a new dataset. We can then also use this model to make new predictions, test them, and if the predictions fail, further revise the model. This is called science and fully in line with Cronbach and Meehl’s (1955) approach to construct validation. Why do I make such a big deal about this? Because my suggestion to use CFA to explore personality data has been met with a lot of resistance by veteran personality psychologists.
In response to a related blog post, William Revelle wrote me an email.
Uli,
Inspired by your blog on how one needs to use CFA to do hierarchical models (which is in fact, incorrect), I prepared the enclosed slides.
I try to point out that EFA approaches can a) give goodness of fit tests and b) do hierarchical models.
In a previous post you suggested that those of us in personality should know some psychometrics and not use simple sum scores. I think you are correct with respect to the first part of your argument, but you might find my paper with Keith Widaman a useful response suggesting that sum scores are not as bad as you think.
Your comment about some people (i.e., our Dutch friend) refusing to understand the silliness of a general factor of personality was most accurate.
Bill
Bill is right that EFA can sometimes produce the right results, but this is not a good argument to use an inferior method. The key problem of EFA is that it does not require any theory and as a result also does not test a theory. If a model does not fit, researchers cannot change the model because the model is based on a stringent set of mathematical principles that are not based on any substantive theory. In contrast, CFA requires that researchers think about their data and why the model does not fit.
In response to my CFA analysis of Costa and McCrae’s NEO-PI-R, Robert McCrae wrote this response:
Uli
I just read your blog on “what lurks beneath”. I must say that I find the blog format disconcerting, both for its informality and its lack of editing and references. But here are a few responses.
1. We certainly agree that people ought to measure facets as well as domains; that personality is not simple structured; that there is some degree of evaluative bias in any single source of data.
2. What we argued in the 1996 paper was that CFA “as it has typically been applied in investigating personality structure, is systematically flawed” (p. 552, italics added). I should think you would agree with that position; you have criticized others for failing to acknowledge secondary loadings and evaluative biases in their CFAs.
3. Why in the world do you think that “CFA is the only method that can be used to test structural theories”? If that were true, I would agree with your position. But the major point of our paper was to offer an alternative confirmatory approach using targeted rotation. There are a number of instances where this method has led to falsification of hypotheses—John’s study of personality in dogs and cats showed that the FFM doesn’t fit even after targeted rotation.
4. I would have liked a comparison with Marsh’s ESEM, which was developed in part in response to our 1996 paper.
5.”The evaluation of model fit was still evolving”. That, I would say, is an understatement. In my experience, most fit indices in SEM and other statistical approaches are essentially as arbitrary as p < .05. There are virtually no empirical tests of the utility of fit indices. And most are treated as dichotomies: A model fits or not. That is like deciding that coefficient alpha should be .70, and throwing out a scale because its alpha is only .69. I recall a paper on national levels of traits in which the authors were told by reviewers not to report the observed means because they could not demonstrate measurement invariance. This is statistically-mandated data suppression.
6. I am not quite convinced by your analysis of evaluative bias in the NEO data. It is really difficult to separate substance from style in mono-method data. One could argue that the factor you call EVB is really N, and vice-versa. I have attached a chapter in which we reported joint factor analyses of self-reports and observer ratings and included bias factors (pp. 280-283).
–Jeff
I was fortunate to take a CFA (SEM) course offered by Ralf Schwarzer at the Free University Berlin in the early 1990s. I have been using LISREL, EQS, and now MPLUS for 30 years. I thought, the older professors were just too old to learn this method, and that the attitudes would change. However, in 2006 Borsboom wrote his attack on bad practices in personality research and measurement is still considered a secondary topic in graduate education. This attitude towards measurement has been called a measurement-schmeasurement attitude (Flake & Fried, 2020). It is time to end this embarrassing status quo and to take measurement seriously.
After exploring the data and trying many different models, I settled on a model that fits the data. I then cross-validated this model in the second dataset. However, given the large sample sizes, the structure is very robust and the model had nearly identical fit in the second dataset. The model fit of the cross-validated model also met standard fit criteria, CFI = .983, RMSEA = .035. This does not mean that it is the best model. As the data are open, other researchers could try to find better models. Importantly, minor differences between models are not important, as long as the main results are consistent. The model also does not automatically tell us what the 10-item scales measure. This question can only be answered with additional data that relate the factors in the model to other variables. However, we can at least see how items are related to the factors that the scales aimed to measure.

Figure 2 shows that it is possible to describe the correlations among items from the same scale with three factors that are simply labeled Dep1, Dep2, and Dep3 for Depression and Mod1, Mod2, and Mod3 for Modesty. Dep1 is mainly related to feeling blue and depressed. Dep2 is related to low self-esteem. Dep 3 is related to two items that might be interpreted as pessimism. Mod1 is related to low self-esteem, Mod2 is about bragging, and Mod3 is about avoiding being the center of attention. As predicted by the similar wording, two self-esteem items of Mod2 are also related to the Dep2 factor. In addition, the Modesty factor is also related to Dep2, presumably because modest participants do not rate themselves lower on self-estem items. However, there is no relationship to Dep1, the feeling blue factor. Thus, Modesty is not related to feeling depressed, as implied by the Depression label of the scale. In fact, the correlation between the Depression and Modesty factors is now close to zero. Thus, the strong correlation in the bad fitting model and the moderate correlation based on scale scores misrepresents the relationship between Depression and Modesty.
Simple models of two facets are just a building block along the way to testing more complex models of personality. I hope you realize that this is an important step before personality scales can be used for research and before people are given feedback about their personality online. You might be surprised that not all personality psychologists agree. Some personality researchers rather publish pretty pictures of the models in their heads without checking that they actually fit real data. For example, Colin DeYoung has published this picture to illustrate his ideas about the structure of personality.
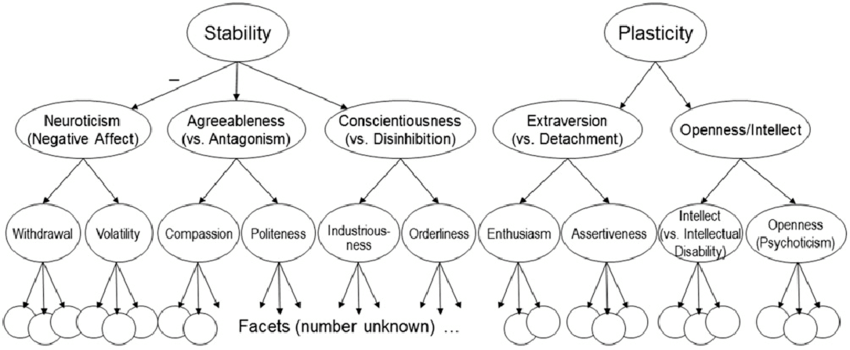
This model implies that there should be a negative correlation between the Depression facet of Neuroticism and the Modesty facet of Agreeableness because Stability has a negative relationship with Neuroticism and a positive relationship with Agreeableness (minus times plus = minus). I shared my initial results that showed a positive correlation which contradicts his model (see also our published results by Anusic et al., 2009, that showed problems with the Stability factor).
His final response was:
“Uli, I think the problem is that the actual structure is too complex to make it easily represented in a single CFA model. The point of the pictures is to show only some important aspects of the actual structure. As long as one acknowledges it’s only part of the structure, I don’t see that as a problem.”
To my knowledge he has never attempted to specify his model in more detail to accommodate findings that are inconsistent with this simple model. He also does not seem very eager to explore this question using CFA.
I suppose I could try to create a more complete CFA model, starting from the 10 aspects, which would allow correlations between Enthusiasm and Compassion and between Politeness and Assertiveness, and also would include additional paths from Plasticity and Stability to certain aspects, but even then I’d be wary of claiming it was the complete structure. Whatever might be left out could still easily lead to misfit. It would take a lot of chutzpah to claim that one was confident in understanding all details of the covariance structure of personality traits.
To me this sounds like an excuse for bad fit. The picture gets it right, even if the model does not fit. This is the same argument that was ridiculed by Borsboom’s critique of Costa and McCrae. If models are immune to empirical tests, they are merely figments of researchers’ imagination. To make scientific claims one first needs to pass the first test: show that a model fits the data, and if a simple model does not fit the data, we need to reject the simple model and find a better one. As Revelle pointed out, nowadays EFA software can also show fit indices. What he doesn’t say is that the typical EFA models have bad fit and that there is not much EFA users can do when this is the case. In contrast, CFA can be used to explore the data, find plausible models with good fit, like the one in Figure 2, and then test these models with new data. Call me crazy, but I have the chutzpah and confidence that I can find a well-fitting model for the structure of personality. In fact, I have already done so (Schimmack, 2019), and now I am working on doing the same for the IPIP-300. Stay tuned for the complete results. I hope this post made it clear why it is important to examine this question even for measures that have been used for decades in hundreds of studies.
Post-Script: When a figure says less than zero words
In a further email exchange Colin DeYoung asked me to add the following clarification.
COLIN:
Uli, please add the following quote to your blog post. You are misrepresenting me inasmuch as you are claiming that my theoretical position requires that your model of modesty and depression should show a negative correlation between modesty and depression. This is not true. I would absolutely never predict that, and I think quoting the passage here makes it clear why that is:
“A final note on the hierarchy shown in Fig. 1: It is necessarily an oversimplification at the levels below the Big Five, because personality does not have simple structure (Costa & McCrae, 1992; Hofstee, de Raad, & Goldberg, 1992). Some facets and aspects have associations, not depicted in the figure, with factors in other domains. This is true even between some traits located under different metatraits, which could not be related if the diagram in Fig. 1 were complete. For example, Compassion is positively related to Enthusiasm, and Politeness is negatively related to Assertiveness (DeYoung et al., 2007, 2013).”
ULI:
Happy to add this to the blog post, but I do have to ask. Is there any finding that you would take seriously to revise your model or is this model basically unfalsifiable?
After all, I also fitted a model without higher-order factors and aspects to the 30 facets. It would be really interesting to do a multi-method study with facet-factors as starting point, but I don’t know a study that did that or any data to do it.
COLIN:
Thanks, Uli. Please do add that text to your blog post as my explanation of the figure.
As that text points out, what you’re calling my “model” is in fact just a summary of various empirical results. It is not, and has never been, intended as a formal CFA model.
[Explanation: The figure uses the symbolic language of causal modeling that links factors (circles) to other factors (circles) with arrows pointing from one factor to another (implying a causal effect or at least a representation of shared variance among factors that are related to a common higher-order factor. It is not clear what this figure could tell readers unless we believe that factors are real and at some point explain a pattern of observed correlations. To say that the model is not a CFA model is to say that the model makes no empirical predictions and that factors like Stability or Plasticity only exit as constructs in Colin’s imagination. Not sure why we should print such imaginary models in a scientific article.]
I like what you’re doing – the point of science is to build on someone else’s work. Even if it only clarifies why it’s not good enough. You can tell when you’re up against politics with ““Uli, I think the problem is that the actual structure is too complex to make it easily represented in a single CFA model.” Meaning: “I’m not going to try it – waste of my time”. The next part, “As long as one acknowledges it’s only part of the structure, I don’t see that as a problem” is the same as saying, “I like my picture and it seems to convince people, so, good enough! I don’t need to get everything perfect to stay where I’m at now.” And, that proves what Kuhn said about bad habits only dying off 1 actor at a time. Once these people have tenure on a mountain and get close to retirement they’re not going to change. Why bother when they have already secured a warm place with nice windows – no point in stirring the shit!
Nice post, it’s something I’ve also often been thinking about when looking at personality correlations. (And even at the items in personality scales – a lot of the items are very obviously closely synonymous, which raises questions about the relevance of having so many items in the first place.)
One thing you might also be interested in is investigating this phenomenon in research of cognitive abilities. There’s often a tendency for people to study whether different IQ test batteries “have the same g-factor” – but of course if they have overlap in narrower factors, then it is possible that people are overestimating the correlations between their g-factors.
A related thing I’ve been wondering about is this study:
https://www.sciencedirect.com/science/article/abs/pii/S0160289618301521
which finds that the general factor of video game performance is closely correlated to the general factor of cognitive abilities. But I am kind of suspicious of the tests they used to measure the g-factor, as it looks on their names like many of them are spatial or perceptive tests, which seem to me like they could plausibly share group variance with video games. That said I have not looked closely at the tests, so I am not sure.