Abstract
An influential model of personality disorders assumes a general factor of personality functioning that underlies the presence of personality disorder symptoms. To measure this factor, Morey (2017) developed the Level of Personality Functioning scale. The construct and the measure of general personality functioning, however, remains controversial. Here I analyze data that were used to claim validity of the LPFS using structural equation modeling. I demonstrate that two factors account for 88% of the variance in LPFS scores. One factor reflects desirability of items (70%) and the other factor reflects scoring of the items (12%). I then show that the evaluative factor in the LPFS corelates highly, r = .9, with a similar evaluative factor in ratings of normal personality, when all items are scored in terms of desirability. Based on previous evidence from multi-method studies of normal personality, I interpret this factor as a response style that is unique to individual raters. Thus, most of the variance in LPFS scores reflects evaluative rating biases rather than levels of personality functioning. I also identified 10 items from the LPFS that are mostly free of actual personality variance, but correlate strongly with the evaluative factor. These items can be used as an independent measure of evaluative biases in self-ratings. The main conclusion of this article is that theories of personality disorders lack a clear concept and that self-report measures of personality disorders lack construct validity. Future research on personality disorders need to conduct more rigorous construct validation research with philosophically justifiable definitions of disorders and multi-method validation studies.
Introduction
A major problem in psychology is that it is too easy to make up concepts and theories about human behaviors that are based on overgeneralizations from single incidences or individuals to humans in general. A second problem is that pre-existing theories and beliefs often guide research and produce results that appear to confirm those pre-exist believes. A third problem is that psychology lacks a coherent set of rules to validate measures of psychological constructs (Markus & Borsboom, 2013). As a result, it is possible that large literatures are based on invalid measures (e.g., Schimmack, 2021). In this blog post, I will present evidence that an influential model of personality disorders is equally based on flawed measures.
What Are Personality Disorders?
The notion of personality disorders has a long history that predates modern conceptions of personality (Zacher, 2017). An outdated view, equated personality disorders with extreme – statistically abnormal – scores on measures of personality (Schneider, 1923). The problem with this definition of disorders is that abnormality can even be a sign of perfect functioning as in the performance of a Formula 1 race car or an Olympic athlete.
Personality disorders were formalized in the third Diagnostic and Statistical Manual of Mental Disorders, but the diagnosis of personality disorders remained controversial; at least, much more controversial than diagnosis of mental disorders with clear symptoms of dysfunction such as delusions and hallucinations. The current DSM-5 contains two competing models of personality disorders. Without a clear conception of personality disorders, the diagnosis of personality disorders remains controversial (Zacher, 2017).
A main obstacle in developing a scientific model of personality disorder is that historic models of personality disorders are difficult to reconcile with contemporary models of normal functioning personality that has emerged in the past decades. To achieve this goal, it may be necessary to start with a blank slate and rethink the concept of personality disorders.
Distinguishing Personality Disorders from (Normal) Personality
There is no generally accepted theory of personality. However, an influential model of personality assumes that individuals have different dispositions to respond to the same situation. These dispositions develop during childhood and adolescence in complex interactions between genes and environments that are poorly understood. By the beginning of early adulthood, these dispositions are fairly stable and change only relatively little throughout adulthood. While there are hundreds of dispositions that influence specific behaviors in specific situations, these dispositions are related to one or more of five broad personality dispositions that are called the Big Five. Neuroticism is a general dispositions to experience more negative feelings such as anxiety, anger, or sadness. Extraversion is a broad disposition to be more engaged that is reflected in sociability, assertiveness, and vigor. Openness is a general disposition to engage in mental activities. Agreeableness is a general disposition to care about others. Finally, conscientiousness is a general disposition to control impulses and persist in the pursuit of long-term goals. Variation along these personality traits is considered to be normal. Variation along these traits exists either because it has no major effect on life outcomes, the genetic effects are too complex to be subjected to selection, or because traits have different costs and benefits. This short description of normal personality is sufficient to discuss various models of personality disorders (Zachar & Krueger, 2013).
The vulnerabiltiy model of personality disorders can be illustrated with high neuroticism. High neuroticism is a predictor of lower well-being and a risk factor for the development of mood disorders. Even during times when individuals are not have clinical levels of anxiety or depression, they report elevated levels of negative moods. Thus, one could argue that high neuroticism is a personality disorder because it makes individuals vulnerable to suffer mental health problems. However, even in this example it is not clear whether neuroticism should be considered a risk factor for a disorder or a disorder itself. As many mood disorders are episodic, while neuroticism is stable, one could argue that neuroticism is a risk factor that only in combination with other factors (e.g., stress) triggers a disorder. The same is even more true for other personality traits. For example, low conscientiousness is one of several predictors of some criminal behaviors. This finding might be used to argue that low conscientiousness is a criterion to diagnose a personality disorder (e.g., psychopathy). However, it is also possible to think about low conscientiousness as a risk factor rather than a diagnostic feature of a personality disorder. In line with this argument, Zachner and Kruger (2013) suggest that “vulnerabilities are not disorders” (p. 1020). A simple analogy may suffice. White skin is a risk factor for skin cancer. This does not mean that White skin is a skin disease and it is possible to avoid the clinically relevant outcome of skin cancer by staying out of the sun, proper closing, or applying sun blockers. Even if we would recognize that personality can be a risk factor for various disorders, it would not justify the label of a personality disorder. The term implies that something about a person’s personality impedes their proper functioning. In contrast, the term risk factor merely implies that personality can contribute to the disfunction of something else.
The pathoplasticity model uses the term personality disorder for personality traits that influence the outcome of other psychiatric disorders. Zachar and Kruger (2013) suggest that people with a personality disorder develop mental health problems earlier in life or more often. This merely makes them risk factors, which were already discussed under the vulnerability model. More broadly personality traits may influence specific behaviors of patients suffering from mental health problems. For example, personality may influence whether depressed patients commit suicide or not. For example, men are more likely to commit suicide than women despite similar levels of depression. Understanding these personality effects is surely important for the treatment of patients, but it does not justify the label of personality disorders. In this example, the disorder is depression and treatment has to assess suicidality. The personality factors that influence suicidality are not part of the disorder.
The spectrum model views personality disorders as milder manifestations of more severe mental health problems that share a common cause. This model blurs the distinction between normal and disordered personality. At what level is anxiety still normal and at what level is it a mild manifestation of an anxiety disorder. A more reasonable distinction between normal and clinical anxiety is whether anxiety is rational (e.g., gun fire at a mall) or irrational (fear of being abducted by aliens). Models of normal personality traits are not able to capture these distinctions.
The decline-in-functioning model assumes that personality disorders are the result of traumatic brain injury, severe emotional trauma, or severe psychiatric disorder. As all behavior is regulated by the brain, brain damages can lead to dramatic changes in behavior. However, it seems odd to call these changes in behaviors a personality disorder. With regards to traumatic life events, it is not clear that they reliably produce major changes in personality. Avoidance after a traumatic injury is typically situation specific rather than a change in a broader general disposition. This model also ignores that the presence of a brain injury, other mental illnesses or drugs is used as an exclusion criterion to diagnose a personality disorder (Skodol et al., 2011).
The impairment-distress model more directly links personality to disorder or dysfunction. The basic assumption is that personality is associated with clinically significant impairment or distress. I think association is insufficient. For example, gender is corelated with neuroticism and the prevalence of anxiety disorders. It would be difficult to argue that this makes gender a personality disorder. To justify the notion of a personality disorder, personality needs to be a cause of distress and treatment of personality disorders should alleviate distress. Once more, high neuroticism might be the best candidate for a personality disorder. High neuroticism predicts higher levels of distress and treatment with anti-depressant medication or psychotherapy can lower neuroticism levels and distress levels. However, the impairment-distress model does not solve the problems of the vulnerability model. Is high neuroticism sufficient to be considered an impairment or is it merely a risk factor that can lead to impairment in combination with other factors?
This leaves the capacity-failure model as the most viable conceptualization of a personality disorder (Zachar, 2017). The capacity-failure model postulates that personality disorders represent dysfunctional deviations from the normal functions of personality. This model is a straightforward extension of conceptions of bodily functioning to personality. Organs and other body parts have clear functions and can be assessed in terms of their ability to carry out these functions (e.g., hearts pump blood). When organs are unable to perform these functions, patients are sick and suffer. Zachar (2017) points out a key problem of the extension of biological functions to personality. “The difficulty with all capacity failure models is that they rely on speculative inferences about normal, healthy functioning” (p. 1020). The reason is that personality refers to variation in systems and processes that serve a specific function. While the processes have a clear function, it is often less clear what function variation in these processes serves. Take anxiety as an example. Anxiety is a universal human emotion that evolved to alert people to potential danger. Humans without this mechanism might be considered to have a disorder. However, neuroticism reflects variation in the process that elicits anxiety. Some people are more sensitive and others are less sensitive to danger. To justify the notion of a personality disorder, it is not sufficient to specify the function of anxiety. It is also necessary to specify the function of variation in anxiety across individuals. This is a challenging task and current research on personality disorders has failed to specify personality functions to measure and diagnose personality disorders from a capacity-failure model.
To summarize, the reviewed conceptualizations of personality disorders provide insufficient justification for a distinction between normal personality and personality disorders. While some personality types may be associated with some negative outcomes, these correlations do not provide an empirical basis for a categorical distinction between personality and personality disorders. This leaves the capacity-failure model as the last option (Zachar, 2017). The capacity-failure model postulates that personality disorders represent dysfunctional deviations from the normal functions of personality. This model is a straightforward extension of conceptions of bodily functioning to personality. Organs and other body parts have clear functions and can be assessed in terms of their ability to carry out these functions (e.g., hearts pump blood). When organs are unable to perform these functions, patients are sick and suffer. Zachar (2017) points out a key problem of the extension of biological functions to personality. “The difficulty with all capacity failure models is that they rely on speculative inferences about normal, healthy functioning” (p. 1020). That is, while it is relatively easy to specify the function of body parts, it is difficult to specify the functions of personality traits. What is the function of extraversion or introversion? The key problem is that personality refers to variation in basic psychological processes. While we can specify the function of being selfish or altruistic, it is much harder to specify the function of having a disposition to be more selfish or more altruistic (agreeableness). However, without a clear function of these personality dispositions, it is impossible to define personality dysfunction. This is a challenging task and current research on personality disorders has failed to specify personality functions that could serve as a foundation for theories of personality disorders.
The Criterion-A Model of Personality Disoders
Given the lack of a theory of personality disorders, it is not surprising that personality disorder have conflicting views about the measurement of personality disorders (it is difficult to measure something, if you do not know what you are trying to measure). One group of researchers argues for a one-dimensional model of personality disorders that is called personality pathology severity (Morey, 2017; Morey et al., 2022). This model is based on the assumption that specific items or symptoms that are used to diagnose personality disorders are correlated and “show a substantial first or general factor” (p. 650). To measure this general dimension of personality disorder with self-ratings, Morey (2017) developed the Levels of Personality Functioning Scale–Self Report (LPFS–SR).
A major problem of this measure is the lack of a sound conceptual basis. That is, it is not clear what levels of personality functioning are. As noted before, it is not even clear what function individual personality traits have. It is much less clear what personality functioning is because personality is not a unidimensional trait. Take a car as an analogy. One could evaluate the functioning of a car and order cars in terms of their level of functioning. However, to do so, we would evaluate the functioning of all of the cars parts and the level of functioning would be a weighted sum of the checks for each individual part. The level of functioning does not exist independent of the functioning of the parts. For the diagnosis of cars it is entirely irrelevant whether functioning of one part is related to functioning of another part. A general factor of dysfunction might be present (newer cars are more likely to have functioning parts than older cars), but the general factor is not the construct of interest. The construct of dysfunction requires assessing the functioning of all parts that are essential for a car to carry out its function.
In short, the concept of levels of personality functioning is fundamentally flawed. Yet, validation studies claim that the levels of personality function scale is a valid measure of the severity of personality disorders (Hopwood et al., 2018). Unfortunately, validation research by authors who developed a test is often invalid because they only look for information that confirms their beliefs (Cronbach, 1989; Zimmermann, 2022). Ideally, validation research would be carried out by measurement experts who do not have a conflict of interest because they are not attached to a particular theory. In this spirit, I examined the construct validity of the level of psychological functioning scale, using Hopwood et al.‘s (2018) data (osf.io/v2s8u).
Structure of the LPFS-SR
Hopwood et al. (2018) did not conduct a factor analysis of the 80 LPFS-SR items. The omission of such a basic psychometric analysis is problematic even by the low standards of test validation in psychology (Markus & Borsboom, 2013). The reason might be that other researchers have already demonstrated that the assumed structure of the questionnaire does not fit the data (Sleep et al., 2020). Sleep et al. were also unable to find a model that fits the data. Thus, my analyses provide the first viable of the correlations among the LPFS-SR items. Viable, of course, does not mean perfect or true. However, the model provides important insights into the structure of the LPFS-SR and shows that many of the assumptions made by Morey (2017) are not supported by evidence.
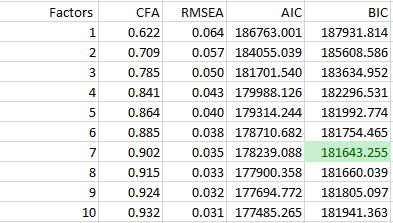
I started with an exploratory factor analysis to examine the dimensionality of the LPFS-SR. Consistent with other analyses, I found that the LPFS-SR is multidimensional (Sleep et al., 2020). However, whereas Sleep et al. (2020) suggest that three or four factors might be sufficient, I found that even the Bayesian Information Criterion suggested 7 factors. Less parsimonious criteria suggested even more factors (Table 1).
I next examined whether the four-factor model corresponds to the theoretical assignment of items to the four scales. The criterion for model fit was that an item had the highest loading on the predicted factor and the factor loading was greater than .3. Using this criterion, only 33 of the 80 items had the expected factor loadings. Moreover, the correlations among the four factors were low. One factor had nearly zero correlations with the other three factors, r = .05 to .13. The correlations among the other three factors were moderate, r = .30 to .56, but do not support the notion of a strong general factor.
Exploratory factor analysis has serious limitations as a validation tool. For example, it is unable to model hierarchical structures, although Morey (2017) assumed a hierarchical structure with four primary and one higher-order factor. The most direct test of this model would require structural equation modeling (Confirmatory Factor Analysis). EFA also has problems separating content and method factors. As some of the items are reverse scored, it is most likely that acquiescence bias distorts the pattern of correlations. SEM can be used to specify an independent acquiescence factor to control for this bias (Anusic et al., 2009). Thus, I conducted more informative analysis with structural equation modeling (SEM) that are often called confirmatory factor analysis. However, the label confirmatory is misleading because it is seems to imply that SEM can only be used to confirm theoretical structures. However, the main advantage of SEM is that it is a highly flexible tool that can represent hierarchies, model method factors, and reveal residual correlations among items with similar content. This statistical tool can be used to explore data and to confirm models. A danger in exploratory use of CFA is overfitting. However, overfitting is mainly a problem for weak parameters that have little effect on the main conclusions. In my explorations, I set the minimum modification index to 20, which limits the type-I error probability to 1/129,128. Most parameters in the final model meet the 5-sigma criterion (z = 5, chi-square(1) = 25) that is used in particle physics to guard against type-I errors. Moreover, I posted all exploratory models (https://osf.io/uyrk7/) and I encourage others to improve on my model.
The final model (final.final.6) had acceptable fit according to the standard of .06 for the Root Mean Square Error of Approximation, RMSEA = .030. However, the Comparative Fit Index was below the criterion value of .95 that is often used to evaluate overall model fit, CFI = .922. Another way to evaluate the model is to compare it to the fit of the EFA models in Table 1. Accordingly, the model had better fit in a comparison of the Bayesian Information Criterion (179,033.304 vs. 181,643.255), Aikan’s Information Criterion (177,270,345 vs. 177,485.265), and RMSEA (.030 vs. 031), but not the CFI (.922 vs. 932). The difference between fit indices is explained by the trade-off between parsimony and precision. The CFA model is more parsimonious (2958 degrees of freedom) than the EFA model with 10-factors (2405 degrees of freedom). Using the remaining 554 degrees of freedom would produce even better fit, but at the risk of overfitting and none of the smaller MI suggested substantial changes to the model. The final model had 12 factors. that I will describe in order of their contribution to the variance in LPFS scale scores.
The most important factor is a general factor that showed notable positive loadings (> .3) for 64 of the 80 items (80%). This factor correlated r = .837 with the LPFS scale scores. Thus, 70% of the variance in scale scores reflects a single factor. This finding is consistent with the aim of the LPFS to measure predominantly a single construct of severity of personality functioning (y (Morey, 2017; Morey et al., 2022).). However, the presence of this factor does not automatically validate the measure because it is not clear whether this factor represents core personality functioning. An alternative interpretation of this factor assumes that it reflects a response style to agree more with desirable items that is known as socially desirable responding or halo bias (Anusic et al., 2009). I will examine this question later on when I relate LPFS factors to factors of normal personality.
The second factor reflects scoring of the items. All items were coded as directly coded (68) or reverse coded (12). For the sake of parsimony and identifiability, loadings on this factor were fixed to 1 or -1. Thus, all items loaded on this factor by definition. More important, this factor corelated r = .428 with LPFS scores. Thus, response sets explained another 18% of the variance in LPFS scores. Together, these two factors explained 70 + 18 = 82% of the total variance in LPFS scores.
The first content factor had 13 notable loadings (> .3). The highest loadings were for the items “Sometimes I am too harsh on myself” (.61), “The standards that I set for myself often seem to be too demanding, or not demanding enough” (.51)., and “I tend to feel either really good or really bad about myself.” (.483). This factor corelated only r = .154 with the LPFS scale scores. Thus, it adds at most 2% to the explained variance in LPFS scale scores. The contribution could be less because this factor is corelated with other content factors.
The second content factor had 8 notable loadings (> .3). The highest loadings were for the items “I have many satisfying relationships, both personally and on the job” (.487), “I work on my social relationships because they are important to me” (.445), and “Getting close to others just leaves me vulnerable and and isn’t worth the risk” (.440). This factor seems to capture investment in social relationships. The correlation of this factor with LPFS scores is r = .120 and the factor contributes at most 1.4% to the total variance of LPFS scores.
The third content factor had 6 notable loadings (> .3). The highest loadings were for the items “The key to a successful relationship is whether I get my needs met” (.490), “I’m only interested in relationships that can provide me with some comfort” (.476), “I can only get close to someone who can acknowledge and address my needs” (.416). This factor seems to reflect a focus on exchange versus communal relationships. It correlated r = .098 with LPFS scale scores and contributes less than 1% of the total variance in LPFS scores.
The 4th content factor had 7 notable loadings (> .3). The highest loadings were for the items “I have some difficulty setting goals” (.683), “I have difficulties setting and completing goals” (.639), and “I have trouble deciding between different goals” (.534). The item content suggests that this factor reflects problems with implementing goals. It correlates r = .070 with LPFS scores and explains less than 1% of the total variance in LPFS scores.
The 5th factor had only 3 notable loadings (> .3). The three items were “When others disapprove of me, it’s difficult to keep my emotions under control” (.572), “I have a strong need for others to approve of me” (..498), “In close relationships, it is as if I cannot live with the other person” (.334). This factor might be related to need for approval or anxious attachment. It correlates r = .057 with LPFS scores and explains less than 1% of the total variance in these scores.
The 6th factor had 4 notable loadings (> .3). The highest loadings were for the items “Feedback from others plays a big role in determining what is important to me” (.427), “My personal standards change quite a bit depending upon circumstances.” (.365), and “My motives are mainly imposed upon me, rather than being a personal choice.” (.322). This factor seems to capture a strong dependence on others. It correlates r = .050 with LPFS scores and contributes less than 1% of the total variance.
The 7th factor was a mini-factor with only three items and only one item had a loading greater than .3. The item was “My life is basically controlled by others.” The items of this factor all had secondary loadings on the previous factor, suggesting that it may be a method artifact and not a specific content factor. It correlated only r = .037 with LPFS scale scores and has a negligible contribution to the total variance in LPFS scores.
The 8th factor is also a mini-factor with only three items. Two items had notable loadings (> .3), namely “I can appreciate the viewpoint of other people even when I disagree with them” (.484) and “I can’t stand it when there are sharp differences of opinion” (. 379).
The 9th factor had 4 items with notable loadings (> .3), but two loadings were negative. The two items with positive loadings were “I don’t pay much attention to, or care very much about, the effect I have on other people” (.351) and “I don’t waste time thinking about my experiences, feelings, and actions” (.301). The two items with negative loadings were “My emotions rapidly shift around” (-.381) and “although I value close relationships, sometimes strong emotions get in the way” (-.319). This factor seems to capture emotionality. The correlation with LPFS scores is trivial, r = .008.
The 10th factor is also a mini-factor with only three items. Two items had notable loadings, namely “People think I am pretty good at reading the feelings and motives of others in
most situations” (-.567) and “I typically understand other peoples’ feelings better than they do (-.633). The content of these items suggests that the factor is related to emotional intelligence. Its correlation with LPFS scores is trivial, r = -.007.
In addition, there were 41 correlated residuals. Correlated residuals are essentially mini-factors with two items, but it is impossible to determine the loadings of items on these factors. Most of these correlated residuals were small (.1 to .2). Only two item pairs had correlated residuals greater than .3,, namely “I don’t have a clue about why other people do what they do” correlated with “I don’t understand what motivates other people at all” (.453) and “I can only get close to somebody who understands me very well” correlated with “I can only get close to someone who can acknowledge and address my needs” (..367). Whether these correlated residuals reflect important content that requires more items or whether they are merely method factors due to similar wording is an open question, but it does not affect the interpretation of the LPFS scores because these mini factors do not substantially contribute to the variance in LPFS scores.
The main finding is that the factor analysis of the LPFS items revealed 2 major factors and many minor factors. One of the major factors is a method factor that reflects scoring of the items. The other factor reflects a general disposition to score higher or lower on desirable attributes. This factor account for 70% of the total variance in LPFS scores. The important question is whether this factor reflects actual personality functioning – whatever this might be – or a response style to agree more strongly with desirable items and to disagree more with undesirable items.
Validation of the General Factor of the LPFS
A basic step in construct validation research is to demonstrate that correlations with other measures are consistent with theoretical expectations (Cronbach & Meehl, 1955; Markus & Borsboom, 2013; Schimmack, 2021). The focus is not only on positive correlations with related measures, but also the absence of correlations with measures that are not expected to be correlated. This is often called convergent and discriminant validity (Campbell & Fiske, 1959). Moreover, validity is a quantitative construct and the magnitude of correlations is also important. If the LPFS is a measure of core personality functioning it should corelate with life outcomes (convergent validity). This hypothesis could not be examined with these data because no life outcomes were measured. Anther prediction is that LPFS scores should not corelate with measures of response styles (discriminant validity). This hypothesis could be examined because the dataset contained a measure of the Big Five personality traits and it is possible to separate content and response styles in Big Five measures because multi-method studies show that the Big Five are largely independent (Anusic et al., 2009; Biesanz & West, 2004; Chang, Connelly, & Geeza, 2012; DeYoung, 2006). Additional evidence shows that the evaluative factor in personality ratings predicts self-ratings of well-being, but is a weak or no predictor of informant ratings of well-being (Kim, Schimmack, & Oishi, 2012; Schimmack & Kim, 2020). This is a problem for the interpretation of this factor as a measure of personality functioning because low functioning should produce distress that is notable to others. Thus, a high correlation between the evaluative factor in ratings of personality and personality disorder would suggest that the factor reflects a rating bias rather than personality functioning.
I first fitted a measurement model to the Big Five Inventory – 2 (Soto & John, 2017). In this case, it was possible to use a confirmatory approach because the structure of the BFI-2 is well-known. I modeled 15 primary factors with loadings on the Big Five factors as higher-order factors. In addition, the model included one factor for evaluative bias and one factor for acquiescence bias based on the scoring of items. This model had reasonable fit, but some problems were apparent. The conscientiousness facet “Responsibility” seemed to combine two separate facets that were represented by two items each. I also had problems with the first two items of the Agreeableness-facet Trust. Thus, these items were omitted from the model. These modifications are not substantial and do not undermine the interpretation of the factors in the model. The model also included several well-known secondary relationships. Namely, anxiety (N) and depression (N) had negative loadings on extraversion, respectfulness (A) had a negative loading on Extraversion, Assertiveness (E) had a negatively loading on Agreeableness, Compassion (A) had a positive loading on N, and Productiveness (C) had a positive loading on E. Finally, there were 5 pairs of correlated residuals due to similar item content. The fit of this final model (final.final.6.bfi) was acceptable, CFI = .906, RMSEA = .045.Only two primary loadings on the 15 facet factors were less than .4, but still greater than .3.
I then combined the two models without making any modifications to either model. The only additional parameters were used to relate the two models to each other. One parameter regressed the general factor of the LPFS model on the evaluative bias factor in the BFI model. Another one did the same for the two response style factors. Modification indices suggested several additional relationships that were added to the model. The fit of the final model (final.final.6) was acceptable, CFI = .875, RMSEA = .032. Difficulties with goal setting (LPFS content factor 4) was strongly negatively related to the productivity facet of conscientiousness, r = -.81, and slightly positively related to the compassion facet of agreeableness, r = .178. The Emotionality factor (LPFS content factor 9) was strongly correlated with Neuroticism, r = .776. The first content factor was also strongly correlated with the depression facet of neuroticism, r = .72, and moderately negatively correlated with agreeableness, r = -.264. The need for approval factor (content factor 5) was also strongly corelated with neuroticism, r = .608, and moderately negatively related to the assertiveness facet of agreeableness, r = -.249. Content factor 2 (“close relationships) was moderately negatively related to the trust facet of agreeableness, r = -.408, and weakly negatively related to the assertiveness facet of extraversion, r = -.117. A focus on exchange relationships (content factor 3) was moderately negatively correlated with agreeableness, r = -.379. Finally, content factor 10 had a moderate correlation with extraversion. In addition, 14 LPFS items had small to moderate loadings on some Big Five factors. Only three items had loadings greater than .3, namely “my emotions rapidly shift around” on Neuroticism, r = .404, “Sometimes I’m not very cooperative because other people don’t live up to my standards” on Agreeableness, and “It seems as if most other people have their life together more than I” on the depression facet of Neuroticism, r = .310.
These relationships imply that some of the variance in LPFS scores can be predicted from the BFI factors, but the effect sizes are small. Neuroticism correlates only r = .123 and explains only 1.5% of the variance in LPFS total scores. Correlations are also weak for Extraversion, r = -.104, Agreeableness, r = -.096, and Conscientiousness, r = -.045. Thus, if the LPFS is a measure of core personality functioning, we would have to assume that core personality functioning is largely independent of variation along the Big Five factors of normal personality.
In contrast to these weak relationships, the evaluative bias factor in self-ratings of normal personality is strongly correlated with the general factor of the LPFS scored in terms of higher desirability, r = .901. Given the strong contribution of the general factor to LPFS scores, it is not surprising that the evaluative factor of the Big Five explains a large amount of the variance in LPFS scores, r = .748. In this case, it is not clear whether the correlation coefficient should be squared because evaluative bias in BFI ratings is not a pure measure of evaluative bias. A model with more than two measures of evaluative bias would be needed to quantify how much a general – questionnaire independent – evaluative bias factor contributes to LPFS scores. Nevertheless, the present results confirm that the evaluative factor in ratings of normal personality is strongly related to the evaluative factor in ratings of personality disorders (McCabe, Oltmanns, & Widiger, 2022).
Making Lemonade: A New Evaluative Bias Measure
My analyses provide clear evidence that most of the variance in LPFS scores reflects a general evaluative factor that corelates strongly with an evaluative factor in ratings of normal personality. In addition, the analyses showed that only some items in the LPFS are substantially related to normal personality. This implies that many LPFS items measure desirability without measuring normal personality. This provides an opportunity to develop a measure of evaluative bias that is independent of normal personality. This measure can be used to control for evaluative bias in self-ratings. A new measure of evaluative bias would be highly welcome (to avoid the pun desirable) because existing social desirability scales lack validity, in part because they confound bias and actual personality content.
To minimize the influence of acquiescence bias, I tried to find an equal number of direct and reverse coded items. I selected items with high loadings on the evaluative factor and low loadings on the LPFS content factors or the Big Five factors. This produced a 10-item scale with 6 negative and 4 positive items.
Almost no close relationship turns out well in the end.
I can’t even imagine living a life that I would find satisfying.
I don’t have many positive interactions with other people.
I have little understanding of how I feel or what I do.
I tend to let others set my goals for me, rather than come up with them on my own.
I’m not sure exactly what standards I’ve set for myself.
I can appreciate the viewpoint of other people even when I disagree with them.
I work on my close relationships, because they are important to me.
I’m very aware of the impact I’m having on other people.
I’ve got goals that are reasonable given my abilities.
I added these 10 items to the Big Five model and specified a social desirability factor and an acquiescence factor. This model (final.final.6.bfi.sd) had acceptable fit, CFI = .892, RMSEA = .043. Three items had weak (< .3) loadings on one of the Big Five factors, indicating that the SD items were mostly independent of actual Big Five content. Thus, SD scores are practically independent of variance in normal personality as measured with the BFI-2. The correlation between the evaluative factor and the SD factor was r = .877 and the correlation with the SD scale as r = .79. This finding suggests that it is possible to capture a large portion of the evaluative variance in self-ratings of personality with the new 10-item social desirability scale. Future research with other measures of evaluative bias (cf. Anusic et al., 2009) and multi-method assessment of personality is needed before this measure can be used to control for socially desirable responding.
Discussion
Morey (2017) introduced the Levels of Personality Functioning Scale (LPFS) as a self-report measure of general personality pathology, core personality functioning, or the severity of personality dysfunction. Hopewood et al. (2018) conducted a validation study of the LPFS and concluded that their results support the validity of the LPFS. More recently, Morey et al. (2022) reiterate the claim that the LPFS has demonstrated strong validity. However, several commentaries pointed out problems with these claims (Sleep & Lynam, 2022). Sleep and Lynam (2022) suggested that the “LPFS may be assessing little more than general distress” (p. 326). They also suggested that overlap between LPFS content and normal personality content is a problem. As shown here as well, some LPFS items relate to neuroticism, conscientiousness, or agreeableness. However, it is not clear why this is a problem. It would be rather odd if core personality functioning were unrelated to normal personality. Moreover, the fact that some items are related to Big Five factors does not imply that the LPFS measures little more than normal personality. The present results show that LPFS scores are only weakly related to the Big Five factors. The real problem is that LPFS scores are much more strongly related to the evaluative factor in normal personality ratings than to measures of distress such as neuroticism or its depression facet.
A major shortcoming in the debate among clinical researchers interested in personality disorder is the omission of research on the measurement of normal personality. Progress in the measurement of normal personality was made in the early 2000s. when some articles combined multi-method measurement with latent variable modeling (Anusic et al., 2009; Biesanz & West, 2004; deYoung, 2006). These studies show that the general evaluative factor is unique to individual raters. Thus, it lacks convergent validity as a measure of a personality trait that is reflected in observable behaviors. The high correlation between this factor and the general factor in measures of personality disorders provides further evidence that the factor is a rater-specific bias rather than an disposition to display symptoms of sever personality disorders because dysfunction of personality is visible in social situations.
One limitation of the present study is that it used only self-report data. The interpretation of the general factor in self-ratings of normal personality is based on previous validation studies with multiple raters, but it would be preferable to conduct a multi-method study of the LPFS. The main prediction is that the general factor in the LPFS should show low convergent validity across raters. One study with self and informant ratings of personality disorders provided initial evidence for this hypothesis, but structural equation modeling would be needed to quantify the amount of convergent validity in evaluative variance across raters (Quilty, Cosentino, & Bagby, 2018).
In conclusion, while it is too early to dismiss the presence of a general factor of personality disorders, the present results raise serious concerns about the construct validity of the Level of Personality Functioning Scale. While LPFS scores reflect a general factor, it is not clear that this general factor corresponds to a general disposition of personality functioning. First, conceptual analysis questions the construct of personality functioning. Second, empirical analysis show that the general factor correlates highly with evaluative bias in personality ratings. As a result, researchers interested in personality disorders need to rethink the concept of personality disorders, use a multi-method approach to the measurement of personality disorders, and develop measurement models that separate substantive variance from response artifacts. They also need to work more closely with personality researches because a viable theory of personality disorders has to be grounded in a theory of normal personality functioning.
References
Biesanz, J. C., & West, S. G. (2004). Towards Understanding Assessments of the Big Five: Multitrait-Multimethod Analyses of Convergent and Discriminant Validity Across Measurement Occasion and Type of Observer. Journal of Personality, 72(4), 845–876. https://doi.org/10.1111/j.0022-3506.2004.00282.x
Cronbach, L. J. (1989). Construct validation after thirty years. In R. L. Linn (Ed.), Intelligence: Measurement theory and public policy: Proceedings of a symposium in honor of Lloyd G. Humphreys (pp. 147–171). Urbana: University of Illinois Press.
Campbell, D. T., & Fiske, D. W. (1959). Convergent and discriminant validation by the multitrait-multimethod matrix. Psychological Bulletin, 56(2), 81–105. https://doi.org/10.1037/h0046016
Chang, L., Connelly, B. S., & Geeza, A. A. (2012). Separating method factors and higher order traits of the Big Five: A meta-analytic multitrait–multimethod approach. Journal of Personality and Social Psychology, 102(2), 408–426.
https://doi-org.myaccess.library.utoronto.ca/10.1037/a0025559
DeYoung, C. G. (2006). Higher-order factors of the Big Five in a multi-informant sample. Journal of Personality and Social Psychology, 91(6), 1138–1151. https://doi.org/10.1037/0022-3514.91.6.1138
Quilty, L. C., Cosentino, N., & Bagby, R. M. (2018). Response bias and the personality inventory for DSM-5: Contrasting self- and informant-report. Personality disorders, 9(4), 346–353. https://doi.org/10.1037/per0000246
Kim, H., Schimmack, U., & Oishi, S. (2012). Cultural differences in self- and other-evaluations and well-being: A study of European and Asian Canadians. Journal of Personality and Social Psychology, 102(4), 856–873. https://doi.org/10.1037/a0026803
Markus, K. A., & Borsboom, D. (2013). Frontiers of test validity theory: Measurement, causation, and meaning. Routledge/Taylor & Francis Group.
McCabe, G. A., Oltmanns, J. R., & Widiger, T. A. (2022). The General Factors of Personality Disorder, Psychopathology, and Personality. Journal of personality disorders, 36(2), 129–156. https://doi.org/10.1521/pedi_2021_35_530
Schimmack, U., & Kim, H. (2020). An integrated model of social psychological and personality psychological perspectives on personality and wellbeing. Journal of Research in Personality, 84, Article 103888. https://doi.org/10.1016/j.jrp.2019.103888
Sleep, C. E., & Lynam, D. R. (2022). The problems with Criterion A: A comment on Morey et al. (2022). Personality Disorders: Theory, Research, and Treatment, 13(4), 325–327. https://doi.org/10.1037/per0000585
Skodol, A.E. (2011), Scientific issues in the revision of personality disorders for DSM-5. Personality and Mental Health, 5: 97-111. https://doi.org/10.1002/pmh.161
Zimmermann, J. (2022). Beyond defending or abolishing Criterion A: Comment on Morey et al. (2022). Personality Disorders: Theory, Research, and Treatment, 13(4), 321–324. https://doi.org/10.1037/per0000561
I love your introduction, it may be best to place it as the opening paragraph because it is easier to relate? I do love the content though!