Abstract
Clinical psychologists have developed alternative models of personality disorders to the traditional model that was developed by psychiatrists in the 20th century. The new model aims to integrate modern research on normal personality with clinical observations of maladaptive traits. The alternative model aims to explain why specific personality disorders are related, which is called co-morbidity in the medical literature. Ringwald et al. (2022) tested this assumption with the Comprehensive Adaptive Test of Personality Disorders (CAT-PD). They fitted a model with six correlated factors to the covariance matrix among the 33 CAT-PD scales. Four of these six factors overlapped with Big Five factors. They concluded that their study supports “the validity of the CAT-PD for assessing multiple levels of the pathological trait hierarchy” I fitted a model of normal personality to the data. This model assumes that self-ratings of personality are influenced by 6 independent traits, the Big Five and a general evaluative factor called halo. I was able to identify all six factors in the CAT-PD, although additional relationships among the 33 scales were also present. I cross-validated this model and showed high (r > .8) correlations of the factors with factors in a Big Five questionnaire. I show that Big Five factors explain only a modest amount of variance in most CAT-PD scales. Based on these results, I conclude that these factors reflect normal variation in personality rather than a distinct level in a hierarchical model of pathological traits. Rather, the Big Five traits are normal traits that are risk factors for specific types of personality disorders, but extreme levels of a normal trait are normal and not pathological. Furthermore, a large portion of the variance in self-ratings of traits are method variance. Thus, valid assessment of personality disorders requires a multi-rater approach.
Introduction
The notion of personality disorders has a long history in psychiatry that is based on clinical observations and psychoanalytic theories. It is currently recognized that the old system to diagnose personality disorders is no longer compatible with modern theories of personality, but there is no consensus among clinical psychologists and psychiatrists about the definition and assessment of personality disorders. This confusing state of affairs is reflected in the presence of several competing conceptualizations of personality disorders in the Diagnostic and Statistical Model of Mental Disorders (DSM-5).
Simms et al. (2011) introduced the Computerized Adaptive Test of Personality Disorders (CAT-PD) as one potential model of personality disorders. The CAT-PD aims to measure 33 maladaptive personality traits (CAT-PD-SF). In this blog post, I take a critical look at the claim that the CAT-PD is capable of measuring personality disorders at varies levels in a hierarchical model of personality functioning (Ringwald, Emery, Khoo, Clark, Kotelnikova, Scalco, Watson, Wright, & Simms, 2022).
The notion of a hierarchy of disorders implies that the 33 dimensions of the CAT-PD measure distinct disorders, where more extreme levels on these dimensions indicate higher levels of personality dysfunction. Correlations among the scales measuring the 33 dimensions suggest that they share a common cause. This causes explain why some primary disorders covary (i.e., comorbidity in the terminology of categorical diagnoses). They may also reflect broader dimensions of disorders. Ringwald et al. (2022) used confirmatory factor analysis to test this hypothesis. They tested one model with five-factors and another model with 6-factors. The 6-factor model had better fit. Thus, I focus on the six factor model. The six factors are called Negative Affectivity, Detachment, Disinhibition, Antagonism, Psychoticism, and Anankastia.
Table 1 shows the CAT-PD scales with the highest loadings on these factors.
Table 1
Negative Affectivity: Anxious, Affect Lability
Detachment: Social Withdrawal, Anhedonia
Antagonism: Callousness, Domineering
Disinhibition: Non-Planfulness, Irresponsibility
Psychoticism: Unusual Experiences, Unusual Beliefs
Anankastia: Workaholism, Perfectionism
The CFA model imposed no restrictions on the correlations among the six factors and an inspection of the correlation matrix showed that the six factors are correlated to varying degrees (Table 2).

Although some of these correlations are moderate to strong, the results are consistent with the assumption that all six dimensions reflect different constructs (discriminant validity). The authors discuss the surprising finding that disinhibition (e.g., Non-Planfulness) and Anankastia (e.g., Perfectionism) appear as independent factors. This would suggest that some people have both disorders although they seem to be related to low and high conscientiousness, respectively. Correlations with an independent measure of conscientiousness shows that inhibition is negatively correlated with conscientiousness, r = -.64, but Anankastia was not positively correlated with conscientiousness, r = .11. There are two explanations for these results. One explanation is that there is a general factor of personality functioning that has a positive influence on all personality disorders, even if they seem to express themselves in seemingly opposite ways. That is, general functioning increases the risk of being irresponsible and perfectionistic. An alternative explanation is that self-reports of personality disorders are influenced by the same response styles that influence self-ratings of normal personality (Anusic et al., 2009). Either interpretation implies that a general factor contributes to the pattern of correlations among the CAT-33 scales. The authors discuss this issue in their limitation section.
“A challenge facing modeling bipolar factors is the shared impairment that generally creates positive manifolds in the correlations among maladaptive scales. This can be circumvented with separate modeling of impairment in a distress or dysfunction factor, as has long been done in the IIP-SC (Alden et al., 1990) but has not been attempted in any comprehensive way in a published five- or six-factor pathological trait inventory.” (p. 26)
It is not clear why the authors did not fit this model to their data. I pursued this avenue of future research based on measurement models of normal personality. Accordingly, it is possible to distinguish a general evaluative factor (halo) that produces positive correlations among desirable traits and the Big Five as largely independent factors. I refer to this model as the Halo-Big-Five model. Four of the Big Five factors are closely related, if not identical, with four of the CAT-PD factors, namely Neuroticism corresponds to Negative Affectivity, Detachment corresponds to Introversion (low Extraversion), Antagonism corresponds to low Agreeableness, and Disinhibition corresponds to low Conscientiousness. Openness is not strongly related to personality disorder, but the item content of the Fantasy Proneness scale (e.g., I sometimes get lost in daydreams) and the Peculiarity scale (“I am considered to be eccentric”) might be related to Openness. Furthermore, the correlation between the two scales was high, r = .588. This was the highest correlation for both items, except for equally high correlations with the Cognitive Problems scale (e.g., “I often space out and lose track of what’s going on.”, r = .64, .57. Thus, these items were used as makers of an Openness to Experience factor. Modification indices were used to allow for additional loadings on these predefined theoretical factors, but model fit remained lower than the fit of the 6-factor model, suggesting additional factors were present. I split the dataset into random halves and created a model that generalized across the two halves. The model is a lot simpler than the six-factor model (405 vs. 345 degrees of freedom) because it did not use free parameters for theoretically unimportant and small parameters. This explains why the model has superior fit to the 6-factor model for fit indices that take simplicity into account.
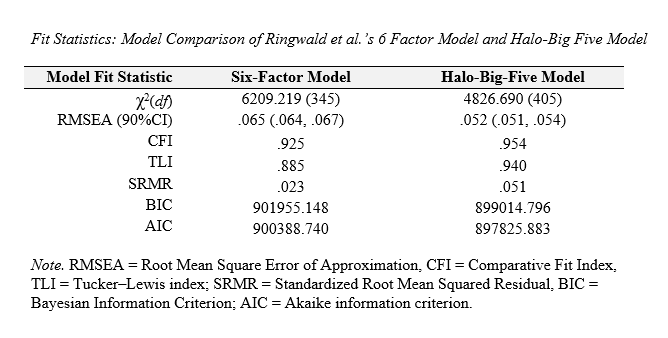
The main limitation is the lack of empirical evidence that factors correspond to the same factors that can be found with self-ratings of normal personality traits. To examine this question, I used a dataset (osf.io/v2s8u) that included ratings of normal personality on the Big-Five Inventory-2 and ratings on the Levels of Personality Functioning scale s (Hopwood et al., 2018). I first fitted the halo-Big Five model to the covariances among the 33 CAT-PD scales. Overall model fit was lower, indicating some differences between the datasets, but overall model fit was acceptable, CFI = .939, RMSEA = .060. All parameters were replicated with alpha = .05 as being statistically significant. Thus, the model shows some generalizability across datasets. Then I combined this model with a prior model of the Big Five and a Level of Personality Functioning factor (Schimmack, 2022). Given the large number of items, I further simplified the model by using the BFI-2 facet scales as indicators for the Big Five factors. This reduced the number of normal personality variables from 60 items to 15 scales. This model had acceptable fit, CFI = .902, RMSEA = .066.
I combined this model with the CAT-PD model by allowing the general factors and the corresponding Big Five traits to correlate. In addition, I allowed for correlated residuals between facets and related CAT-PD scales. For example, I allowed for unique relations between the Depressiveness facet in the BDF-I and the Depression scale of the CAT-PD. The combined model retrained acceptable fit, CFI = .892, RMSEA = .058. The key finding was that the CAT-PD factors were highly correlated with the BFI-2 factors and the general CAT-PD factor was highly correlated with the LPFS factor (Table 3).
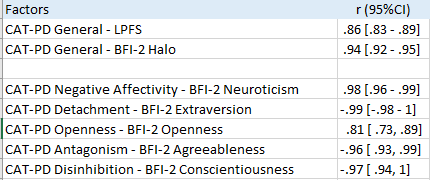
These results provide empirical evidence for the interpretation of the CAT-PD factors as the Big-Five factors of normal personality As a result, it is possible to describe the variance in CAT-PD scales as a function of variation in (a) a general factor that reflects desirability of a trait, (b) variance that is explained by variation in normal personality, and (c) residual variance that may reflect maladaptive expressions of normal personality. Table 4 shows how much these different factors contribute to variance in the 33 CAT-PD scales.

The general factor makes a strong contribution for most CAT-33 scales. 21 of the 33 effect sizes are larger than .6 (36% explained variance), and only 4 effect sizes are below .4 (16% explained variance), namely Exhibitionism, .33, Romantic Disinterest, .28, Perfectionism, .37, and Workaholism, .32. In comparison, the effect sizes for the Big Five traits are more moderate. Only 3 effect sizes are above .6, namely Anxiousness (N, .60), Exhibitionism (E, .68), and Social Withdrawal (E, -.66). As a result, most CAT-PD scales have a substantial amount of unique variance that is not explained by the general or the Big Five factors. 19 of the 33 effect sizes were above .6 (36%) explained variance, and not a single effect size was below .4 (16% explained variance). Although these effect sizes may be inflated by random and systematic measurement error, the results suggest that the constructs that are measured with the CAT-33 scales are related, but not identical to factors that produce variation in normal personality.
Discussion
Normal Personality Factors and Maladaptive Personality Traits
Correlations of personality measures with other measures provide valuable information about the construct validity of personality measures (Cronbach & Meehl, 1955; Schimmack, 2021). Unfortunately, there are no generally accepted psychometric standards to evaluate construct validity. Ringwald et al. (2022) claim that their results provide evidence of construct validity and evidence that the CAT-PD can be used to measure personality pathology at multiple levels of a hierarchy. I think this conclusion is premature and ignores key steps in a program of validation research. First, construct validation requires a clear definition of a construct that is the target of psychological measurement. After all, it is impossible to evaluate whether a measure measures an intended construct, if the construct is not properly defined. Moreover, the CAT-PD has 33 scales and each scale is intended to measure a distinct construct. Thus, construct validation of the CAT-PD requires clear definitions of 33 constructs. The concepts are well-defined, but it is questionable that all of these constructs can be considered disorders (CAT-PD Manual). For example, the Domineering scale is intended to measure “a general need for power and the tendency to be controlling, dominant, and forceful in interpersonal relationships” and the Submissiveness scale is intended to measure “the yielding of power to others, over-accommodation of others’ needs and wishes, exploitation by others, and lack of self-confidence
in decision-making, often to the extent that one’s own needs are ignored, minimized, or undermined.” The labeling of these scales as measures of personality pathology implies that variation along these dimensions is pathological and that the scales are valid measures of actual behavioral tendencies that cause intrapersonal or interpersonal problems for individuals who score high on these scales. As the CAT-PD is a relatively novel questionnaire, there is insufficient evidence to show that the CAT-PD scales assess pathology rather than normal variation in personality. An even bigger problem is the claim that the CAT-PD can be used to measure multiple levels in a hierarchy of personality disorders. The first problem is the assumption that disorders have a hierarchical structure. It would be difficult to understand the notion of a hierarchy for physical disorders. Let’s take cancer as an example (Fowler et al., 2020). Cancers are distinguished by their location such as lung cancer, breast cancer, brain cancer and so on. As cancer can spread some patients may have more than one cancer (i.e., cancer in multiple locations). While some cancers are more likely to co-occur, nobody has proposed a hierarchy of cancers, in which known or unknown causes of co-morbidity are considered a disorder. In probabilistic models it is also problematic to call all causes of a disorder a disorder. For example, not having sickle cell anemia is a risk factor for malaria infection, but it would be questionable at best to call normal blood cells a disorder.
I demonstrated that the Big Five factors explain some, but not all, of the correlations among the CAT-PD scales. Ringwald et al.’s factor model is similar and the authors come to a similar conclusion that four of their six factors correspond to four of the Big Five scales. They even claim that there is convergent validity between measures of the Big Five and the CAT-PD factors. The problem is that convergent validity implies that two measures measure the same construct (Campbell & Fiske, 1959). However, the Big Five factors are used to describe the correlations among traits that describe normal variation in personality. In contrast, Ringwald et al. (2022) claim that their factors reflect a level in a hierarchy of personality pathology. Unless we pathologize normal personality or normalize pathology, these are different constructs. Thus, high correlations between Big Five factors and CAT-PD factors do not show convergent validity. Rather they show a lack of discriminant validity (Campbell & Fiske, 1959). There is, however, a simple way to reconcile the notion of personality disorders with the finding that Big Five factors are related to measures of personality disorders. It is possible to consider the Big Five factors as risk factors for specific personality disorders. For example, high agreeableness may be a risk factor for dysfunctional forms of submissiveness and low agreeableness could be a risk factor for dysfunctional forms of dominance. Importantly, high or low agreeableness alone is not sufficient to be considered a disorder. This model is consistent with the substantial amount of variance in CAT-PD scales that is not explained by variation in normal personality. The key difference between this model and Ringwald’et al’s model is that covariance among CAT-PD scales does not reflect a broader disorder, but normal variation in personality. One advantage of this model is that it can explain the weak correlations between Big Five traits, with the exception of Neuroticism, and well-being (Schimmack, 2022). If the Big Five were broader pathological traits, we should expect that they lower quality of life. It is more likely that personality traits are risk factors, but that the actual manifestation of a disorder lowers well–being. This model predicts that the unique variance in CAT-PD scales is related to lower well-being and mental health problems. This needs to be examined in future studies.
General Factor
The other main finding was that a general factor explains a large amount of variance in many CAT-PD scales and that this factor is strongly correlated with the halo factor in self-ratings of normal personality. Some researchers interpret this factor as a substantive factor, whereas others view it as a response artifact. The present findings create some problems for the interpretation of this general factor that produces co-morbidity among personality disorders because it is related to opposing disorders. Taking Domineering and Submissiveness as an example, the general factor is positively related to Domineering, .65, and Submissiveness, .61. it is unclear, how a substantial trait could make somebody dominant and forceful in interpersonal relationships and over-accommodating of others’ needs. A more plausible explanation is that some respondents respond to the negative description of these traits and present themselves in an overly positive manner. This is consistent with multi-rater studies of normal personality that show low correlations for the general factors of different raters (Anusic et al., 2009; Biesanz & West, 2004; DeYoung, 2006). Similar studies with measures of personality disorders are lacking. Markon, Quilty, Bagby, and Krueger compared self-ratings and informant ratings and found moderate agreement. However, the sources of disagreement remained unknown. A multi-trait-multi-rater analysis of these data could reveal the amount of rater-agreement for the general factor in PD ratings.
Conclusion
I presented evidence that the halo-Big-Five model fits self-ratings of normal personality and ratings of personality disorders and that the corresponding factors are very highly (r > .8) correlated with each other. This finding raises concerns about hierarchical models of personality disorders. I present an alternative model that considers normal personality as a risk factor for specific personality disorders and the halo factor as a rating bias in self-ratings. Future research needs to go beyond self-ratings to separate substance from style. Furthermore, indicators of mental health and well-being are needed to distinguish normal personality from personality disorders.
1 thought on “Validity of the Computerized Adaptive Test of Personality Disorders (CAT-PD)”