Since 2011, it is an open secret that many published results in psychology journals do not replicate. The replicability of published results is particularly low in social psychology (Open Science Collaboration, 2015).
A key reason for low replicability is that researchers are rewarded for publishing as many articles as possible without concerns about the replicability of the published findings. This incentive structure is maintained by journal editors, review panels of granting agencies, and hiring and promotion committees at universities.
To change the incentive structure, I developed the Replicability Index, a blog that critically examined the replicability, credibility, and integrity of psychological science. In 2016, I created the first replicability rankings of psychology departments (Schimmack, 2016). Based on scientific criticisms of these methods, I have improved the selection process of articles to be used in departmental reviews.
1. I am using Web of Science to obtain lists of published articles from individual authors (Schimmack, 2022). This method minimizes the chance that articles that do not belong to an author are included in a replicability analysis. It also allows me to classify researchers into areas based on the frequency of publications in specialized journals. Currently, I cannot evaluate neuroscience research. So, the rankings are limited to cognitive, social, developmental, clinical, and applied psychologists.
2. I am using department’s websites to identify researchers that belong to the psychology department. This eliminates articles that are from other departments.
3. I am only using tenured, active professors. This eliminates emeritus professors from the evaluation of departments. I am not including assistant professors because the published results might negatively impact their chances to get tenure. Another reason is that they often do not have enough publications at their current university to produce meaningful results.
Like all empirical research, the present results rely on a number of assumptions and have some limitations. The main limitations are that
(a) only results that were found in an automatic search are included
(b) only results published in 120 journals are included (see list of journals)
(c) published significant results (p < .05) may not be a representative sample of all significant results
(d) point estimates are imprecise and can vary based on sampling error alone.
These limitations do not invalidate the results. Large difference in replicability estimates are likely to predict real differences in success rates of actual replication studies (Schimmack, 2022).
Princeton University
I used the department website to find core members of the psychology department. I found 24 professors and 4 associate professors. I used Web of Science to download references related to the authors name and initial. An r-script searched for related publications in the database of publications in 120 psychology journals.
Not all researchers conduct quantitative research and report test statistics in their result sections. Therefore, the analysis is limited to 17 faculty members that had at least 100 test statistics. This criterion eliminated many faculty members who publish predominantly in neuroscience journals.
Figure 1 shows the z-curve for all 6,199 tests statistics. I use the Figure to explain how a z-curve analysis provides information about replicability and other useful meta-statistics.
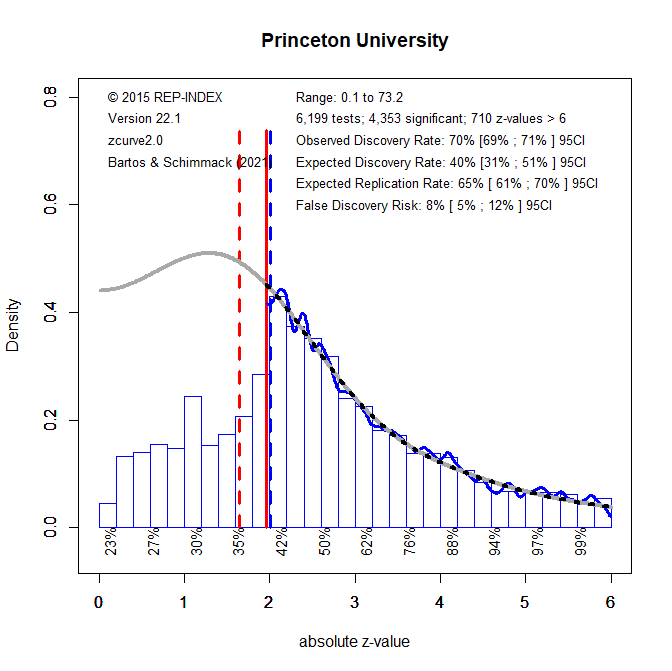
1. All test-statistics are converted into absolute z-scores as a common metric of the strength of evidence (effect size over sampling error) against the null-hypothesis (typically H0 = no effect). A z-curve plot is a histogram of absolute z-scores in the range from 0 to 6. The 710 z-scores greater than 6 are not shown because z-scores of this magnitude are extremely unlikely to occur when the null-hypothesis is true (particle physics uses z > 5 for significance). Although they are not shown, they are included in the computation of the meta-statistics.
2. Visual inspection of the histogram shows a steep drop in frequencies at z = 1.96 (solid red line) that corresponds to the standard criterion for statistical significance, p = .05 (two-tailed). This shows that published results are selected for significance. The dashed red line shows significance for p < .10, which is often used for marginal significance. Thus, there are more results that are presented as significant than the .05 criterion suggests.
3. To quantify the amount of selection bias, z-curve fits a statistical model to the distribution of statistically significant results (z > 1.96). The grey curve shows the predicted values for the observed significant results and the unobserved non-significant results. The statistically significant results (including z > 6) make up 40% of the total area under the grey curve. This is called the expected discovery rate because the results provide an estimate of the percentage of significant results that researchers actually obtain in their statistical analyses. In comparison, the percentage of significant results (including z > 6) includes 70% of the published results. This percentage is called the observed discovery rate, which is the rate of significant results in published journal articles. The difference between a 70% ODR and a 401% EDR provides an estimate of the extent of selection for significance. The difference of~ 30 percentage points is large, but one of the smallest difference for investigations of psychology departments. The upper level of the 95% confidence interval for the EDR is 51%. Thus, the discrepancy is not just random. To put this result in context, it is possible to compare it to the average for 120 psychology journals in 2010 (Schimmack, 2022). The ODR (70% vs. 72%) is similar, but the EDR is higher (40% vs. 28%). Although this difference is not statistically significant, it suggests that the typical study at Princeton has slightly more power than studies in psychology in general.
4. The z-curve model also estimates the average power of the subset of studies with significant results (p < .05, two-tailed). This estimate is called the expected replication rate (ERR) because it predicts the percentage of significant results that are expected if the same analyses were repeated in exact replication studies with the same sample sizes. The ERR of 65% suggests a fairly high replication rate. The problem is that actual replication rates are lower than the ERR predictions (about 40% Open Science Collaboration, 2015). The main reason is that it is impossible to conduct exact replication studies and that selection for significance will lead to a regression to the mean when replication studies are not exact. Thus, the ERR represents the best case scenario that is unrealistic. In contrast, the EDR represents the worst case scenario in which selection for significance does not select more powerful studies and the success rate of replication studies is not different from the success rate of original studies. To predict the success rate of actual replication studies, I am using the average of the EDR and ERR, which is called the actual replication prediction (ARP). For Princeton, the ARP is (65 + 40)/2 = 52.5%. This is somewhat higher than the currently best estimate of the success rate for actual replication studies based on the Open Science Collaboration project (~40%). Thus, research from Columbia University is expected to replicate at a slightly higher rate than studies in psychology in general.
5. The EDR can be used to estimate the risk that published results are false positives (i.e., a statistically significant result when H0 is true), using Soric’s (1989) formula for the maximum false discovery rate. An EDR of 40% implies that no more than 8% of the significant results are false positives, but the lower limit of the 95%CI of the EDR, 31%, allows for 12% false positive results. To lower the risk of a false positive result, it is possible to reduce the significance threshold to alpha = .005 (Benjamin et al., 2017). Figure 2 shows that implications of this new criterion (z = 2.8). The false positive risk is now 2% and even the upper limit of the 95% confidence interval is only 3%. Thus, without any further information readers could use this criterion to interpret results published in articles by psychology researchers at Princeton.

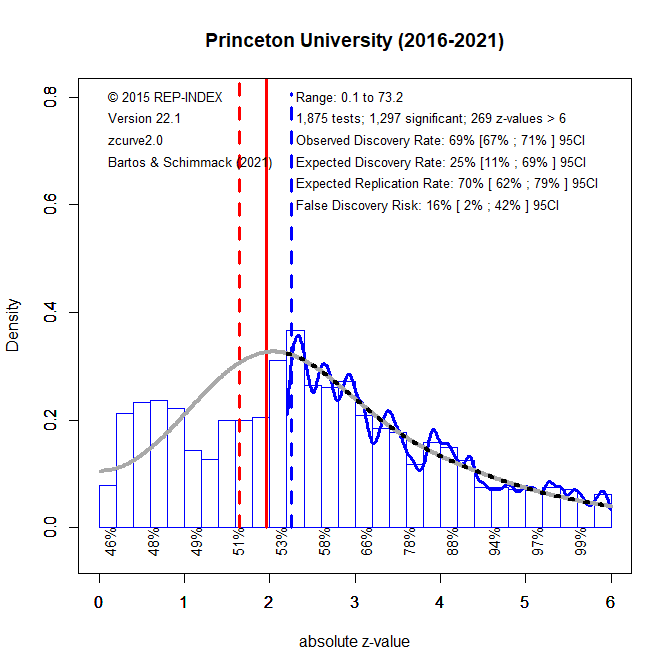
Some researchers have changed research practices in response to the replication crisis. It is therefore interesting to examine whether replicability of newer research has improved. To examine this question, I performed a z-curve analysis for articles published in the past five year (2016-2021).

The point estimate of the EDR increased from 40% to 61%, but due to the relatively small number of observations this change is not statistically significant. It is also problematic that z-curve plot shows a higher frequency of z-scores between 2.2 and 2.4 rather than 2.0 and 2.2. While there are many reasons for this finding, one explanation could be that some researchers use a new criterion value for selection. Rather than publishing any p-value below .05, they may only publish p-values below .02, for example. This practice would bias the z-curve estimates that assume no further selection effects once a p-value is below .05.
The next figure shows the results for an analysis that excludes z-scores between 2 and 2.2 from the analysis. The main finding is that the EDR estimate drops from 61% to 25%. As a result, the FDR estimate increases from 3% to 16%. Thus, it is too early to conclude that Princeton’s research has become notably more replicable, and I would personally continue to use alpha = .005 to reject null-hypotheses.
10 of the 17 faculty members with useful data were classified as social psychologists. The following analysis is limited to the z-scores of these 10 faculty members to examine whether social psychological research is less replicable (Open Science Collaboration, 2015).
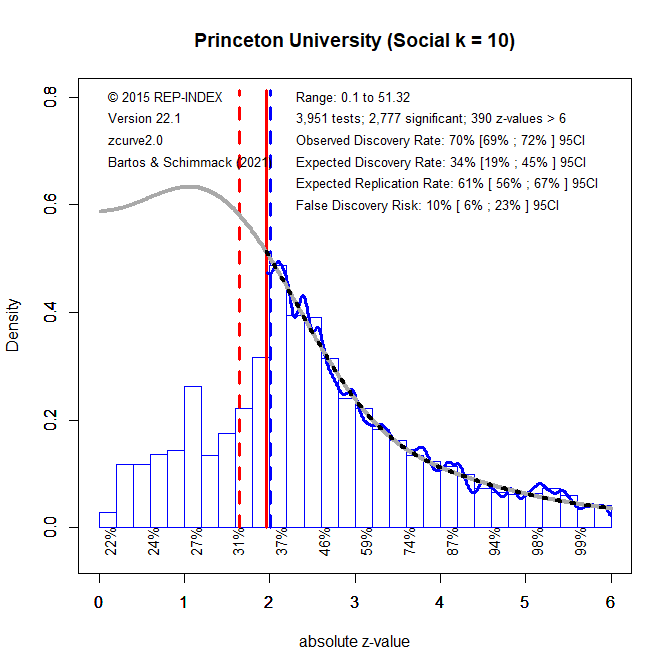
The EDR is slightly, but not significantly, lower, but still higher than the EDR of other departments. Thus, there is no evidence to suggest that social psychology at Princeton is less replicable than research in other areas. Other areas did not have sufficient test statistics for a meaningful analysis.
There is considerable variability across individual researchers, although confidence intervals are often wide due to the smaller number of test statistics. The table below shows the meta-statistics of all faculty members that provided results for the departmental z-curve. You can see the z-curve for individual faculty member by clicking on their name.
| Rank | Name | ARP | EDR | ERR | FDR |
| 1 | Uri Hasson | 82 | 83 | 81 | 1 |
| 2 | Kenneth A. Norman | 73 | 75 | 71 | 2 |
| 3 | Jordan A. Taylor | 68 | 77 | 60 | 4 |
| 4 | Elke U. Weber | 66 | 70 | 63 | 3 |
| 5 | Tania Lombrozo | 65 | 73 | 58 | 4 |
| 6 | Diana I. Tamir | 59 | 69 | 50 | 5 |
| 7 | Yael Niv | 58 | 68 | 47 | 6 |
| 8 | Emily Pronin | 51 | 68 | 34 | 10 |
| 9 | Jonathan D. Cohen | 50 | 76 | 23 | 17 |
| 10 | Alin Coman | 49 | 57 | 40 | 8 |
| 11 | Molly J. Crockett | 49 | 75 | 23 | 17 |
| 12 | J. Nicole Shelton | 47 | 55 | 39 | 8 |
| 13 | Susan T. Fiske | 46 | 70 | 22 | 19 |
| 14 | Stacey Sinclair | 40 | 49 | 31 | 12 |
| 15 | Eldar Shafir | 35 | 55 | 14 | 31 |
| 16 | Deborah A. Prentice | 33 | 55 | 11 | 44 |
| 17 | Joel Cooper | 28 | 44 | 12 | 39 |