The concept of personality disorders has its roots in psychiatry. Wikipedia provides a clear definition of personality disorders.
Personality disorders (PD) are a class of mental disorders characterized by enduring maladaptive patterns of behavior, cognition, and inner experience, exhibited across many contexts and deviating from those accepted by the individual’s culture.
The definition of personality disorders shares many features with definitions of normal personality traits. Personality traits are enduring dispositions that produce cross-situational and cross-temporal consistency in behaviors, cognitions, and emotions. The key difference between personality disorders and personality traits is that personality disordered traits are assumed to be maladaptive, unhealthy, or deviant from societal and cultural norms.
The history of psychiatry and psychology shows how problematic it can be when a profession is allowed to define mental disorders, especially when they are defined as deviance from social norms. The fist Diagnostic Manual of the American Psychiatric Association included homosexuality as a mental disorder (wikipedia). This is now recognized as a mistake, and social progress aims to be more inclusive towards individuals who deviate from traditional cultural norms.
Progressive forces are also trying to change social norms regarding body types, skin color, and many other attributes that vary across individuals. However, some psychologists are working towards a comprehensive system of personality disorders that may create new stigmas for individuals with deviant personality traits. This is a dangerous trend that has not received enough attention. To be maladaptive, a personality trait should have clear negative effects on individuals’ health and well-being. This requires extensive validation research and careful examination of measures that could be used to diagnose personality disorders. For example, the CATP-PD project identified 33 distinct personality disorders (Simms et al., 2011), ranging from Anhedonia to Withdrawn personality disorder.
To study personality disorders, personality disorder researchers developed questionnaires that can be used to diagnose personality disorders. Studies with these measures showed that responses to items on personality disorder questionnaires are often strongly correlated with responses to items on measures of normal personality traits (Wright & Simmons, 2014). This raises concerns about the discriminant validity of measures that are designed to assess personality disorders. For example, normal measures of personality measure individual differences in trust. Some individuals are more trusting than others. Trust or distrust can be advantageous in different contexts. However, the CAT-PD includes a measure of mistrust as one of 33 personality disorders. The challenge for theories of personality disorders is to demonstrate that the mistrust scale does not merely measure normal variation in trust, but identifies maladaptive forms or levels of low trust. This leads to two statistical criteria that a valid measure of personality disorders should fulfill. First, variation in the personality disorder measure should be distinct from variation in normal personality. Second, the unique variance in the measure of personality disorders should predict symptoms of adaptation failures. As the key criterion for a mental disorder is suffering, maladaptive personality traits should predict lower well-being (e.g., internalizing or externalizing symptoms, lower life-satisfaction).
Another threat to the validity of personality disorder measures is that self-ratings are often influenced by the desirability of items. This response bias has been called halo bias, socially desirable responding, other-deception, faking, or self-enhancement. Ample evidence shows that self-ratings are influenced by halo bias. The strongest evidence for the presence of halo bias comes from multi-rater studies and studies that compare self-ratings to objective measures (Anusic et al., 2009). For example, whereas intelligence and attractiveness are practically uncorrelated, self-ratings show a positive correlation because some individuals exaggerate their attractiveness and intelligence. Halo bias also influences self-ratings of normal personality traits and well-being. As most personality disorder items are highly evaluative, it is likely that self-ratings of personality disorders are also contaminated by halo bias. Studies with self-ratings and informant ratings also suggest that self-ratings of personality disorders are distorted by response styles (Quilty, Cosentino, & Bagby, 2018). This could mean that honest responders are misdiagnosed as having a personality disorders, whereas self-enhancers are falsely diagnosed as not having a personality disorder.
To explore the validity of the CATP-PD scales as measures of personality disorders, I reanalyzed the data from Wright and Simms (2014) article. The dataset consists of ratings on the 30 facets of Costa and McCrae’s model of normal personality, the 33 scales of the CAT-PD, and another measure of personality disorders, the PID-5. The scale scores were subjected to an exploratory factor analysis with five factors. The factors were labeled Antagonism (Manipulativeness .71, Straightforwardness -70), Negative Affectivity (Anger .71, Trust -.52), Disinhibition (Irresponsibility .75, Self-Discipline -87), Detachment (Emotional Detachment .65, Positive Emotions -.59), and Psychoticism (Unusual Beliefs, .76, no strong negative loading). This model suggests that higher order factors of normal personality and personality disorders overlap. However, this model should not be taken too seriously because it has relatively low fit. There are several reasons for this low fit. First, exploratory factor analysis (EFA) often confounds substantive factors and method factors. Confirmatory factor analysis is often needed to separate method variance from substantive variance. Second, EFA cannot represent hierarchical structures in data. This is a problem because the Big Five are higher-order factors of basic personality traits called facets. it is possible that the 33 personality disorder scales are related to normal personality at both of these levels, but factor analysis assumes that all correlations are produced by shared variance with the higher-order Big Five factors. Finally, EFA does not allow for residual correlations among Big Five facets or personality disorder scales. All of these problems explain why an EFA model fails to fit the observed correlation matrix.
To provide a better test of the validity of the CATP-PD scales as measures of personality disorders, I performed a confirmatory factor analysis (CFA). CFA is a statistical tool. The name suggests that it can only be used for confirmatory analysis, but this is not true. CFA can also be used to explore models and then confirm these models in new datasets. It is not possible to use EFA for exploration because its limitations make it impossible to find a fitting model that could be subjected to a confirmatory test. As I have only one dataset, the results are exploratory and require confirmation with new data.
Exploratory Factor Analysis
Wright and Simms (2014) did not report standard fit statistics for their EFA model. Also, I limited the analysis to the (normal) personality scales and the CAT-PD scales. Thus, I ran an EFA with five factors to obtain fit indices that can be compared to those of the CFA model, chi2 (1,648) = 3993.93, CFI = .786, RMSEA = .048, SRMR = .071, AIC = 71,534.36, BIC = 73,449.10. While the RMSEA is below the standard criterion value of .06, CFI is well below the criterion value of .95. However, these criterion values are only suggestive. More important is the comparison of alternative models. A better model should have better fit to the data, especially for fit indices that reward parsimony (CFI, RMSEA, AIC, BIC).
Confirmatory Factor Analysis
The final model was constructed in several steps starting with the model for normal personality. The theoretical model assumes six independent factors, the Big Five and a halo factor. Primary loadings of the 30 facets on the Big Five were specified according to Costa and McCrae’s theory and free. Loadings on the halo factors were initially constrained to 1, but freed in the final model. Secondary loadings were added if modification indices were greater than 20 and if they were interpretable. Finally, residual correlations were added if modification indices were above 20. The final Big Five plus Halo model (B5+H) had good fit, chi2 (314) = 556.89, CFI = .951, RMSEA = .045, SRMR = .059, AIC = 54763.01, BIC = 55,354.43. This finding already shows a problem with the 5-factor EFA solution. The EFA model failed to identify a separate openness factor, even though openness is clearly present in the data.
I then explored how the 33 CAT-PD scales are related to the 36 personality predictors; that is, the 30 facets, the Big Five, and the halo factor. I always allowed for halo effects, even if they were not significant, but I only used significant (p < .01) personality predictors. After these exploratory analysis, I fitted a model with all 33 CAT-PD scales. This required modeling relationships among CAT-PD scales that are not explained by the personality predictors (residual relationships). This led me to specify a CAT-PD method factor that resembles the fifth factor in the EFA model. The final model did not have any modification indices greater than 20.
The final model had about the same number of parameters (1,651 vs. 1,648 degrees of freedom), but the CFA model had better fit, chi2 (1,651) = 3145.88, CFI = .866, RMSEA = .038, SRMR = .069, AIC = 70,514.85, BIC = 72,416.26.
The key results are summarized in Table 1. It shows the loadings of the 33 CAT-PD scales on the seven factors. The CAT-PD scales are sorted in order of their primary loadings. The excel file can be downloaded here (results).
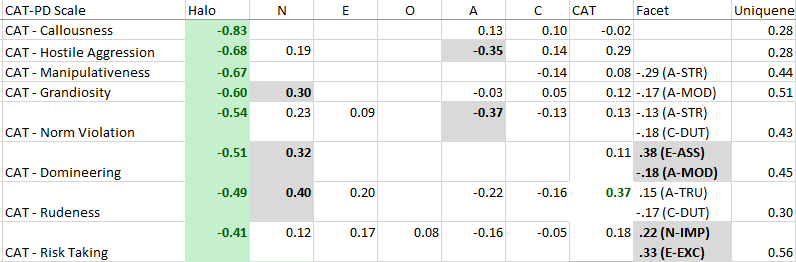
Eight scales had their primary loading on the Halo (evaluative) factor. Some of these loadings were very strong. For example, halo explained more than 50% of the variance in callousness scores (-.83^2 = 69%). In contrast, relationships to the five factors of normal personality were relatively weak. Only five loadings exceeded a value of .3 (9% explained variance). The strongest relationship was the loading of domineering on neuroticism (.40^2 = 16%). These scales also showed no notable loadings on the CAT factor that reflects shared variance among CAT scales. Some scales had additional relationships with specific facets of normal variation in personality. Most notably, domineering was predicted by the unique variance in assertiveness, .38^2 = .14%.
It is difficult to reconcile these findings with the conceptualization of these CAT scales as measures of maladaptive personality variation. The primary loadings on the halo factor will produce correlations with measures of adaptation that also rely on self-ratings that are influenced by halo bias (e.g., life satisfaction), but it is doubtful that these scales could predict maladaptive outcomes that are measured with independent measures. Scales that are related to neuroticism are expected to show negative relationships with measures of well-being, but it is not clear that they would predict unique variance after controlling for the known effects of neuroticism, especially the depressiveness facet of neuroticism.
My predictions about the relationship of these CAT scales and measures of well-being need to be tested with actual data, but the present findings show that studies that rely exclusively on self-ratings can be biased if the influence of halo bias on self-ratings is ignored.
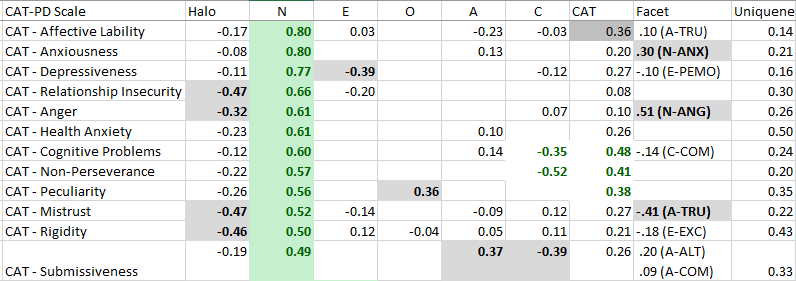
The next 12 scales have their primary loading on the neuroticism factor of variation in normal personality. Some of these loadings are very high. For example, neuroticism explains .80^2 = 64% of the variance in scores on the Affective Lability scale. It is well-known that high levels of neuroticism are a risk-factor for mood disorders, especially during times of high stress. It can be debated whether this makes high neuroticism a personality disorders. Alternatively, the diathesis-stress model would argue that neuroticism is a disposition that only becomes maladaptive in combination with environmental factors. However, even if neuroticism were considered a personality disorder, it is not clear whether the 12 CAT-PD scales with primary loadings on neuroticism add to our understanding of mental health problems and mood disorders. An alternative perspective is that the CAT-PD scales merely reflect different manifestations of mood disorders. This could be tested by examining how scores on these scales respond to treatment of mood disorders. It is also noteworthy that the CAT-PD failed to identify personality disorders that are related to maladaptive low levels of negative affect. Especially, the absence of negative emotions that can inhibit behaviors such as guilt or anxiety could be maladaptive.
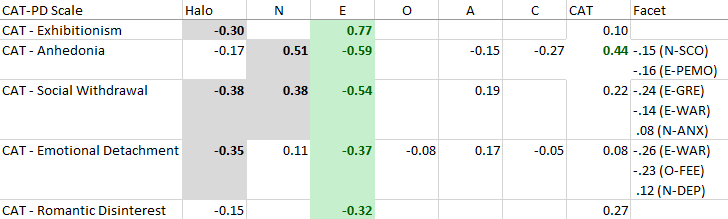
Five CAT-PD scales had their primary loading on the extraversion factor of normal personality. Exhibitionism was the only scale with a positive loading. The loading was high and suggested that Extraversion explained 59% of the variance. Studies of extraversion and well-being typically show that higher levels of extraversion predict higher well-being. This suggests that any maladaptive effects of exhibitionism are related to the remaining unexplained variance. Thus, it is questionable that high levels of extraversion should be considered a personality disorder.
Anhedonia and Social withdrawal are related to low Extraversion. As for CAT-PD scales related to neuroticism, it is not clear that these scales add something to our understanding of personality and mental health. Introversion itself may not be considered maladaptive. Rather, introversion may be a disposition that is only maladaptive under specific circumstances. Furthermore, causality may be reversed. Treatment of mood disorders with medication increases extraversion scores.
Extraversion explains only 10% of the variance in romantic disinterest. Thus, this scale is hardly related to variation in normal personality. Moreover, it is not clear why opposite tendencies such as hypersexuality are missing.
None of the 33 CAT-PD scales have a primary loading on Openness. This is surprising because high Openness is sometimes associated with both being a genius and being detached from reality. In any case, there is no evidence to suggest that normal variation in Openness is maladaptive.
Even more surprising is the finding that none of the 33 CAT-PD scales have their primary loadings on agreeableness. The main reasons is that disagreeableness scales are strongly influenced by socially desirable responding. Thus, more effort needs to be made to measure these constructs without halo bias. Informant ratings might be useful to obtain better measures of these constructs.
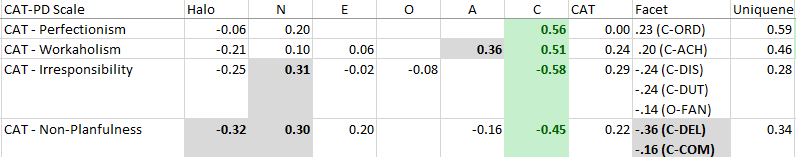
Four CAT-PD scales have their primary loadings on conscientiousness. Two had positive loadings, namely Perfectionism (.56^2 = 31%) explained variance and workaholism (.51^2 = 26% explained variance). It is not clear that this justifies considering high conscientiousness a personality disorder. Rather, high conscientiousness could be a risk factor that is only maladaptive in specific environments or it could reflect disorders that express themselves in different ways for individuals with different personality traits. For example, workaholism might be a specific maladaptive way to cope with negative affect that is not different from alcoholism or other addictions.
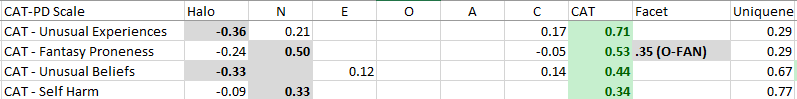
The last four CAT-PD scales have their primary loadings on the CAT-scale specific factor. Thus, they do not show strong overlap with normal personality. The high loading for unusual experiences might tap into cognitive symptoms related to psychoticism. Self-harm shows weak loadings on all factors and it is not clear that it measures a personality trait rather than a symptom of distress.
In conclusion, these results provide little support for the hypothesis that there is a large number of personality disorders. The main link between models of normal variation in personality and personality disorder scales is neuroticism. It is well-known that high levels of neuroticism predict lower well-being and are risk-factors for mood disorders. However, the remaining variation in personality is not consistently related to proposed measures of personality disorders.
Comparing the Results to the EFA Results
The better fitting 7-factor CFA model differs notably from the 5-factor EFA model in the original publication. The EFA model identified a single factor called Antagonism. This factor blends the halo factor and the Agreeableness factor of normal personality. As shown in the CFA model, CAT-PD scales load on the halo factor, whereas less evaluative scales of normal personality reflect Agreeableness. The reason EFA missed this distinction is that there are only six agreeableness measures and some of them have rather low loadings on agreeableness. As EFA is strongly influenced by the number of indicators for a factor, EFA failed to identify the agreeableness factor and the halo factor was misinterpreted as antagonism because antagonistic traits are highly undesirable.
The second factor was called Negative Affectivity and corresponds to the Neuroticism factor in the CFA model.
The third factor was called Disinhibition and corresponds more or less to the Conscientiousness factor in the CFA model.
The fourth factor was called Detachment and corresponds to Extraversion.
The fifth factor was called Psychoticism, which can be confusing because this is also a term used by Eysenck for variation in normal personality. This factor is similar to the CAT-specific factor in the CFA. Thus, it does not represent a dimension of normal personality.
Finally, the EFA model failed to represent Openness as a distinct factor for the same reason it failed to show a distinct agreeableness factor. As Openness is not related to PD-scales, the six Openness facets were simply not enough to form a distinct factor in a model limited to five factors.
In sum, the main problem of the EFA model is that it failed to identify agreeableness and openness as dimensions of normal personality. It therefore does not represent the well-known five factor structure of normal personality. This makes it impossible to examine how variation in normal personality is related to scales that are intended to measure personality disorders. Another problem is that EFA fails to separate method variance and content variance. In short, EFA is an inferior tool to study the relationship between measures of normal personality and allegedly maladaptive traits. The CFA model proposed here can serve as a basis for future exploration of this question, ideally with multi-rater data to separate method variance from content variance.
References
Simms, L. J., Goldberg, L. R., Roberts, J. E., Watson, D., Welte, J., & Rotterman, J. H. (2011). Computerized adaptive assessment of personality disorder: Introducing the CAT–PD Project. Journal of Personality Assessment, 93, 380–389. doi:10.1080/00223891.2011.577475