Since 2011, it is an open secret that many published results in psychology journals do not replicate. The replicability of published results is particularly low in social psychology (Open Science Collaboration, 2015).
A key reason for low replicability is that researchers are rewarded for publishing as many articles as possible without concerns about the replicability of the published findings. This incentive structure is maintained by journal editors, review panels of granting agencies, and hiring and promotion committees at universities.
To change the incentive structure, I developed the Replicability Index, a blog that critically examined the replicability, credibility, and integrity of psychological science. In 2016, I created the first replicability rankings of psychology departments (Schimmack, 2016). Based on scientific criticisms of these methods, I have improved the selection process of articles to be used in departmental reviews.
1. I am using Web of Science to obtain lists of published articles from individual authors (Schimmack, 2022). This method minimizes the chance that articles that do not belong to an author are included in a replicability analysis. It also allows me to classify researchers into areas based on the frequency of publications in specialized journals. Currently, I cannot evaluate neuroscience research. So, the rankings are limited to cognitive, social, developmental, clinical, and applied psychologists.
2. I am using department’s websites to identify researchers that belong to the psychology department. This eliminates articles that are from other departments.
3. I am only using tenured, active professors. This eliminates emeritus professors from the evaluation of departments. I am not including assistant professors because the published results might negatively impact their chances to get tenure. Another reason is that they often do not have enough publications at their current university to produce meaningful results.
Like all empirical research, the present results rely on a number of assumptions and have some limitations. The main limitations are that
(a) only results that were found in an automatic search are included
(b) only results published in 120 journals are included (see list of journals)
(c) published significant results (p < .05) may not be a representative sample of all significant results
(d) point estimates are imprecise and can vary based on sampling error alone.
These limitations do not invalidate the results. Large difference in replicability estimates are likely to predict real differences in success rates of actual replication studies (Schimmack, 2022).
University of Toronto
I used the department website to find core members of the psychology department. I counted 27 professors and 25 associate professors, which makes it one of the larger departments in North America. Not all researchers conduct quantitative research and report test statistics in their result sections. I limited the analysis to 19 professors and 13 associate professors who had at least 100 test statistics.
Figure 1 shows the z-curve for all 13,462 tests statistics in articles published by these 31 faculty members. I use the Figure to explain how a z-curve analysis provides information about replicability and other useful meta-statistics.
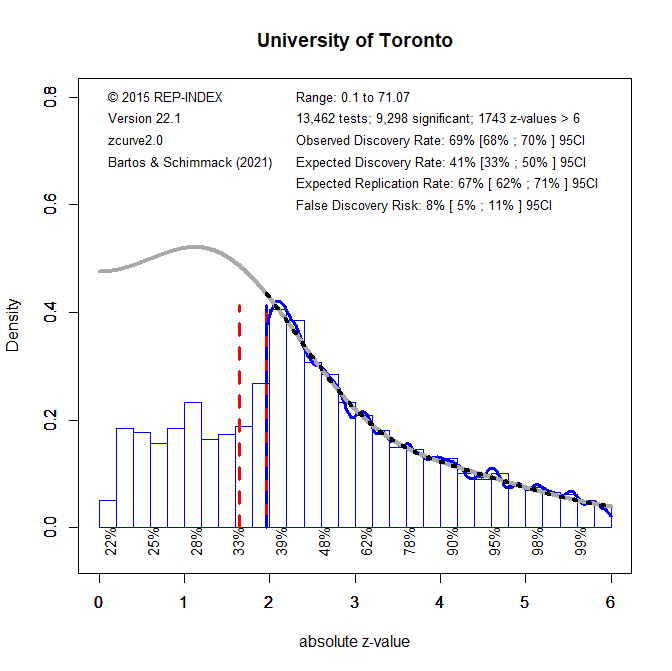
1. All test-statistics are converted into absolute z-scores as a common metric of the strength of evidence (effect size over sampling error) against the null-hypothesis (typically H0 = no effect). A z-curve plot is a histogram of absolute z-scores in the range from 0 to 6. The 1,743 z-scores greater than 6 are not shown because z-scores of this magnitude are extremely unlikely to occur when the null-hypothesis is true (particle physics uses z > 5 for significance). Although they are not shown, they are included in the meta-statistics.
2. Visual inspection of the histogram shows a steep drop in frequencies at z = 1.96 (dashed blue/red line) that corresponds to the standard criterion for statistical significance, p = .05 (two-tailed). This shows that published results are selected for significance. The dashed red/white line shows significance for p < .10, which is often used for marginal significance. Thus, there are more results that are presented as significant than the .05 criterion suggests.
3. To quantify the amount of selection bias, z-curve fits a statistical model to the distribution of statistically significant results (z > 1.96). The grey curve shows the predicted values for the observed significant results and the unobserved non-significant results. The full grey curve is not shown to present a clear picture of the observed distribution. The statistically significant results (including z > 6) make up 41% of the total area under the grey curve. This is called the expected discovery rate because the results provide an estimate of the percentage of significant results that researchers actually obtain in their statistical analyses. In comparison, the percentage of significant results (including z > 6) includes 69% of the published results. This percentage is called the observed discovery rate, which is the rate of significant results in published journal articles. The difference between a 69% ODR and a 41% EDR provides an estimate of the extent of selection for significance. The difference of~ 30 percentage points is fairly large, but other departments have even bigger discrepancies. The upper level of the 95% confidence interval for the EDR is 50%. Thus, the discrepancy is not just random. To put this result in context, it is possible to compare it to the average for 120 psychology journals in 2010 (Schimmack, 2022). The ODR is similar (both 72%), but the EDR is higher (41% vs. 28%).
4. The EDR can be used to estimate the risk that published results are false positives (i.e., a statistically significant result when H0 is true), using Soric’s (1989) formula for the maximum false discovery rate. An EDR of 41% implies that no more than 8% of the significant results are false positives, however the lower limit of the 95%CI of the EDR, 33%, allows for 11% false positive results. Most readers are likely to agree that this is too high. One solution to this problem is to lower the conventional criterion for statistical significance (Benjamin et al., 2017). Figure 2 shows that alpha = .01 reduces the point estimate of the FDR to 2% with an upper limit of the 95% confidence interval of 4%. Thus, without any further information readers could use this criterion to interpret results published in articles by UofT faculty members.

The University of Toronto has three distinct campuses with a joint graduate program. Faculty members are appointed to one of the campuses and hiring and promotion decisions are made autonomously at each of the campuses. The three campuses also have different specializations. For example, clinical psychology is concentrated at the Scarborough (UTSC) campus. It is therefore interesting to examine whether results differ across the three campuses. The next figure shows the results for the University of Toronto – Mississauga (UTM) campus; home of the R-Index.
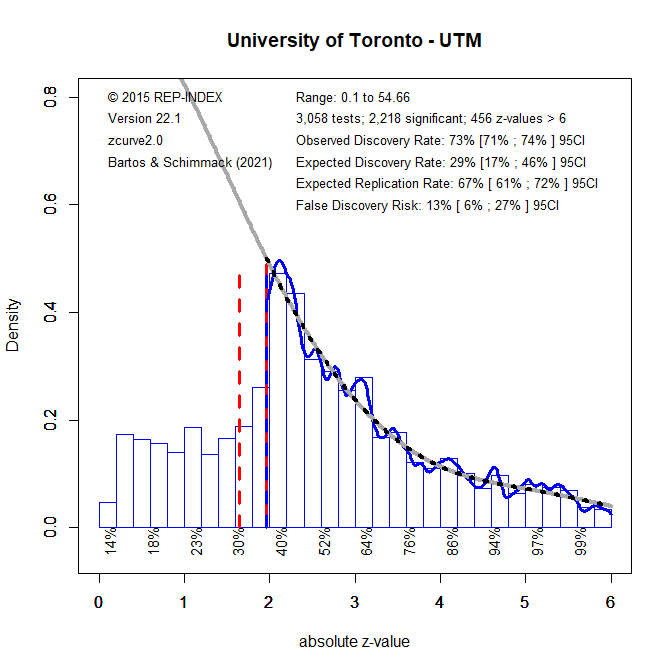
The observed discovery rate and the expected replication rate are very similar, but the point estimate of the EDR for the UTM campus is lower than for UofT in general (29% vs. 41). The confidence intervals do overlap. Thus, it is not clear whether this is a systematic difference or just sampling error.
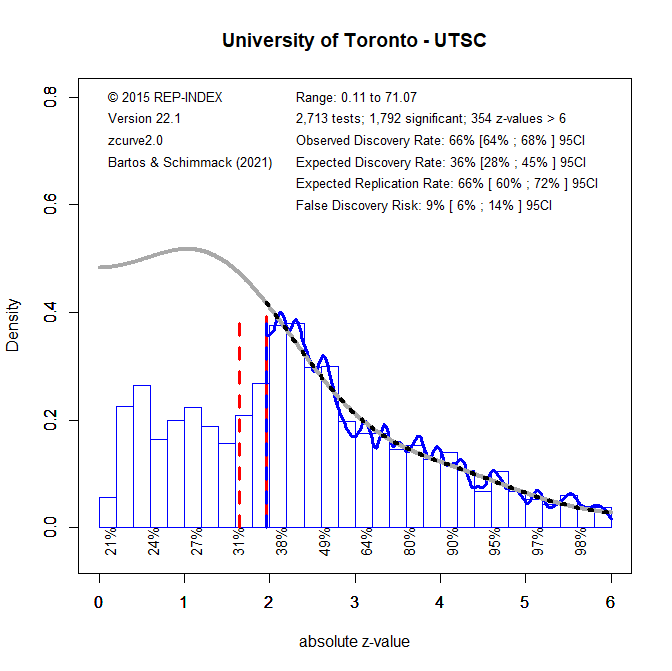
The results for the Scarborough campus also show a similar ODR and ERR. The point estimate of the expected discovery rate is a bit higher than for UTM and lower than for the combined analysis, but the confidence intervals overlap.
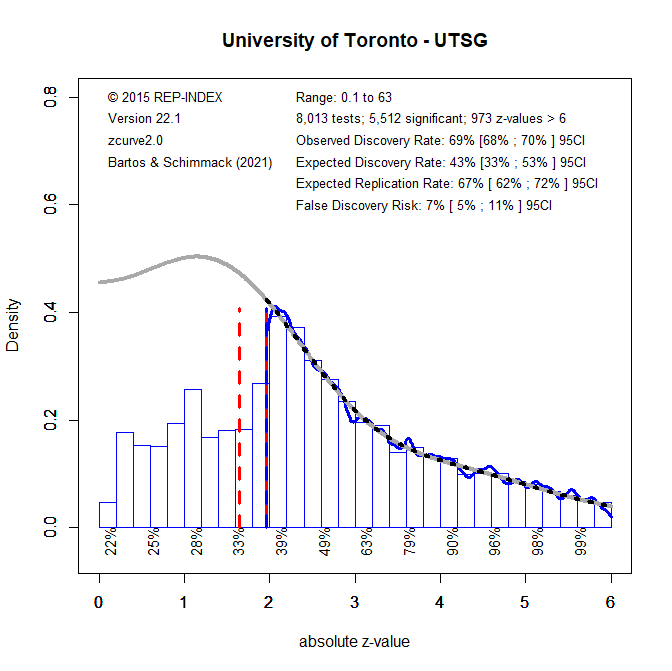
The results for the St. George campus are mostly in line with the overall results. This is partially due to the fact, that researchers on this campus contributed a large number of test results. Overall, these results show that the three departments are more similar than different from each other.
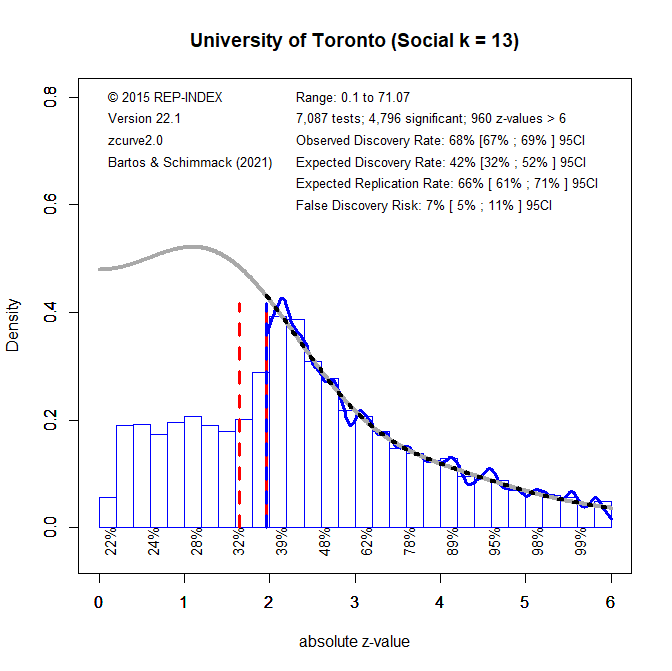
Another potential moderator is the area of research. Social psychology has been shown to be less replicable than cognitive psychology (OSC, 2015). UofT has a fairly large number of social psychologists who contributed to the z-curve (k = 13), especially on the St. George campus (k = 8). The z-curve for social psychologists at UofT is not different from the overall z-curve and the EDR is higher than for social psychologists at other universities.
The results for the other areas are based on smaller numbers of faculty members. Developmental psychology has a slightly lower EDR but the confidence interval is very wide.

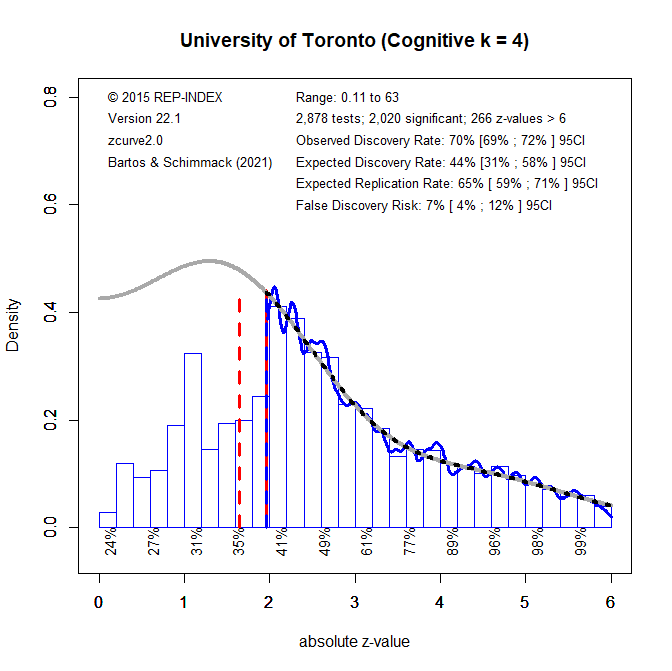
There were only 4 associate or full professors in cognitive psychology with sufficient z-scores (many cognitive researchers publish in neuropsychology journals that are not yet covered). The results are similar to the overall z-curve. Thus, UofT research does not show the difference between social and cognitive psychology that is observed in general or at other universities (Schimmack, 2022).
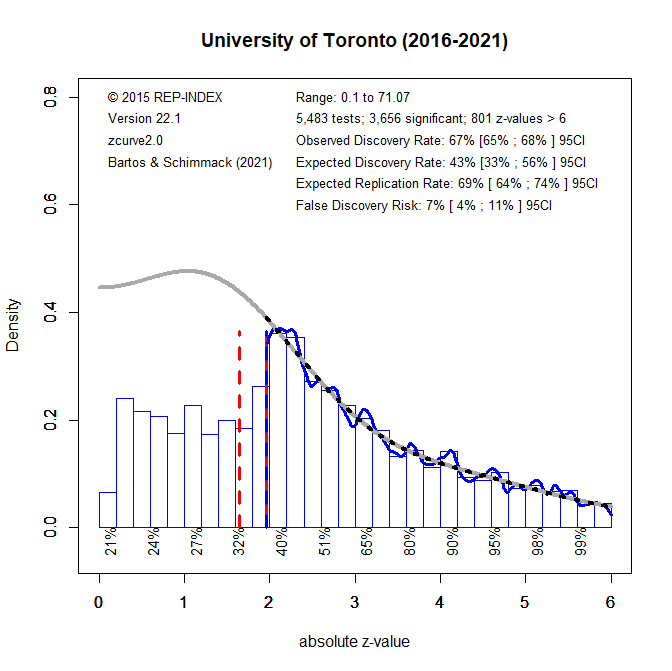
Another possible moderator is time. Before 2011, researchers were often not aware that searching for significant p-values with many analyses inflates the risk of false positive results considerably. After 2011, some researchers have changed their research practices to increase replicability and reduce the risk of false positive results. As change takes time, I looked for articles published after 2015 to see whether UofT faculty shows signs of improved research practices. Unfortunately, this is not the case. The z-curve is similar to the z-curve for all tests.
The table below shows the meta-statistics of all 32 faculty members that provided results for the departmental z-curve. You can see the z-curve for individual faculty member by clicking on their name.
| Rank | Name | ARP | EDR | ERR | FDR |
| 1 | Doug P. VanderLaan | 78 | 81 | 74 | 2 |
| 2 | Romin W. Tafarodi | 74 | 77 | 70 | 2 |
| 3 | Erika N. Carlson | 65 | 67 | 62 | 3 |
| 4 | Emily A. Impett | 64 | 73 | 54 | 5 |
| 5 | Alison L. Chasteen | 58 | 70 | 47 | 6 |
| 6 | Penelope Lockwood | 58 | 68 | 49 | 6 |
| 7 | Paul Bloom | 56 | 81 | 30 | 12 |
| 8 | Suzanne Erb | 55 | 69 | 40 | 8 |
| 9 | Marc A. Fournier | 55 | 74 | 36 | 9 |
| 10 | Anthony C. Ruocco | 55 | 81 | 30 | 12 |
| 11 | Jay Pratt | 55 | 66 | 45 | 6 |
| 12 | Robert Gerlai | 54 | 76 | 32 | 11 |
| 13 | R. Michael Bagby | 54 | 67 | 42 | 7 |
| 14 | William A. Cunningham | 53 | 68 | 38 | 9 |
| 15 | Elizabeth K. Johnson | 51 | 64 | 38 | 9 |
| 16 | Tina Malti | 50 | 63 | 37 | 9 |
| 17 | Michael Inzlicht | 50 | 61 | 39 | 8 |
| 18 | Charles C. Helwig | 50 | 73 | 27 | 15 |
| 19 | Nicholas O. Rule | 50 | 70 | 30 | 12 |
| 20 | Andy C. H. Lee | 49 | 68 | 29 | 13 |
| 21 | Mark A. Schmuckler | 48 | 73 | 24 | 17 |
| 22 | Yoel Inbar | 48 | 62 | 33 | 11 |
| 23 | Jason E. Plaks | 46 | 59 | 34 | 10 |
| 24 | Craig G. Chambers | 45 | 58 | 32 | 11 |
| 25 | Geoff MacDonald | 44 | 64 | 23 | 18 |
| 26 | Jonathan S. Cant | 42 | 60 | 24 | 16 |
| 27 | Ulrich Schimmack | 40 | 60 | 21 | 20 |
| 28 | Susanne Ferber | 40 | 53 | 27 | 14 |
| 29 | Elizabeth Page-Gould | 39 | 60 | 18 | 23 |
| 30 | Norman A. S. Farb | 38 | 62 | 14 | 33 |
| 31 | Morgan D. Barense | 35 | 58 | 13 | 36 |
| 32 | Melissa M. Holmes | 24 | 39 | 9 | 55 |