The journal “Psychonomic Bulletin and Review” is considered the flagship journal of the Psychonomic Society. The psychonomic society is a professional organization like APS and APA, but focuses mostly on cognitive psychology.
The journal was started in 1994 with Henry L. Roediger III as editor. The society already had some journals, but this journal aimed to publish more theory and review articles. However, it also published Brief Reports. An editorial in 2007 noted that submissions were skyrocketing, suggesting that it would be harder to publish in the journal. Despite much talk about a replication crisis or credibility crisis in the 2010s, I could not find any editorials published during this period. The incoming editor Brockmole published an editorial in 2020. It doesn’t mention any concerns about publication bias, questionable research practices, or low power. One reason for the lack of concerns could be that cognitive psychology is more robust than other areas of psychology. However, another possibility is that cognitive psychologists have not tested the replicability of results in cognitive psychology.
The aim of this blog post is to shed some light on the the credibility of results published in Psychonomic Bulletin and Review. Over the past decade, my colleagues and I have developed a statistical tool, z-curve, that makes it possible to estimate the replication rate and the discovery rate based on published test-statistics (t-values, F-values) (Brunner & Schimmack, 2019; Bartos & Schimmack, 2020). The discovery rate can also be used to estimate the maximum false positive rate and the rate of true hypotheses that are being tested. The analysis are based on an automatic extraction of test-statistics (t-values, F-values) from downloaded articles covering the years 2000 to 2019.
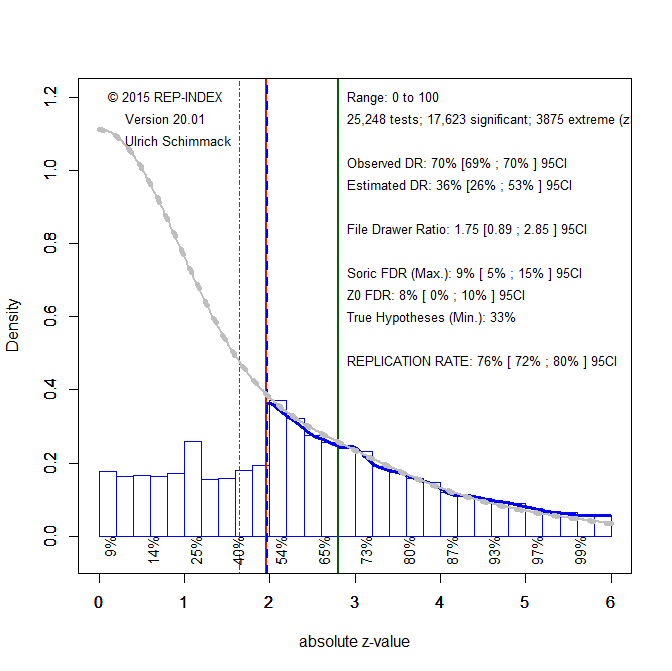
Figure 1 shows the z-curve for all 25,248 test statistics. Visual inspection shows a cliff for z-scores around 1.96, which corresponds to the .05 (two-tailed) criterion of significance. This shows preferential publishing of significant results. This is also indicated by a comparison of the number of non-significant results predicted by the model (grey curve) and the actual number of reported non-significant results (blue histogram). The discrepancy is statistically significant as indicated by a comparison of the 95% confidence intervals of the observed discovery rate, 68% to 70% and the estimated discovery rate, 26% to 53%. The estimated discovery rate implies that for every reported significant result, there should be 1 to 3 non-significant results, File Drawer Ratio 0.89 to 2.85.
With a discovery rate of 36%, the maximum False Positive Rate is 9% (Soric, 1989). Thus, published significant results are unlikely to be false positives in the strict sense that the effect size is zero. This estimate is much lower than the alarming estimate of 40% that was reported by Gronau et al. (2017).
The most important information is the replicability estimate of published significant results. The expected replication rate is 76%, 95%CI = 72% to 80%. Although reassuring, there are some caveats. First, the estimate is an average that includes tests of manipulation checks or unimportant main effects. This might explain why the actual replication rate for cognitive psychology is estimated to be only 50% (Open Science Collaboration, 2015). Local estimates for just significant results (z = 2 to 2.4) have only an expected replication rate of 54% to 65%. Another caveat is that the expected replication rate assumes that experiments can be replicated exactly. When this is not the case, additional selection effects lower the rate and the discovery rate becomes a better estimate of the actual replication rate. A rate of 36% would not be satisfactory.
Figure 1 assumes a simple selection model; significant results are published and non-significant results are not published. However, researchers also use questionable practices to increase their chances of obtaining a significant result (e.g. selective removing of outliers). These practices make just-significant results questionable. To address this concern, it is possible to exclude just-significant (z < 2.4) z-scores from the model. The results of this approach are shown in Figure 2.

The effect on the ERR is small. However, the effect on the expected discovery rate is large. The EDR is now even higher than the observed discovery rate. Thus, there is no evidence that cognitive psychologists hide non-significant results. However, there would be evidence that some just-significant results were obtained with questionable practices because there are more just-significant results than the model predicts. Thus, some questionable research practices are used, but it is not clear which practices are used and how much they influence the discovery rate.
To examine time-trends, I computed the ERR (black) and EDR (grey) using all significant values (solid) and excluding just-significant ones (dotted) and plotted them as a function of publication year.
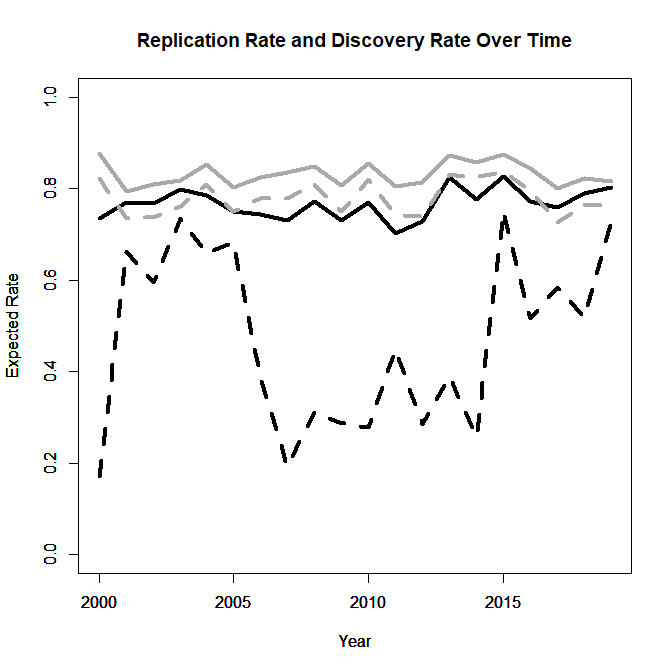
ERR and the EDR excluding just-significant results showed high estimates that remained constant over time (no significant trends). For the EDR using all significant results an interesting pattern emerged. EDR estimates dropped for a period from 2006 to 2014. During this period Psychonomic Bulletin and Review published an excessive amount of just-significant p-values (Figure 4).
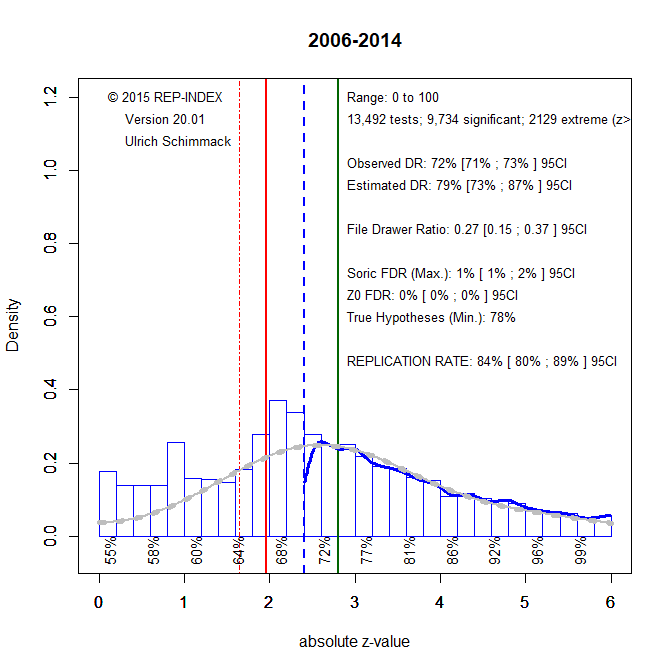
Since 2015, the percentage of just-significant p-values is more in line with model predictions. One possible explanation for this is that concerns about replicabilty changed researchers’ behaviors or reviewers’ evaluation of just-significant p-values.

The fact that there are now more non-significant results than the model predicts is explained by the difficulty of estimating the distribution of non-significant results when only z-scores greater than 2.4 are available. Given the weak evidence of questionable research practices since 2015, it is possible to fit z-curve to non-significant and significant results.
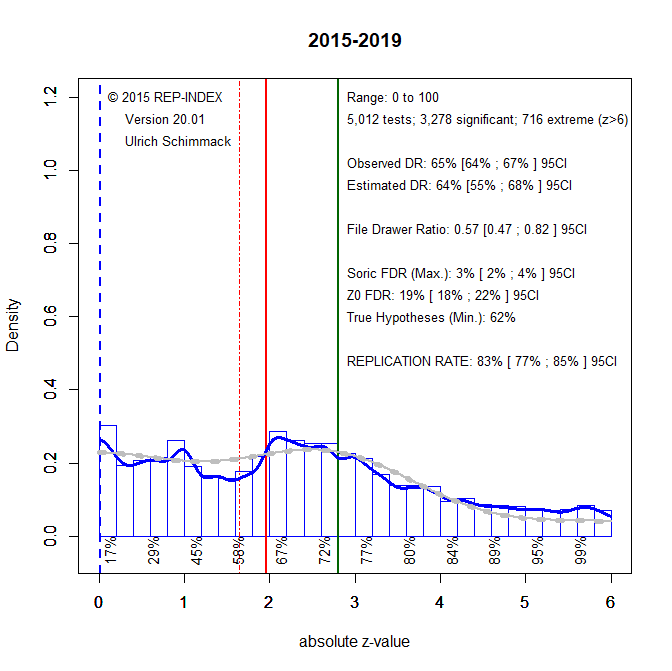
The results show only a slight possibility that promising results (z > 1) are missing because questionable research practices were used to turn them into just significant results. However, for the most part the model fits the data well, indicating that the reported results are credible. There are very few false positive results and a minimum of 62% of hypotheses are true hypotheses. Moreover, most non-significant results are type-II errors, suggesting that replication studies with larger samples would produce significant results. These results provide no evidence for a replication crisis in cognitive psychology. It is therefore unwarranted to generalize from attention-grabbing replication failures in social psychology to cognitive psychology. A bigger concern is modest power that produces a fairly large number of false negative results. Thus, replication efforts should focus on important non-significant result, especially when these results were falsely interpreted as evidence for the null-hypothesis. There is no justification to invest resources in massive replication efforts of significant results. Another concern could be the high rate of true hypotheses. Theory development benefits from evidence that shows when predictions are not confirmed. Given the low rate of false hypotheses, cognitive psychologists might benefit from subjecting their theories to riskier predictions that may fail. All of these conclusions are limited to results published in Psychonomic Bulletin and Review. Z-curve analyses of other journals are needed. It will be particularly interesting to examine whether the time of increased questionable practices from 2007-2014 is a general trend or reflects editorial decisions in this journal. The current editorial team is well-advised to request pre-registered replication studies when the original submission contains several just-significant results for focal hypothesis test.
1 thought on “Estimating the Replicability of Results in ‘Psychonomic Bulletin and Review””