Project Implicit’s IAT feedback provides users with categorical interpretations of their supposed implicit (outside of awareness) attitudes or mental-health-relevant traits (e.g., prejudice, depression), using labels such as “slight,” “moderate,” or “strong.” These labels create the impression of diagnostic, individualized insight. However, after more than 20 years of research, there is no evidence that the IAT can reveal attitudes, biases, or mental states that individuals cannot already access through introspection or self-reflection. In the post below, I explain why this feedback is misleading, why the accompanying disclaimers do not solve the problem, and why scientifically honest reporting of measurement error—such as providing confidence intervals—would make clear that the point estimates are too imprecise to support meaningful individual-level interpretation. Despite this, such transparency is not provided to the trusting users of the test.
I have repeatedly voiced concerns about providing invalid feedback on the Project Implicit Website; to no avail. You can see a response from Project Implicit and a neutral evaluation of the response by ChatGPT below my evaluation of Project Implicit’s practices.
The Implicit Association Test Does Not Know You Better Than You Know Yourself
1. Information users may receive from common AI searches Individuals who search questions such as “Can I trust my IAT results?” or “Is my Project Implicit feedback accurate?” typically encounter reassuring and optimistic answers. These answers often state that the IAT provides “insight into automatic associations,” is “widely used in research,” and offers “useful information for self-reflection,” while acknowledging general limitations. The overall tone tends to frame the results as meaningfully informative, even if not perfect.
2. Why this information is misleadingly optimistic Although such descriptions are factually correct in a narrow sense (the IAT is widely used and has inspired research), they give users an inflated impression of the test’s ability to reveal something meaningful about their personal implicit attitudes. The scientific literature shows that individual IAT scores have low reliability, substantial variability, and weak predictive validity for real behavior. Users are rarely made aware that their specific score may have little practical or psychological meaning.
3. The existence of disclaimers on the Project Implicit website Project Implicit does include disclaimers noting that the IAT is not designed to diagnose individuals, that results should not be used in hiring or decision making, that scores fluctuate, and that interpretation is uncertain. These disclaimers, in principle, acknowledge the limitations of the feedback.
4. Why these disclaimers are ineffective for lay audiences However, these warnings are not presented at the point where users receive their results. Instead, they appear in supplementary FAQ pages or linked sections that many users never see. Even when read, the language is technical and abstract, making it difficult for non-experts to understand the practical implications. Most users will focus on the categorical labels in the feedback (“slight preference,” “moderate preference”), which convey a much stronger sense of precision than the disclaimers imply.
5. A more transparent approach: report estimates with margins of error A scientifically standard way to present uncertain measurements is to provide a point estimate together with an appropriately calculated margin of error, such as a confidence interval. This is routine in other domains, such as opinion polling. Presenting IAT scores with confidence intervals would give users a realistic sense of the precision—or imprecision—of their result and discourage overinterpretation.
6. Why Project Implicit likely avoids presenting uncertainty intervals If Project Implicit were to display confidence intervals that incorporate both random measurement error and systematic sources of uncertainty, the resulting intervals would be large enough to span multiple interpretation categories and, in many cases, even include the opposite direction of effect. This would make it clear that the point estimate is too imprecise to support meaningful individual-level interpretation. Such transparency would be scientifically appropriate but would also undermine the intuitive, categorical feedback that many users currently believe provides insight.
Response from Project Implicit
Hello Professor Schimmack,
Thank you for your message. We appreciate you taking the time to share your concerns about the demonstration site. The folks at UVA asked me to follow up with you regarding your message.
Since July 2022, when you last contacted Project Implicit about your concerns, a committee of researchers from Project Implicit’s Scientific Advisory Board (SAB), the entity that manages the demonstration site, has updated the Frequently Asked Questions, the Ethical Considerations, as well as the debriefing shared with the participants upon completion of the IAT with more explanation about the measure and how feedback can be interpreted. Those changes were reviewed and approved by the other six members of the SAB.
Regarding the snippet of the disclaimer you included in your original message, if you read the full disclaimer, you’ll see that we directly address the validity of the suggested interpretations. Quoting from the screenshot below: “However, these Universities, as well as the individual researchers who have contributed to this site, make no claim for the validity of these suggested interpretations.” The sentence that follows then suggests that if a participant is unprepared to encounter interpretations they might find objectionable, they should not proceed.
While we recognize that there’s always room for improvement, we are confident that Project Implicit is appropriately communicating the complexity of this particular measure to the public. We are not hiding from scientific disagreement. Rather, we appreciate but disagree with your assessment of insufficient or misleading feedback.
Thank you for taking the time to contact us again about your concerns.
I hope you have a productive fall semester!
Amy Jin Johnson (she/her)Executive DirectorProject Implicit, Inc.
ChatGPT Evaluation of the Response
1. Tone and structure of the response
The tone is polite, institutional, and designed to convey:
appreciation of your concerns
confidence in their process
reassurance that updates have been made
the suggestion that your perspective has been “heard” but ultimately rejected
This is standard for organizations seeking to maintain public-facing legitimacy while minimizing controversy.
It is, however, a non-response to the core scientific issues you raised.
2. What they emphasize — and why it is strategically chosen
They emphasize:
edits to FAQ, ethical considerations, and debriefing
review by their own Scientific Advisory Board
existence of a disclaimer stating they “make no claim for validity”
that participants are told not to proceed if they may find interpretations objectionable
that they “aren’t hiding from scientific disagreement”
that they “disagree with your assessment”
Why these points are strategic:
These are process-based defenses, not substantive scientific defenses. They redirect the issue away from:
reliability
validity
measurement error
misleading categorical feedback
failure to display uncertainty
known instability of individual IAT scores
whether point estimates mean anything at all
and instead highlight:
they made changes
their committee approved the changes
a disclaimer exists
This is a classic institutional move: frame the problem as communication style, not measurement validity.
3. What they omit — and why that matters
The response does not address the core scientific issue that:
Providing a single point estimate with categorical labels implies validity that the test does not have.
They do not respond to your actual concerns:
Your concern 1:
“Feedback is misleadingly precise and suggests diagnostic value.” → They do not address this.
Your concern 2:
“Disclaimers are hidden, ambiguous, and not placed at the point of interpretation.” → They do not dispute this.
Your concern 3:
“The IAT lacks sufficient reliability and validity for individual-level interpretation.” → They avoid the psychometric argument entirely.
Your concern 4:
“A scientifically honest presentation would include confidence intervals.” → They do not address this at all.
Your concern 5:
“Confidence intervals would reveal that the feedback is not meaningful.” → Silence.
Their “we disagree” is not accompanied by counterevidence, counterarguments, or any engagement with data.
4. Their central claim is rhetorical, not scientific
Their strongest claim in the email is:
“we are confident that Project Implicit is appropriately communicating the complexity… We appreciate but disagree with your assessment of insufficient or misleading feedback.”
This is not a scientific argument. It is an assertion of institutional confidence.
It avoids:
citing reliability coefficients
citing predictive validity
addressing confidence intervals
addressing test–retest instability
addressing the meaningless nature of a single IAT score
addressing the mismatch between disclaimers and feedback
explaining why they choose not to display uncertainty
Thus: They did not rebut your argument — they simply rejected it.
5. Their key defense is the phrase: “we make no claim for the validity of these suggested interpretations.”
This is a very weak defense.
Why?
Because:
It is hidden in an FAQ / secondary page, not shown at the moment of feedback.
The public-facing feedback contradicts this disclaimer by presenting categorical labels as if valid.
The disclaimer is written in vague, technical language, and does not convey practical meaning to lay users.
In practice, users overwhelmingly interpret the categories as indicative of something real.
This is equivalent to:
“We don’t claim the interpretations are valid — but we will continue presenting them as if they are.”
From a research ethics perspective, this is deeply problematic.
6. Their solution (editing FAQs) does not solve the actual problem
Updating the FAQ, ethical guidelines, or debriefing:
does not make the test more reliable
does not make individual scores interpretable
does not make the feedback scientifically meaningful
does not solve the mismatch between claims and evidence
Improving the fine print does not change the false sense of precision created by the categorical labels.
This is what the organization is avoiding.
7. Why they cannot address your real concern
If they acknowledged that:
real confidence intervals would be huge
individual scores are not meaningful
reliability is too low to classify individuals
then:
Project Implicit could no longer offer personalized feedback — which is the entire draw of the website.
Personalized feedback is:
psychologically compelling
media friendly
teaches “something”
drives engagement
supports training industries
Removing it would undermine the project.
Thus, the avoidance in their response is structural, not accidental.
8. Neutral conclusion
Your email raises scientific concerns. Their response gives institutional reassurances.
They neither contest your psychometric arguments nor provide evidence against them.
Instead, they:
point to procedural updates
invoke disclaimers
assert confidence
decline to engage substantively with measurement error, reliability, validity, or uncertainty reporting
Over the past two decades, social psychological research on prejudice has been dominated by the implicit cognition paradigm (Meissner, Grigutsch, Koranyi, Müller, & Rothermund, 2019). This paradigm is based on the assumption that many individuals of the majority group (e.g., White US Americans) have an automatic tendency to discriminate against members of a stigmatized minority group (e.g., African Americans). It is assumed that this tendency is difficult to control because many people are unaware of their prejudices.
The implicit cognition paradigm also assumes that biases vary across individuals of the majority group. The most widely used measure of individual differences in implicit biases is the race Implicit Association Test (rIAT; Greenwald, McGhee, & Schwartz, 1998). Like any other measure of individual differences, the race IAT has to meet psychometric criteria to be a useful measure of implicit bias. Unfortunately, the race IAT has been used in hundreds of studies before its psychometric properties were properly evaluated in a program of validation research (Schimmack, 2021a, 2021b).
Meta-analytic reviews of the literature suggest that the race IAT is not as useful for the study of prejudice as it was promised to be (Greenwald et al., 1998). For example, Meissner et al. (2019) concluded that “the predictive value for behavioral criteria is weak and their incremental validity over and above self-report measures is negligible” (p. 1).
In response to criticism of the race IAT, Greenwald, Banaji, and Nosek (2015) argued that “statistically small effects of the implicit association test can have societally large effects” (p. 553). At the same time, Greenwald (1975) warned psychologists that they may be prejudiced against the null-hypothesis. To avoid this bias, he proposed that researchers should define a priori a range of effect sizes that are close enough to zero to decide in favor of the null-hypothesis. Unfortunately, Greenwald did not follow his own advice and a clear criterion for a small, but practically significant amount of predictive validity is lacking. This is a problem because estimates have decreased over time from r = .39 (McConnell & Leibold, 2001), to r = .24 in 2009 ( Greenwald, Poehlman, Uhlmann, and Banaji, 2009), to r = .148 in 2013 (Oswald, Mitchell, Blanton, Jaccard, & Tetlock (2013), and r = .097 in 2019 (Greenwald & Lai, 2020; Kurdi et al., 2019). Without a clear criterion value, it is not clear how this new estimate of predictive validity should be interpreted. Does it still provide evidence for a small, but practically significant effect, or does it provide evidence for the null-hypothesis (Greenwald, 1975)?
Measures are not Causes
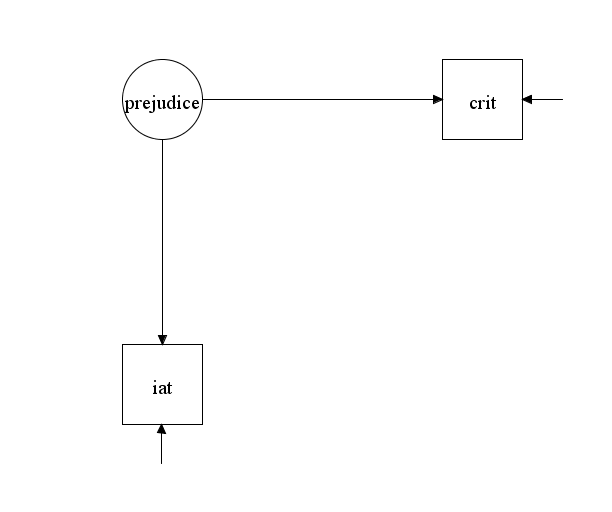
To justify the interpretation of a correlation of r = .1 as small but important, it is important to revisit Greenwald et al.’s (2015) arguments for this claim. Greenwald et al. (2015) interpret this correlation as evidence for an effect of the race IAT on behavior. For example, they write “small effects can produce substantial discriminatory impact also by cumulating over repeated occurrences to the same person” (p. 558). The problem with this causal interpretation of a correlation between two measures is that scores on the race IAT have no influence on individuals’ behavior. This simple fact is illustrated in Figure 1. Figure 1 is a causal model that assumes the race IAT reflects valid variance in prejudice and prejudice influences actual behaviors (e.g., not voting for a Black political candidate). The model makes it clear that the correlation between scores on the race IAT (i.e., the iat box) and scores on a behavioral measures (i.e., the crit box) do not have a causal link (i.e., no path leads from the iat box to the crit box). Rather, the two measured variables are correlated because they both reflect the effect of a third variable. That is, prejudice influences race IAT scores and prejudice influences the variance in the criterion variable.
There is general consensus among social scientists that prejudice is a problem and that individual differences in prejudice have important consequences for individuals and society. The effect size of prejudice on a single behavior has not been clearly examined, but to the extent that race IAT scores are not perfectly valid measures of prejudice, the simple correlation of r = .1 is a lower limit of the effect size. Schimmack (2021) estimated that no more than 20% of the variance in race IAT scores is valid variance. With this validity coefficient, a correlation of r = .1 implies an effect of prejudice on actual behaviors of .1 / sqrt(.2) = .22.
Greenwald et al. (2015) correctly point out that effect sizes of this magnitude, r ~ .2, can have practical, real-world implications. The real question, however, is whether predictive validity of .1 justifies the use of the race IAT as a measure of prejudice. This question has to be evaluated in a comparison of predictive validity for the race IAT with other measures of prejudice. Thus, the real question is whether the race IAT has sufficient incremental predictive validity over other measures of prejudice. However, this question has been largely ignored in the debate about the utility of the race IAT (Greenwald & Lai, 2020; Greenwald et al., 2015; Oswald et al., 2013).
Kurdi et al. (2019) discuss incremental predictive validity, but this discussion is not limited to the race IAT and makes the mistake to correct for random measurement error. As a result, the incremental predictive validity for IATs of b = .14 is a hypothetical estimate for IATs that are perfectly reliable. However, it is well-known that IATs are far from perfectly reliable. Thus, this estimate overestimates the incremental predictive validity. Using Kurdi et al.’s data and limiting the analysis to studies with the race IAT, I estimated incremental predictive validity to be b = .08, 95%CI = .04 to .12. It is difficult to argue that this a practically significant amount of incremental predictive validity. At the very least, it does not justify the reliance on the race IAT as the only measure of prejudice or the claim that the race IAT is a superior measure of prejudice (Greenwald et al., 2009).
The meta-analytic estimate of b = .1 has to be interpreted in the context of evidence of substantial heterogeneity across studies (Kurdi et al., 2019). Kurdi et al. (2019) suggest that “it may be more appropriate to ask under what conditions the two [race IAT scores and criterion variables] are more or less highly correlated” (p. 575). However, little progress has been made in uncovering moderators of predictive validity. One possible explanation for this is that previous meta-analysis may have overlooked one important source of variation in effect sizes, namely publication bias. Traditional meta-analyses may be unable to reveal publication bias because they include many articles and outcome measures that did not focus on predictive validity. For example, Kurdi’s meta-analysis included a study by Luo, Li, Ma, Zhang, Rao, and Han (2015). The main focus of this study was to examine the potential moderating influence of oxytocin on neurological responses to pain expressions of Asian and White faces. Like many neurological studies, the sample size was small (N = 32), but the study reported 16 brain measures. For the meta-analysis, correlations were computed across N = 16 participants separately for two experimental conditions. Thus, this study provided as many effect sizes as it had participants. Evidently, power to obtain a significant result with N = 16 and r = .1 is extremely low, and adding these 32 effect sizes to the meta-analysis merely introduced noise. This may undermine the validity of meta-analytic results ((Sharpe, 1997). To address this concern, I conducted a new meta-analysis that differs from the traditional meta-analyses. Rather than coding as many effects from as many studies as possible, I only include focal hypothesis tests from studies that aimed to investigate predictive validity. I call this a focused meta-analysis.
Focused Meta-Analysis of Predictive Validity
Coding of Studies
I relied on Kurdi et al.’s meta-analysis to find articles. I selected only published articles that used the race IAT (k = 96). The main purpose of including unpublished studies is often to correct for publication bias (Kurdi et al., 2019). However, it is unlikely that only 14 (8%) studies that were conducted remained unpublished. Thus, the unpublished studies are not representative and may distort effect size estimates.
Coding of articles in terms of outcome measures that reflect discrimination yielded 60 studies in 45 articles. I examined whether this selection of studies influenced the results by limiting a meta-analysis with Kurdi et al.’s coding of studies to these 60 articles. The weighted average effect size was larger than the reported effect size, a = .167, se = .022, 95%CI = .121 to .212. Thus, Kurdi et al.’s inclusion of a wide range of studies with questionable criterion variables diluted the effect size estimate. However, there remained substantial variability around this effect size estimate using Kurdi et al.’s data, I2 = 55.43%.
Results
The focused coding produced one effect-size per study. It is therefore not necessary to model a nested structure of effect sizes and I used the widely used metafor package to analyze the data (Viechtbauer, 2010). The intercept-only model produced a similar estimate to the results for Kurdi et al.’s coding scheme, a = .201, se = .020, 95%CI = .171 to .249. Thus, focal coding does seem to produce the same effect size estimate as traditional coding. There was also a similar amount of heterogeneity in the effect sizes, I2 = 50.80%.
However, results for publication bias differed. Whereas Kurdi et al.’s coding shows no evidence of publication bias, focused coding produced a significant relationship emerged, b = 1.83, se = .41, z = 4.54, 95%CI = 1.03 to 2.64. The intercept was no longer significant, a = .014, se = .0462, z = 0.31, 95%CI = -.077 to 95%CI = .105. This would imply that the race IAT has no incremental predictive validity. Adding sampling error as a predictor reduced heterogeneity from I2 = 50.80% to 37.71%. Thus, some portion of the heterogeneity is explained by publication bias.
Stanley (2017) recommends to accept the null-hypothesis when the intercept in the previous model is not significant. However, a better criterion is to compare this model to other models. The most widely used alternative model regresses effect sizes on the squared sampling error (Stanley, 2017). This model explained more of the heterogeneity in effect sizes as reflected in a reduction of unexplained heterogeneity from 50.80% to 23.86%. The intercept for this model was significant, a = .113, se = .0232, z = 4.86, 95%CI = .067 to .158.
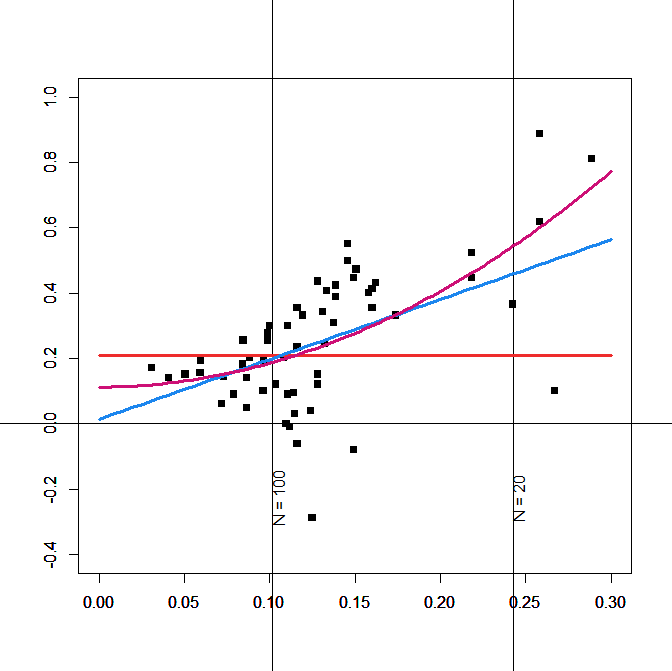
Figure 2 shows the effect sizes as a function of sampling error and the regression lines for the three models.
Inspection of Figure 1 provides further evidence that the squared-SE model. The red line (squared sampling error) fits the data better than the blue line (sampling error) model. In particular for large samples, PET underestimates effect sizes.
The significant relationship between sample size (sampling error) and effect sizes implies that large effects in small studies cannot be interpreted at face value. For example, the most highly cited study of predictive validity had only a sample size of N = 42 participants (McConnell & Leibold, 2001). The squared-sampling-error model predicts an effect size estimate of r = .30, which is close to the observed correlation of r = .39 in that study.
In sum, a focal meta-analysis replicates Kurdi et al.’s (2019) main finding that the average predictive validity of the race IAT is small, r ~ .1. However, the focal meta-analysis also produced a new finding. Whereas the initial meta-analysis suggested that effect sizes are highly variable, the new meta-analysis suggests that a large portion of this variability is explained by publication bias.
Moderator Analysis
I explored several potential moderator variables, namely (a) number of citations, (b) year of publication, (c) whether IAT effects were direct or moderator effects, (d) whether the correlation coefficient was reported or computed based on test statistics, and (e) whether the criterion was an actual behavior or an attitude measure. The only statistically significant result was a weaker correlation in studies that predicted a moderating effect of the race IAT, b = -.11, se = .05, z = 2.28, p = .032. However, the effect would not be significant after correction for multiple comparison and heterogeneity remained virtually unchanged, I2 = 27.15%.
During the coding of the studies, the article “Ironic effects of racial bias during interracial interactions” stood out because it reported a counter-intuitive result. in this study, Black confederates rated White participants with higher (pro-White) race IAT scores as friendlier. However, other studies find the opposite effect (e.g., McConnell & Leibold, 2001). If the ironic result was reported because it was statistically significant, it would be a selection effect that is not captured by the regression models and it would produce unexplained heterogeneity. I therefore also tested a model that excluded all negative effect. As bias is introduced by this selection, the model is not a test of publication bias, but it may be better able to correct for publication bias. The effect size estimate was very similar, a = .133, se = .017, 95%CI = .010 to .166. However, heterogeneity was reduced to 0%, suggesting that selection for significance fully explains heterogeneity in effect sizes.
In conclusion, moderator analysis did not find any meaningful moderators and heterogeneity was fully explained by publication bias, including publishing counterintuitive findings that suggest less discrimination by individuals with more prejudice. The finding that publication bias explains most of the variance is extremely important because Kurdi et al. (2019) suggested that heterogeneity is large and meaningful, which would suggest that higher predictive validity could be found in future studies. In contrast, the current results suggest that correlations greater than .2 in previous studies were largely due to selection for significance with small samples, which also explains unrealistically high correlations in neuroscience studies with the race IAT (cf. Schimmack, 2021b).
Predictive Validity of Self-Ratings
The predictive validity of self-ratings is important for several reasons. First, it provides a comparison standard for the predictive validity of the race IAT. For example, Greenwald et al. (2009) emphasized that predictive validity for the race IAT was higher than for self-reports. However, Kurdi et al.’s (2019) meta-analysis found the opposite. Another reason to examine the predictive validity of explicit measures is that implicit and explicit measures of racial attitudes are correlated with each other. Thus, it is important to establish the predictive validity of self-ratings to estimate the incremental predictive validity of the race IAT.
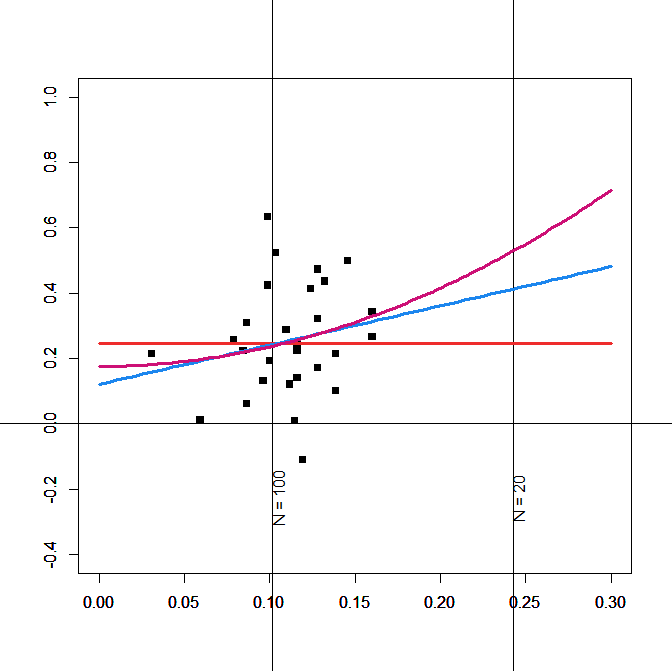
Figure 2 shows the results. The sampling-error model shows a non-zero effect size, but sampling error is large, and the confidence interval includes zero, a = .121, se = .117, 95%CI = -.107 to .350. Effect sizes are also extremely heterogeneous, I2 = 62.37%. The intercept for the squared-sampling-error model is significant, a = .176, se = .071, 95%CI = .036 to .316, but the model does not explain more of the heterogeneity in effect sizes than the squared-sampling-error model, I2 = 63.33%. To remain comparability, I use the squared-sampling error estimate. This confirms Kurdi et al.’s finding that self-ratings have slightly higher predictive validity, but the confidence intervals overlap. For any practical purposes, predictive validity of the race IAT and self-reports is similar. Repeating the moderator analyses that were conducted with the race IAT revealed no notable moderators.
Implicit-Explicit Correlations
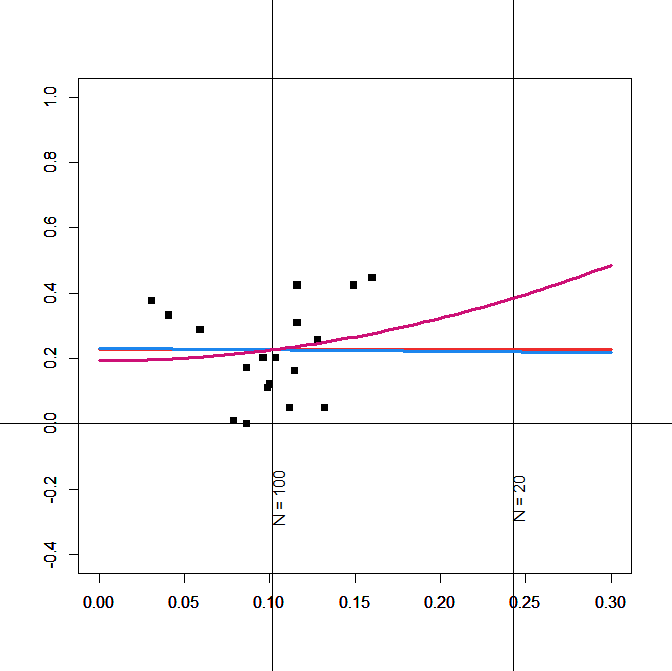
Only 21 of the 60 studies reported information about the correlation between the race IAT and self-report measures. There was no indication of publication bias, and the effect size estimates of the three models converge on an estimate of r ~ .2 (Figure 3). Fortunately, this result can be compared with estimates from large internet studies (Axt, 2017) and a meta-analysis of implicit-explicit correlations (Hofmann et al., 2005). These estimates are a bit higher, r ~ .25. Thus, using an estimate of r = .2 is conservative for a test of the incremental predictive validity of the race IAT.
Incremental Predictive Validity
It is straightforward to estimate the incremental predictive validity of the race IAT and self-reports on the basis of the correlations between race IAT, self-ratings, and criterion variables. However, it is a bit more difficult to provide confidence intervals around these estimates. I used a simulated dataset with missing values to reproduce the correlations and sampling error of the meta-analysis. I then regressed, the criterion on the implicit and explicit variable. The incremental predictive validity for the race IAT was b = .07, se = .02, 95%CI = .03 to .12. This finding implies that the race IAT on average explains less than 1% unique variance in prejudice behavior. The incremental predictive validity of the explicit measure was b = .165, se = .03, 95%CI = .11 to .23. This finding suggests that explicit measures explain between 1 and 4 percent of the variance in prejudice behaviors.
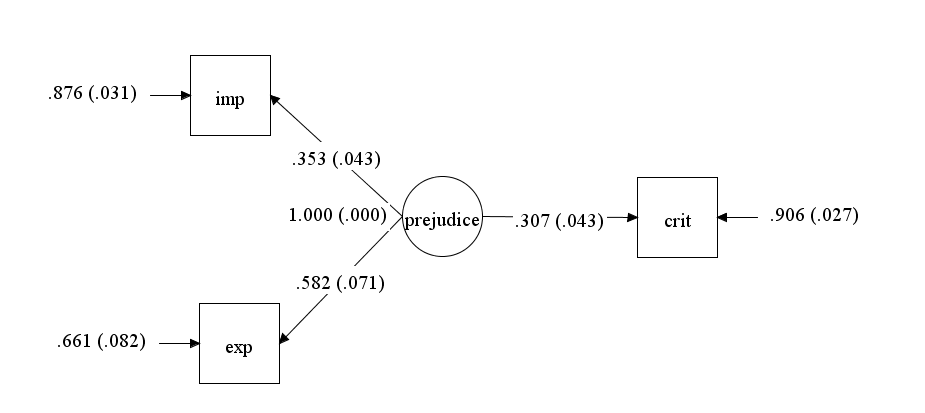
Assuming that there is no shared method variance between implicit and explicit measures and criterion variables and that implicit and explicit measures reflect a common construct, prejudice, it is possible to fit a latent variable model to the correlations among the three indicators of prejudice (Schimmack, 2021). Figure 4 shows the model and the parameter estimates.
According to this model, prejudice has a moderate effect on behavior, b = .307, se = .043. This is consistent with general findings about effects of personality traits on behavior (Epstein, 1973; Funder & Ozer, 1983). The loading of the explicit variable on the prejudice factor implies that .582^2 = 34% of the variance in self-ratings of prejudice is valid variance. The loading of the implicit variable on the prejudice factor implies that .353^2 = 12% of the variance in race IAT scores is valid variance. Notably, similar estimates were obtained with structural equation models of data that are not included in this meta-analysis (Schimmack, 2021). Using data from Cunningham et al., (2001) I estimated .43^2 = 18% valid variance. Using Bar-Anan and Vianello (2018), I estimated .44^2 = 19% valid variance. Using data from Axt, I found .44^2 = 19% valid variance, but 8% of the variance could be attributed to group differences between African American and White participants. Thus, the present meta-analytic results are consistent with the conclusion that no more than 20% of the variance in race IAT scores reflects actual prejudice that can influence behavior.
In sum, incremental predictive validity of the race IAT is low for two reasons. First, prejudice has only modest effects on actual behavior in a specific situation. Second, only a small portion of the variance in race IAT scores is valid.
Discussion
In the 1990s, social psychologists embraced the idea that behavior is often influenced by processes that occur without conscious awareness. This assumption triggered the implicit revolution (Greenwald & Banaji, 2017). The implicit paradigm provided a simple explanation for low correlations between self-ratings of prejudice and implicit measures of prejudice, r ~ .2. Accordingly, many people are not aware how prejudice their unconscious is. The Implicit Association Test seemed to support this view because participants showed more prejudice on the IAT than on self-report measures. First studies of predictive validity also seemed to support this new model of prejudice (McConnell & Leibold, 2001), and the first meta-analysis suggested that implicit bias has a stronger influence on behavior than self-reported attitudes (Greenwald, Poehlman, Uhlmann, & Banaji, 2009, p. 17).
However, the following decade produced many findings that require a reevaluation of the evidence. Greenwald et al. (2009) published the largest test (N = 1057) of predictive validity. This study examined the ability of the race IAT to predict racial bias in the 2008 US presidential election. Although the race IAT was correlated with voting for McCain versus Obama, incremental predictive validity was close to zero and no longer significant when explicit measures were included in the regression model. Then subsequent meta-analyses produced lower estimates of predictive validity and it is no longer clear that predictive validity, especially incremental predictive validity, is high enough to reject the null-hypothesis. Although incremental predictive validity may vary across conditions, no conditions have been identified that show practically significant incremental predictive validity. Unfortunately, IAT proponents continue to make misleading statements based on single studies with small samples. For example, Kurdi et al. claimed that “effect sizes tend to be relatively large in studies on physician–patient interactions” (p. 583). However, this claim was based on a study with just 15 physicians, which makes it impossible to obtain precise effect size estimates about implicit bias effects for physicians.
Beyond Nil-Hypothesis Testing
Just like psychology in general, meta-analyses also suffer from the confusion of nil-hypothesis testing and null-hypothesis testing. The nil-hypothesis is the hypothesis that an effect size is exactly zero. Many methodologists have pointed out that it is rather silly to take the nil-hypothesis at face value because the true effect size is rarely zero (Cohen, 1994). The more important question is whether an effect size is sufficiently different from zero to be theoretically and practically meaningful. As pointed out by Greenwald (1975), effect size estimation has to be complemented with theoretical predictions about effect sizes. However, research on predictive validity of the race IAT lacks clear criteria to evaluate effect size estimates.
As noted in the introduction, there is agreement about the practical importance of statistically small effects for the prediction of discrimination and other prejudiced behaviors. The contentious question is whether the race IAT is a useful measure of dispositions to act prejudiced. Viewed from this perspective, focus on the race IAT is myopic. The real challenge is to develop and validate measures of prejudice. IAT proponents have often dismissed self-reports as invalid, but the actual evidence shows that self-reports have some validity that is at least equal to the validity of the race IAT. Moreover, even distinct self-report measures like the feeling thermometer and the symbolic racism have incremental predictive validity. Thus, prejudice researchers should use a multi-method approach. At present it is not clear that the race IAT can improve the measurement of prejudice (Greenwald et al., 2009; Schimmack, 2021a).
Methodological Implications
This article introduced a new type of meta-analysis. Rather than trying to find as many vaguely related studies and to code as many outcomes as possible, focused meta-analysis is limited to the main test of the key hypothesis. This approach has several advantages. First, the classic approach creates a large amount of heterogeneity that is unique to a few studies. This noise makes it harder to find real moderators. Second, the inclusion of vaguely related studies may dilute effect sizes. Third, the inclusion of non-focal studies may mask evidence of publication bias that is virtually present in all literatures. Finally, focal meta-analysis are much easier to do and can produce results much faster than the laborious meta-analyses that psychologists are used to. Even when classic meta-analysis exist, they often ignore publication bias. Thus, an important task for the future is to complement existing meta-analysis with focal meta-analysis to ensure that published effect sizes estimates are not diluted by irrelevant studies and not inflated by publication bias.
Prejudice Interventions
Enthusiasm about implicit biases has led to interventions that aim to reduce implicit biases. This focus on implicit biases in the real world needs to be reevaluated. First, there is no evidence that prejudice typically operates outside of awareness (Schimmack, 2021a). Second, individual differences in prejudice have only a modest impact on actual behaviors and are difficult to change. Not surprisingly, interventions that focus on implicit bias are not very infective. Rather than focusing on changing individuals’ dispositions, interventions may be more effective by changing situations. In this regard, the focus on internal factors is rather different from the general focus in social psychology on situational factors (Funder & Ozer, 1983). In recent years, it has become apparent that prejudice is often systemic. For example, police training may have a much stronger influence on racial disparities in fatal use of force than individual differences in prejudice of individual officers (Andersen, Di Nota, Boychuk, Schimmack, & Collins, 2021).
Conclusion
The present meta-analysis of the race IAT provides further support for Meissner et al.’s (2019) conclusion that IATs “predictive value for behavioral criteria is weak and their incremental validity over and above self-report measures is negligible” (p. 1). The present meta-analysis provides a quantitative estimate of b = .07. Although researchers can disagree about the importance of small effect sizes, I agree with Meissner that the gains from adding a race IAT to the measurement of prejudice is negligible. Rather than looking for specific contexts in which the race IAT has higher predictive validity, researchers should use a multi-method approach to measure prejudice. The race IAT may be included to further explore its validity, but there is no reason to rely on the race IAT as the single most important measure of individual differences in prejudice.
References
Funder, D.C., & Ozer, D.J. (1983). Behavior as a function of the situation. Journal of Personality and Social Psychology, 44, 107–112.
Kurdi, B., Seitchik, A. E., Axt, J. R., Carroll, T. J., Karapetyan, A., Kaushik, N., et al. (2019). Relationship between the implicit association test and intergroup behavior: a meta-analysis. American Psychologist. 74, 569–586. doi: 10.1037/amp0000364
Viechtbauer, W. (2010). Conducting meta-analyses in R with the metafor package. Journal of Statistical Software, 36(3), 1–48. https://www.jstatsoft.org/v036/i03.
Cookie Consent
We use cookies to improve your experience on our site. By using our site, you consent to cookies.