In 1976, Andrews and Withey published a groundbreaking book on the measurement of well-being. Although their book has been cited over 2,000 times, including influential articles like Diener’s 1984 and 1999 Psychological Bulletin articles on Subjective Well-Being, it is likely that many people are not familiar with the book because books are not as accessible as online articles. The aim of this blog post is to review and comment on the main points made by Andrews and Withey.
CHAPTER 1: Introduction
A&W (wink) believed that well-being indicators are useful because they reflect major societal forces that influence individuals’ well-being.
“In these days of growing interdependence and social complexity we need more adequate cues and indicators of the nature, meaning, pace, and course of social change” (p. 1).
Presumably, A&W would be pleasantly surprised about the widespread use of well-being surveys for this purpose. Well-being questions are included in the General Social Survey, The German Socio-Economic Panel Study, the World Value Survey, and Gallup’s World Poll and the daily survey of Americans’ well-being and health.
A&W saw themselves as part of a broader movement towards evidence based public policy.
The social indicator “movement” is gaining adherents all over the world. … Several facets of these definitions reflect the basic perspectives of the social indicator effort. The quest is for a limited yet comprehensive set of coherent and significant indicators, which can be monitored over time, and which can be disaggregated to the level of the relevant social unit (p. 4).
Objective and Subjective Indicators
A&W criticize the common distinction between objective and subjective indicators of well-being. Objective indicators such as hunger, pollution, or unemployment are factors that are universally considered bad for individuals are typically called objective indicators.
A&W propose to distinguish three features of indicators.
Thus, it may be more helpful and meaningful to consider the individualistic or consensual aspects of phenomena, the private or public accessibility of evidence, and the different forms and patterns of behavior needed to change something rather than to cling to the more simplistic notions of objective and subjective.
They propose to use “perceptions of well-being” as a social indicator. This indicator is individualistic, private, and may require personalized interventions to change them.
The work of engineers, industrialists, construction workers, technological innovators, foresters, and farmers who alter the physical and biological environment is matched by educators, therapists, advertisers, lovers, friends, ministers, politicians, and issue advocates who are all interested and active in constructing, tearing down, and remodeling subjective appreciations and experiences. (p. 6)
A&W argue that measuring “perceptions of well-being” is important because citizens of modern societies share the belief that societies should maximize well-being.
The promotion of individual well-being is a central goal of virtually all modern societies, and of many units within them. While there are real and important differences of opinion-both within societies and between them-about how individual well-being is to be maximized, there is nearly universal agreement that the goal itself is a worthy one and is to be actively pursued. (p. 7).
Research Goals
A&W’s goal was to develop a set of indicators (not just one) that fulfill several criteria that can be considered validation criteria.
1. Content validity. Their coverage should be sufficiently broad to include all the most
important concerns of the population whose well-being is to be monitored. If the relevant population includes demographic or cultural subgroups that might be the targets of separate social policies, or that might be affected differentially by social policies, the indicators should have relevance for each of the subgroups as well as for the whole population.
2. Construct Validity. The validity (i.e., accuracy) with which the indicators are measured
should be high, and known.
3. Parsimony and Efficiency: It should be possible to measure the indicators with a high degree of statistical and economic efficiency so that it is feasible to monitor them on a regular basis at reasonable cost.
4. Flexibility: The instrument used to measure the indicators should be flexible so that it can accommodate different trade-offs between resource input, accuracy of output, and degree of detail or specificity.
In short, the indicators should be measured with breadth, relevance, efficiency, validity, and flexibility. (p. 8).
A&W then list several specific research questions that they aimed to answer.
1. What are the more significant general concerns of the American people?
2. Which of these concerns are relevant to Americans’ sense of general wellbeing?
3. What is the relative potency of each concern vis-a.-vis well-being?
4. How do the relevant concerns relate to one another?
5. How do Americans arrive at their general sense of well-being?
6. To what extent can Americans easily identify and report their feelings
about well-being?
7. To what extent will they bias their answers?
8. How stable are Americans’ evaluations of particular concerns?
9. How comparable are various subgroups within the American population
with respect to each of the questions above?
Although some of these questions have been examined in great detail others have been neglected in the following decades of well-being research. In particular, very little attention has been paid to questions about the potency (strength of influence) of different concerns for global perceptions of well-being, and to the question how different concerns are related to each other. In contrast, the stability of well-being perceptions has been examined in numerous longitudinal studies (see Anusic & Schimmack, 2016, for the most recent meta-analysis).
Usefulness
A&W “propose six products of value to social scientists, to policymakers and implementers of policy, and to people who want to influence the course of society” (p. 9).
1. Repeated measurement of well-being perceptions can be used to see whether (humans’) lives are betting better or worse.
2. Comparison of groups (e.g., men vs. women, White vs. Black Americans) can be used to examine equity and inequity in well-being.
3. Positive or negative correlations among domains can be informative. For example, marital satisfaction may be positively or negatively correlated to each other, and this evidence has been used to study work-family or work-live balance.
4. It is possible to see how much well-being perceptions are based on more objective aspects of life (job, housing) versus more abstract aspects such as values or meaning.
5. It is informative to see what domains have a stronger influence on well-being perceptions, which shows people’s values and priorities.
6. It is important to know whether people appreciate actual improvement. For example, a drop in crime rates is more desirable if citizens also feel safer. “The appreciation of life’s conditions would often seem to be as important as what those conditions actually are” (p. 10).
One may justifiably claim, then, that people’s evaluations are terribly important: to those who would like to raise satisfactions by trying to meet people’s needs, to those who would like to raise dissatisfactions and stimulate new challenges, to those who would suppress or reduce feelings and public expressions of discontent, and above all, to the individuals themselves. It is their perceptions of their own well-being, or lack of well-being, that ultimately define the quality of their lives (p. 10).
BASIC CONCEPTS AND A CONCEPTUAL MODEL
The most important contribution of A&W is their conception of well-being as a broad evaluations of important life domains. We might think about a life as a pizza with several slices that have different toppings. Some are appealing (say ham and pineapple) and some are less appealing (say sardines and olives). Well-being is conceptualized as the sum or average of evaluations of the different slices. This view of well-being is now called the bottom-up model after Diener (1984).
We conceive of well-being indicators as occurring at several levels of specificity. The most global indicators are those that refer to life as a whole; they are not specific to anyone particular aspect of life (p. 11).
Mostly forgotten is A&W’s distinction between life domains and criteria.
Domains and Criteria
Domains are essentially different slices of the pizza of life such as work, family, health, recreation.
Criteria are values, standards, aspirations, goals, and-in general-ways of judging what the domains of life afford. In modern research, they are best represented by models of human values or motives, such as Schwartz’s model of human values. Thus, life domains or aspects can be desirable or undesirable because the foster or block fulfillment of universal needs for safety, freedom, pleasure, connectedness, and achievement to name a few.
The quality of life is not just a matter of the conditions of one’s physical, interpersonal and social setting but also a matter of how these are judged and evaluated by oneself and others. The values that one brings to bear on life are in themselves determinants of one’s assessed quality of life. Leave the situations of life stable and simply alter the standards of judgment and one’s assessed quality of life could go up or down according to the value framework. (p. 13).
A Conceptual Model
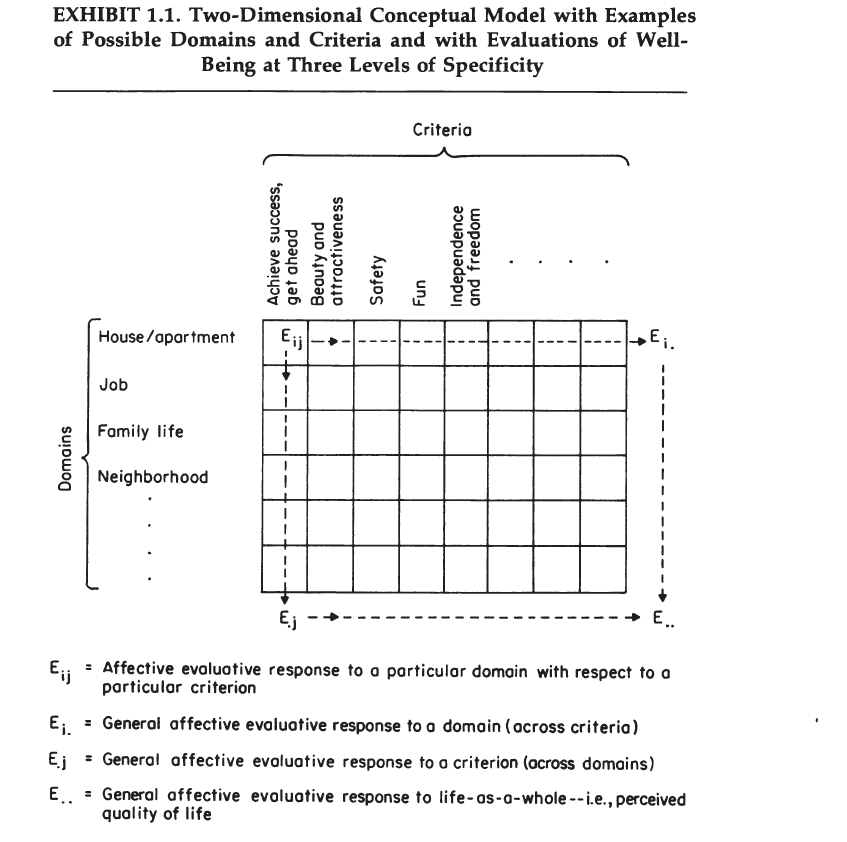
A&W’s Exhibit 1.1 shows a grid of life domains and evaluation criteria (values). According to their bottom-up model, perceptions of well-being are an integrated summary of these lower-order evaluations of specific life domains.
“The diagram is also intended to imply that global evaluations-i.e., how a person feels about life as a whole-may be the result of combining the domain evaluations or the criterion evaluations” (p. 14)
METHODS AND DATA
The Measurement of Affective Evaluations
A&W proposed that perceptions of well-being are based on two modes of evaluation.
The basic entries in the model, just described, are what we designate as “affective evaluations.” The phrase suggests our hypothesis that a person’s assessment of life quality involves both a cognitive evaluation and some degree of positive and/or negative feeling, i.e., “affect.”
One mode is cognitive and could be performed by a computer. Once objective circumstances are known and there are clear criteria for evaluation, it is possible to compute the discrepancy. For example, if a person needs $40,000 a year to afford housing, food, and basic necessities, an income of $20,000 is clearly inadequate, whereas an income of $70,000 is more than adequate. However, A&W also propose that evaluations have a feeling or affective component. That is, the individual who earns only $20,000 may feel worse about their income, while the individual with a $70,000 income may feel good about their income.
Not much progress has been made in terms of distinguishing affective or cognitive evaluations, especially when it comes to evaluations of specific life domains. One problem is that it is difficult to measure affective reactions and that self-reports of feelings may simply be cognitive judgments. It is therefore easier to think about well-being “perceptions” as evaluations, without trying to distinguish between cognitive and affective evaluations.
Both global and more specific evaluations are measured with rating scales. A&W favored the delighted-terrible scale, but it didn’t catch on. Much more commonly used is Cantril’s Ladder or life-satisfaction or happiness questions.
In the next section of this interview/questionnaire we want to find out how you feel about various parts of your life, and life in this country as you see it. Please tell me the feelings you have now-taking into account what has happened in the last year and what you expect in the near future.
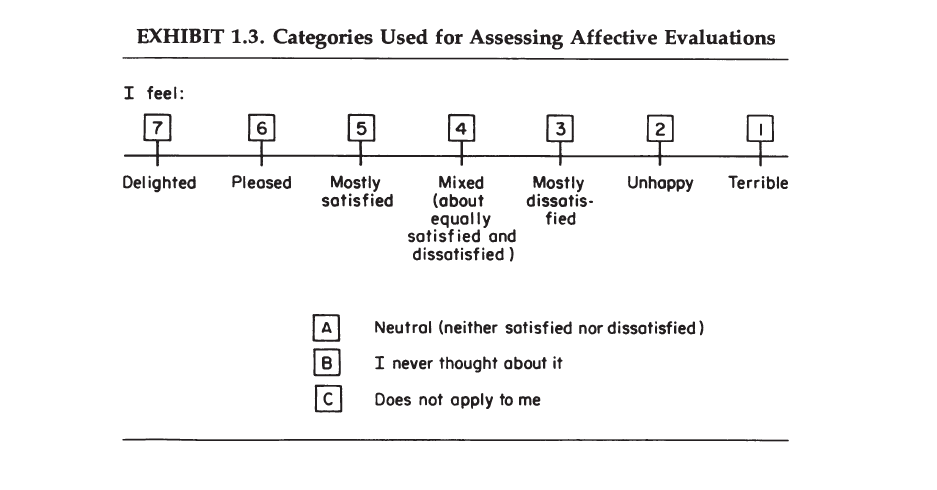
A&W were concerned that a large proportion of respondents’ report high levels of satisfaction because they are merely satisfied, but not really happy or delighted. They also wanted a 7-point scale and suggested that more categories would not produce more sensitive responses, while a 7-point scale is clearly preferable to the 3-point happiness measure that is still used in the General Social Survey. They also wanted a scale where each response option is clearly labelled, while some scales like Cantril’s ladder only label the most extreme options (best possible life, worst possible life).
Data Sources
A&W conducted several cross-sectional surveys.

CHAPTER 2: Identifying and Mapping Concerns
Research Strategy
The basic strategy of our approach was first to assemble a very large number of possible life concerns and to write questionnaire items to tap people’s feelings, if any, about them. Then, having administered these items to broad samples of Americans, we used the resulting data to empirically explore how people’s feelings about these items are organized.
IDENTIFYING CONCERNS
The task of identifying concerns involved examining four different types of
sources.
One source was previous surveys that had included open questions about
people’s concerns. Two examples of such items are:
All of us want certain things out of life. When you think about what really
matters in your own life, what are your wishes and hopes for the future? In
other words, if you imagine your future in the best possible light, what
would your life look like then, if you are to be happy? (Cantril, 1965)
In this study we are interested in people’s views about many different
things. What things going on in the United States these days worry or
concern you? (Blumenthal et aI., 1972)
In our search for expression of life concerns, we examined data from these very general unstructured questions in eight different surveys.
A second type of source was structured interviews, typically lasting an hour or two with about a dozen people of heterogeneous background.
A third type of source, particularly useful for expanding our list of criterion-type concerns, was previously published lists of values.
This information was used to create items that were administered in some of the surveys.

MAPPING THE CONCERNS
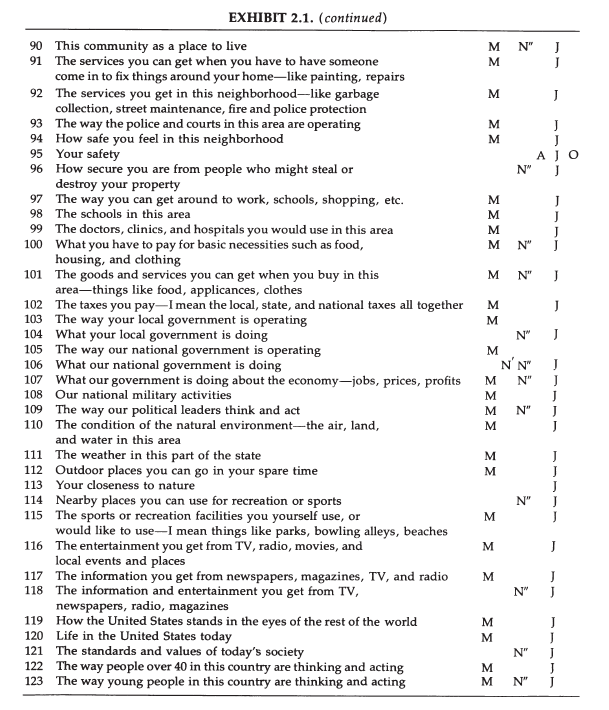
Given the list of 123 concern items, the next step was to explore how they fit
together in people’s thinking.
Maps and the Mapping Process

Selecting and Clustering Concern-Level Measures
A&W’s work identified clusters of concerns that are often included in surveys of domain satisfaction such as work (green), recreation (orange), standard of living (purple), housing (light blue), health (red), and family (dark blue).

The map for criteria, shows that the most central values are hedonism (having fun), achievement, acceptance and affiliation (accept by other) and freedom.
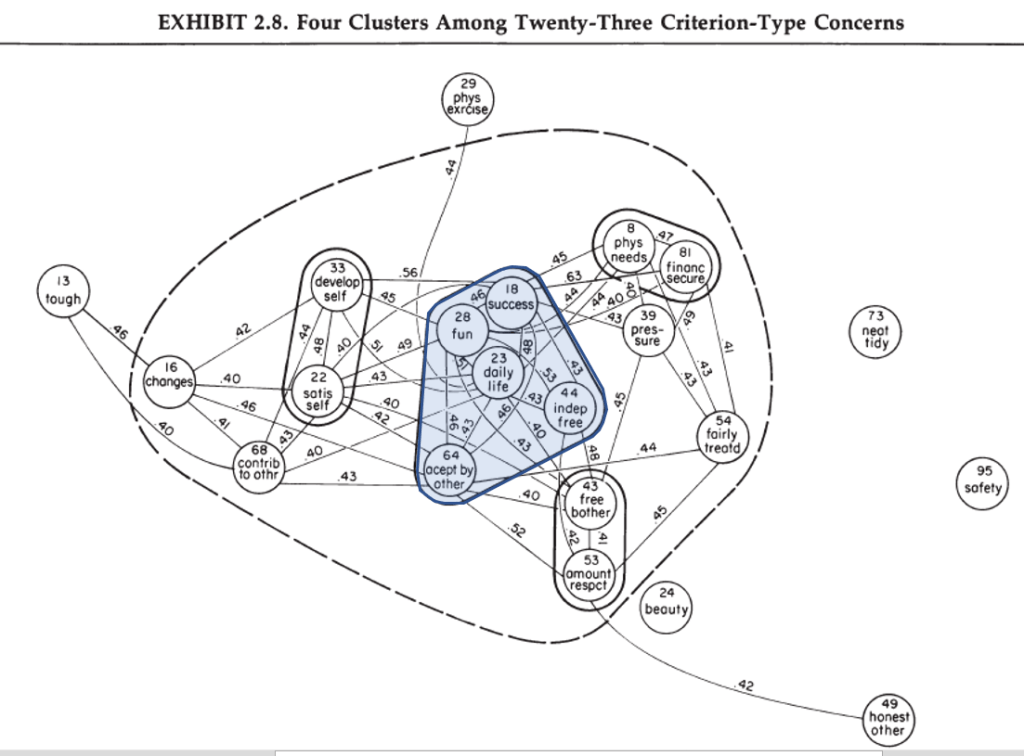
These findings are consistent with modern conceptions of well-being as the freedom to seek pleasure and to avoid pain (Bentham).
CHAPTER 3: Measuring Global Well-Being
A&W compiled 68 items that had been used to measure global well-being.
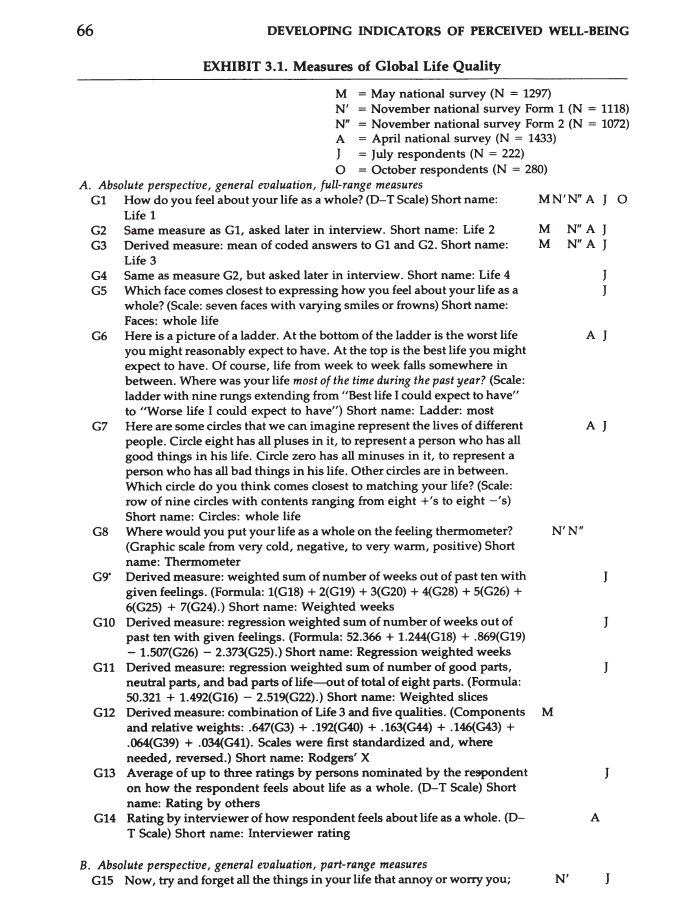


Formal Structure of the Typology
A&W provided a taxonomy of the various global measures.
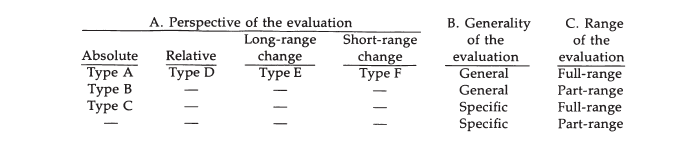
Accordingly, measures can differ in the perspective of the evaluation, the generality of the evaluation, and the range of the evaluation. For the measurement of global well-being general measures that cover the full-range from an absolute perspective are most widely used.
“We find that the Type A measures, involving a general evaluation of the respondent’s life-as-a-whole from an absolute perspective, tend to cluster together into what we shall call the core cluster” (p. 76).
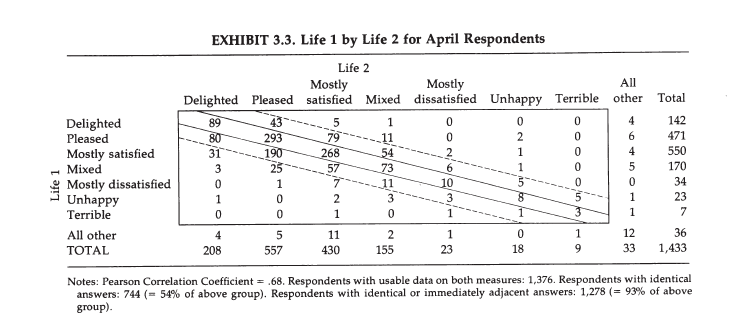
A study of the retest stability for the same item in the same survey showed a retest correlation of r = .68. This estimate for the reliability of a single global well-being rating has been replicated in numerous studies (see Ansic & Schimmack, 2005; Schimmack & Oishi, 2005; for meta-analyses).
A&W also provided some evidence about measurement invariance across subgroups (gender, racial groups, age groups) and found very similar results.
“The results (not shown) indicated very substantial stabilities across the subgroups. In nearly all cases the correlations within the subgroups were within 0.1 of the correlations within the total population.” (p. 83).
The next results show that different global well-being measures tend to be highly correlated with each other. Exceptions are the 3-point happiness scale in the GSS, which lacks sensitivity, and the affect measure because affect measures show some discriminant validity from life evaluations (Zou, Schimmack, & Gere, 2013). That is, an individuals’ perception of well-being is not fully determined by their perception of how much pleasure versus displeasure they experienced.

A principal component analysis showed items with high loadings that best capture the shared variance among global well-being measures.

The results show that the 7-point delighted-terrible (Life 1, Life 2) or a 7-point happiness scale capture this variance well.
These results lead A&W to conclude that these measures are valid and useful indicators of well-being.
“We believe the Type A measures clearly deserve our primary attention. Thus, it is reassuring to find that the Type A measures provide a statistically defensible set of general evaluations of the level of current wellbeing” (p. 106).
CHAPTER 4: Predicting Global Well-Being: I
A&W argue that statistical predictors of global well-being ratings provide useful information about the cognitive processes (what is going on in the minds of respondents) underlying well-being ratings.
Finding a statistical model that fits the data has real substantive interest, as well as methodological, because in these data the statistical model can also be considered as a psychological model. Not only is the model that method of combining feelings that provides the best predictions, it is also our best indication of what may go on in the minds of the respondents when they themselves combine feelings about specific life concerns to arrive at global evaluations. Thus, our statistical model can also be considered as a simulation of psychological processes (p. 109).
This assumption is reasonable as ratings are clearly influenced by some information in memory that is activated during the formation of a response. However, the actual causal mechanism can be more complicated. For example, job satisfaction may be correlated with global well-being only because respondents’ think about income and income satisfaction is related with job satisfaction. Moreover, Diener (1984) pointed out that causality may flow from global well-being to domain satisfaction, which is now called a top-down process. Thus, rather than job satisfaction being used to make a global well-being judgment, respondents’ affective disposition may influence their job satisfaction.
A&W’s next finding has been replicated and emphasized in many review articles on well-being.
The prediction of global well-being from the demographic characteristics of the respondents produced straightforward results that have proved surprising to some observers: The demographic variables, either singly or jointly, account for very little of the variance in perceptions of global well-being (less than 10 percent), and they add nothing to what can be predicted (more accurately) from the concern measures (p. 109).
This finding has also been misinterpreted as evidence that objective life circumstances have a small influence on well-being. The problem with this interpretation is that demographic variables do not represent all environmental influences and many of them are not even environmental factors (e.g., sex, age, race). It is true, however, that there are relatively small differences in well-being perceptions across different groups. The main exception is a persistent gap in well-being of White and Black Americans (Iceland & Ludwig-Dehm, 2019).
A&W conducted numerous tests to look for non-linear relationships. For example, only very low income satisfaction or health satisfaction may be related to global well-being if moderate levels of income or health are sufficient to be satisfied with life. However, they found no notable non-linear relationships.
However, after examining many associations between feelings about specific life concerns and life-as-a-whole, we conclude that substantial curvilinearities do not occur when affective evaluations are assessed using the DelightedTerrible Scale (p. 110).
Exhibit 4.1 shows simple linear correlations of various life concerns with the averaged repeated ratings on the Delighted-Terrible scale (Life 3).
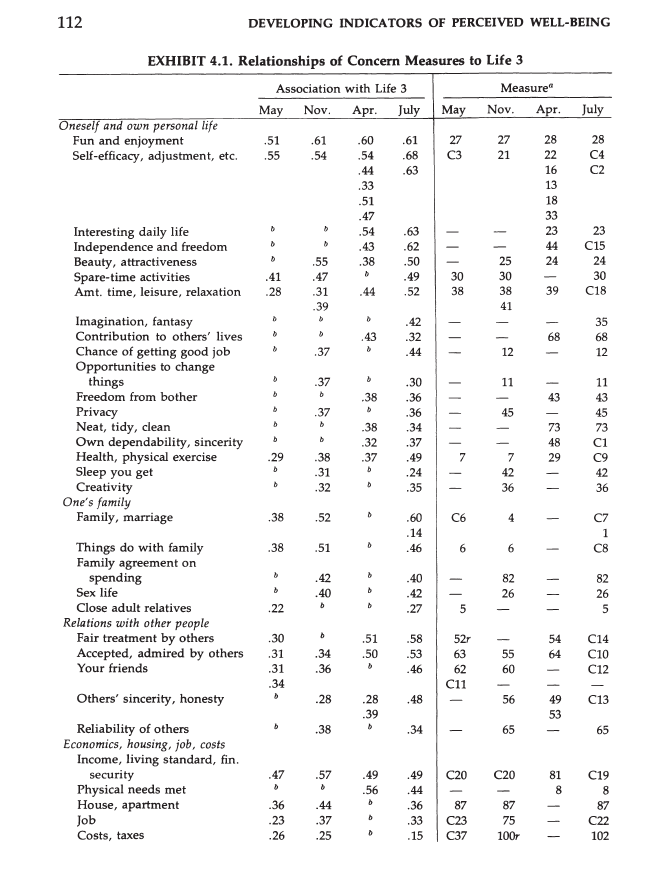
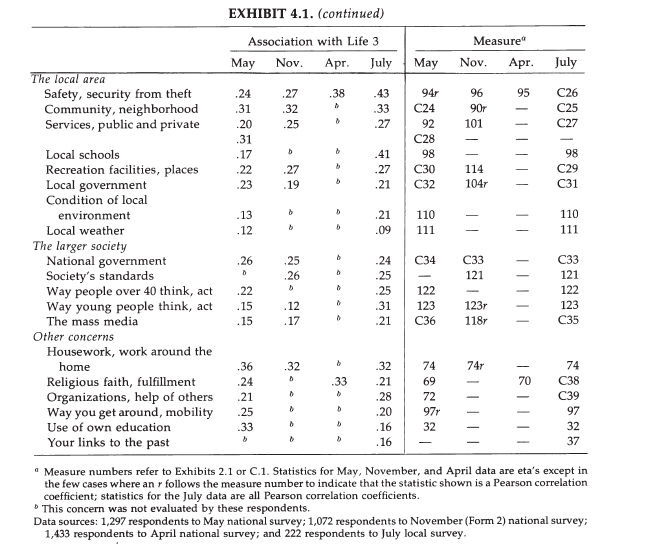
The main finding is that all correlations are positive, most are moderate, and some are substantial (r > .5), such as the correlations for fun/enjoyment, self-efficacy, income, and family/marriage.
It is important to interpret differences in the strength of correlations with caution because several factors influence how strong these correlations are. One factor is the amount of variability in a predictor variable. For example, while incomes can vary dramatically, the national government is the same for everybody. Thus, there is no variability in government that can produce variability in well-being across respondents; although perceptions of government can vary and could influence well-being perceptions. Keeping this caveat in mind, the results suggest that concerns about standard of living and family life seem to matter most. Interestingly, health is not a major factor, but once again, this might simply reflect relatively small variability in actual health, while health may become more of a concern later in life.
Nevertheless, while the causal processes that produce these correlations are unclear, any theory of well-being has to account for this robust pattern of correlations. between global well-being perceptions and concerns.

MULTIVARIATE PREDICTION OF LIFE 3
Regression analysis aims to identify variables that make a unique contribution to the prediction of an outcome. That is, they share variance with the outcome that is not shared by other predictor variables.
As mentioned before, there was no evidence of marked non-linearity, so all variables were entered as measured without transformation or quadratic terms. A&W also examined potential interaction effects, but did not find evidence for these either.
Weighting Schemes
One of the most important analyses was the exploration of different weighting schemes. Intuitively, it makes sense that some domains are more important than others (e.g., standard of living vs. weather). If this is the case, a predictor that weights standard of living more should be a better predictor of well-being than a predictor that weights all concerns equally.
A&W found that a simple average of 12 concerns was highly correlated with the global measure.
Several explorations provide consistent and clear answers to these questions. A simple summing of answers to any of certain alternative sets of concern items (coded from 1 to 7 on the Delighted-Terrible Scale) provides a prediction of feelings about life-as-a-whole that correlates rather well with the respondent’s actual scores on Life 3. Using twelve selected concerns12 (mainly domains) and data from the May respondents, this correlation was .67 (based on 1,278 cases); using eight selected concerns13 (all criteria) and data from the April respondents, the correlation was .77 (based on 1,070 cases). These relatively high values obtain in subgroups of the population as well as in the population as a whole: When the sum of answers to eight of the April concern items was correlated with Life 3 in twenty-one different subgroups of the national adult population, the correlation was never lower than .70 nor higher than .82. (p. 118).
However, more important is the question whether other weighing schemes produce higher correlations, and the important finding is that optimal weights (using regression coefficients) produced only a small improvement in the multiple correlation.
What is extremely interesting is that the optimally weighted combination of concern measures provides a prediction of Life 3 that is, at most, only modestly better than that provided by the simple sum. In the May data, the previous correlation of .67 could be increased to .71 by optimally weighting the twelve concern measures.
A&W conclude that a model with equal weights is a parsimonious and good model of well-being.
Our conclusion is that the introduction of weights when summing answers to the concern measures is likely to produce a modest improvement, but that even a simple sum of the answers provides a prediction that is remarkably close to the best that can be statistically derived.
However, the use of a fixed regression weight implies that all respondents attach the same importance of different domains. It is plausible that this is not the case. For example, some people live to work and others work to live. So, work would have different importance for different respondents. A&W tested this by asking respondents about the importance of several domains and used this information to weight concerns on a person by person basis. They found that this did not improve prediction.
The significant finding that emerged is that there was no possible use of these importance data that produced the slightest increase in the accuracy with which feelings about life-as-a-whole could be predicted over what could be achieved using an optimally weighted combination of answers to the concern measures alone. Although a number of questions remain with respect to the nature and meaning of the importance measures (some are explored in chap. 7), we have an unambiguous answer to our original question: Data about the importance people assign to concerns did not increase the accuracy with which
feelings about life-as-a-whole could be predicted (p. 119).
This surprising result has been replicated numerous times (Rohrer & Schmukle, 2018). However, nobody has attempted to explain why importance weights do not improve prediction. After all, it is theoretically nonsensical within A&W’s theoretical framework to say that work, family, and health are very important, to be extremely dissatisfied in these domains, and then to report high global well-being. If global well-being judgments are, indeed, based on information about concerns and life domains, then important life domains should have a stronger relationship with global well-being ratings than unimportant domains (cf. Schimmack, Diener, & Oishi, 2002).
While I share A&W’s surprise, I am much less pleased by this finding.
Our results point to a simple linear additive one, in which an optimal set of weights is only modestly better than no weights (i.e. equal weights).19 We confess to both surprise and pleasure at these conclusions (p. 120).
A&W are pleased because a simple additive, linear model is simple and science favors simple models, when they fit actual data reasonably well, which seems to be the case here.
However, A&W are too quick to interpret their results as support for their bottom-up model of well-being, where everybody weights concerns equally and well-being perceptions depend only on the relative standing in life domains (good job, happy marriage, etc.).
Interpreted in this light, the linear additive model suggests that somehow individuals themselves “add up” their joys and sorrows about specific concerns to arrive at a feeling about general well-being. It appears that joys in one area of life may be able to compensate for sorrows in other areas; that multiple joys accumulate to raise the level of felt well-being; and that multiple sorrows also accumulate to lower it.
In discussing these findings with various colleagues and commentators, the question has sometimes been raised as to whether the model implies a policy of “give them bread and circuses.” The model does suggest that bread and circuses are likely to increase a population’s sense of general well-being. However, the model does not suggest that bread and circuses alone will ensure a high level of well-being. On the contrary, it is quite specific in noting that concerns that are evaluated more negatively than average (e.g., poor housing, poor government, poor health facilities, etc.) would be expected to pull down the general sense of well-being, and that multiple negative feelings about life would be expected to have a cumulative impact on general well-being.
At least at this stage of the investigation in Chapter 4 other, more troubling interpretations of the results are possible. Maybe most of the variance in these evaluative judgments are response biases and social desirable responding. This alone could produce strong correlations and they would be independent of the actual concerns that are being rated. Respondents could rate the weather on Mars and we would still see that those who are more satisfied with the weather on Mars have higher global well-being.
However, A&W’s subsequent analyses are inconsistent with their conclusions. Exhibit 4.2 shows the regression weights for various concerns that are sorted by the amount of unique contribution to the global impressions. It is clear that averaging the top 12 concerns would give a measure that is more strongly related to global well-being than averaging the last 12 concerns. Thus, domains do differ in importance. The results in the last column (E) are interesting because here 12 domains explain 51% of the total variance, but squaring the regression coefficients provides only 17% of variance, which implies that most of the explained variance stems from variance that is shared among the predictor variables. Thus, it is important to examine the nature of this shared variance more closely. In this mode, the first five domains account for 15 of the 17 percent in total. These domains are efficacy, family, money, fun, and housing. Thus, there is some support for the bottom-up model for some domains, but most of the explained variance may stem from shared method variance between concern ratings and well-being ratings.
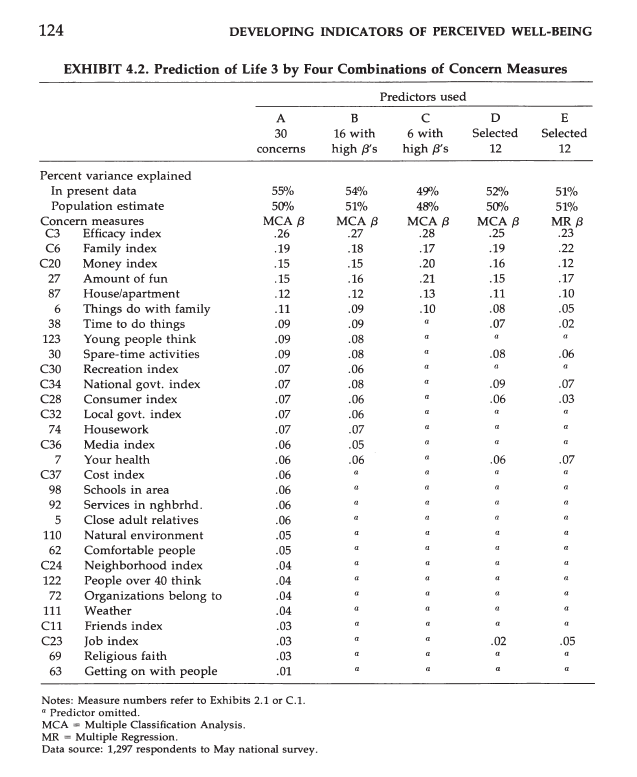

Exhibit 4.3 confirms this with a stepwise regression analysis where concerns are entered according to their unique importance. Self-efficacy alone accounts for 30% of the explained variance. Then family adds 9%, money adds 5%, fun adds 3%, and housing 1%. The remaining variables add less than 1% individually.
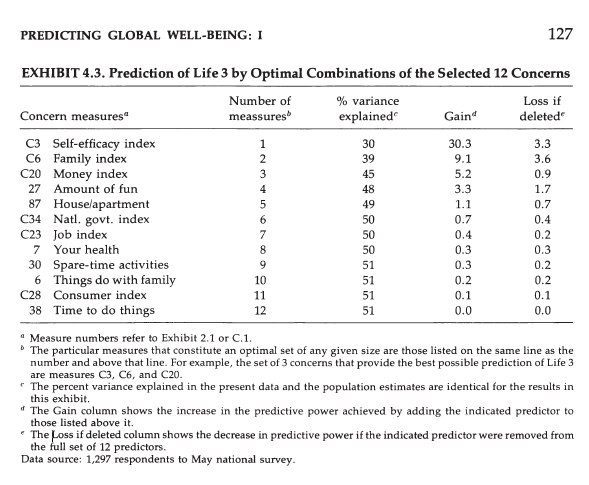
Exhibit 4.4 shows that demongraphic variables are weak predictors of well-being ratings and that these relationships are weakened when concerns are added as predictors (column 3).
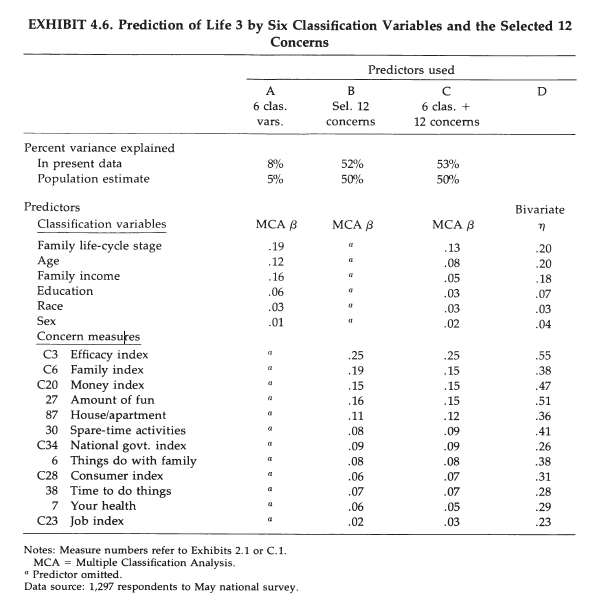
This suggests that effects of demongraphic variables are at least partially mediated by concerns (Schimmack, 2008). For example, the influence of income on well-being ratings could be explained by the effect of income on satisfaction with money, which is a unique predictor of well-being ratings (income -> money satisfaction-> life satisfaction). The limitation of regression analysis is that it does not show which of the concerns mediates the influence of income. A better way to examine mediation is to test mediation models with structural equation modeling (Baron & Kenny, 1986).
A&W draw the conclusion that there are no major differences in perceived well-being between social groups. As mentioned before, this is only partially correct. The GSS shows consistent racial differences in well-being.
“The conclusion seems inescapable that there is no strong and direct relationship between membership in these social subgroups and feelings about life-as-a-whole” (p. 142).
CHAPTER 5: Predicting Global Well-Being: II
Chapter 5 does not make a major novel contribution. It mainly explores how concerns are related to the broader set of global measures. The results show that the findings in Chapter 4 generalize to other global measures.

CHAPTER 6: Evaluating the Measures of Well-Being
Chapter 6 tackles the important question of construct validity. Do global measures measure individuals’ true evaluations of their lives?
How good are the measures of perceived well-being reported in previous chapters of this book? More specifically, to what extent do the data produced by the various measurement methods indicate a person’s true feelings about his life? (p. 175).
A&W note several reasons why global ratings may have low validity.
Unfortunately, evaluating measures of perceived well-being presents formidable problems. Feelings about one’s life are internal, subjective matters. While very real and important to the person concerned, these feelings are not necessarily manifested in any direct way. If people are asked about these feelings, most can and will speak about them, but a few may lie outright, others may shade their answers to some degree, and probably most are influenced to some extent by the framework in which the questions are put and the format in which the answers are expected. Thus, there is no assurance that the answers people give fully represent their true feelings. (p. 176)
ESTIMATION OF THE VALIDITY AND ERROR COMPONENTS OF THE
MEASURES
Measurement Theory and Models
A&W are explicit in their ambition. They want to estimate the proportion of variance in global well-being measures that reflects respondents’ true evaluations of their lives. They want to separate this variance from random measurement error, which is relatively easy, and systematic measurement error, which is hard (Campbell & Fiske, 1959).
The analyses to be reported in this major section of the chapter begin from the fact that the variance of any measure can be partitioned into three parts: a valid component, a correlated (i.e., systematic) error component, and a random error (or “residual”) component. Our general analysis goal is to estimate, for measures of different types, from different surveys, and derived from different methods, how the total variance can be divided among these three components (p. 178).
A “validity coefficient,” as this term is commonly used by social scientists, is the correlation (Pearson’s product-moment r) between the true conditions and the obtained measure of those conditions. The square of the validity coefficient gives the proportion of observed variance that is true variance; e.g., a measure that has a validity coefficient of .8 contains 64 percent valid variance; similarly, a measure that contains 49 percent valid variance has a validity of .7. (p. 179; cf. Schimmack, 2010).
One source of systematic measurement error are response sets such as aquiescence bias. Another one is halo bias.
A special form of bias is what is sometimes known as “halo.” One would hope that a respondent, when answering a series of questions about different aspects of something-e.g., his own life, or someone else’s life-would distinguish clearly among those aspects. Sometimes, however, the answers are substantially affected by the respondent’s general impression and are not as distinct from one another as an external observer might think they should be. This is particularly likely to happen when the respondent is not well acquainted with the details of what is being investigated or when the questions and/or
answer categories are themselves unclear. Of course, “halo,” which produces an undesired source of correlation among the measures, must be distinguished from the sources of true correlation among the measures. (p. 179).
Exhibit 6.1 uses the graphical language of structural equation modelling to illustrate the measurement model. Here the oval on the left represents the true variation in well-being perceptions in a sample. The boxes in the middle represent two measures of well-being (e.g., two ratings on a delighted-terrible scale). The oval on the right reflects sources that produce systematic measurement error (e.g., halo bias). In this model, the observed correlation is the retest reliability of a single global measure and it is a function of the strength of the causal effects of the true variance (path a and a’) and the systematic measurement (b and b’) on the two measures.
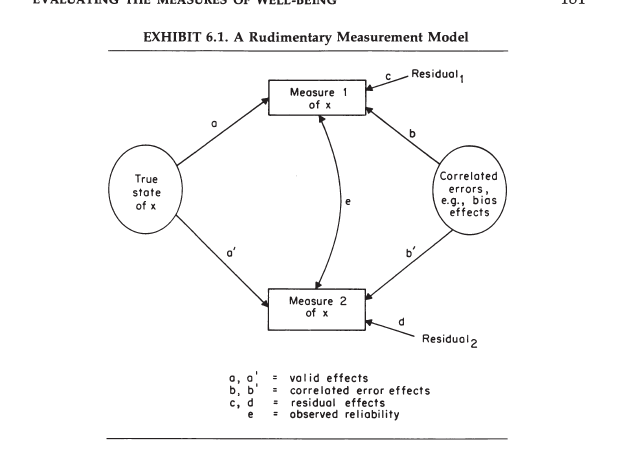
The problem with this model is that there is only one observed correlation and two possible causal effects (assuming equal strength for a and a’, and b and b’). Thus, it is unclear how much of the reliable variance reflects actual variation in true well-being.
To make empirical claims about the validity of global well-being ratings, it is necessary to embed them in a network of variables that shows theoretically predicted relationships. Within a larger set of variables, the path from the construct to the observed measures may be identifiable (Cronbach & Meehl, 1955; Schimmack, 2019).
Estimates Derived from the July Data
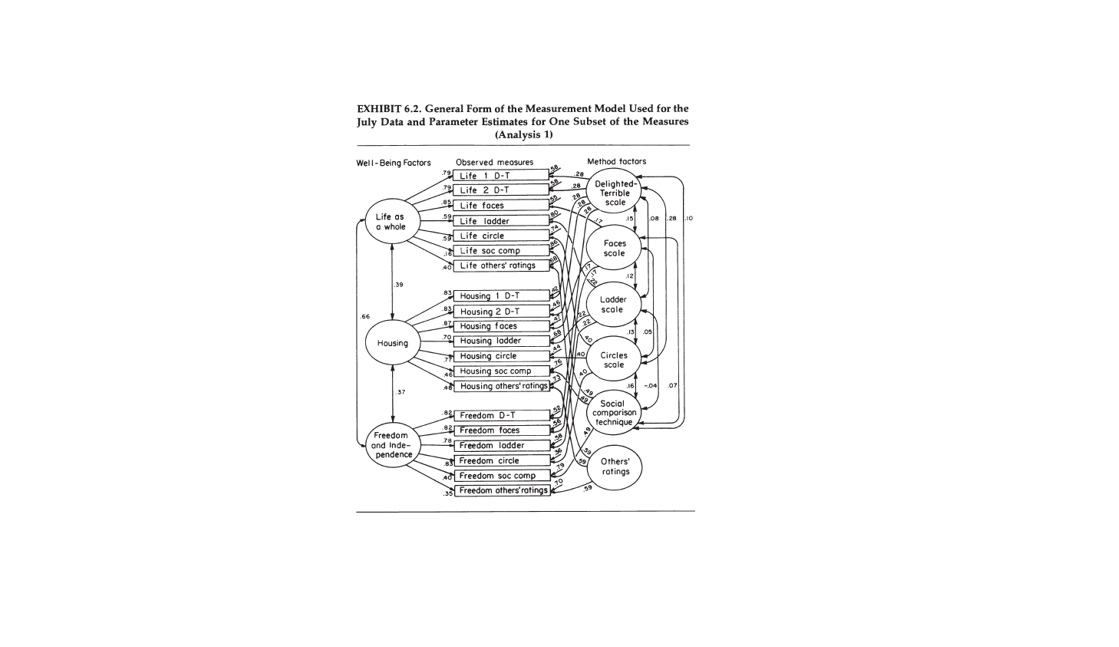
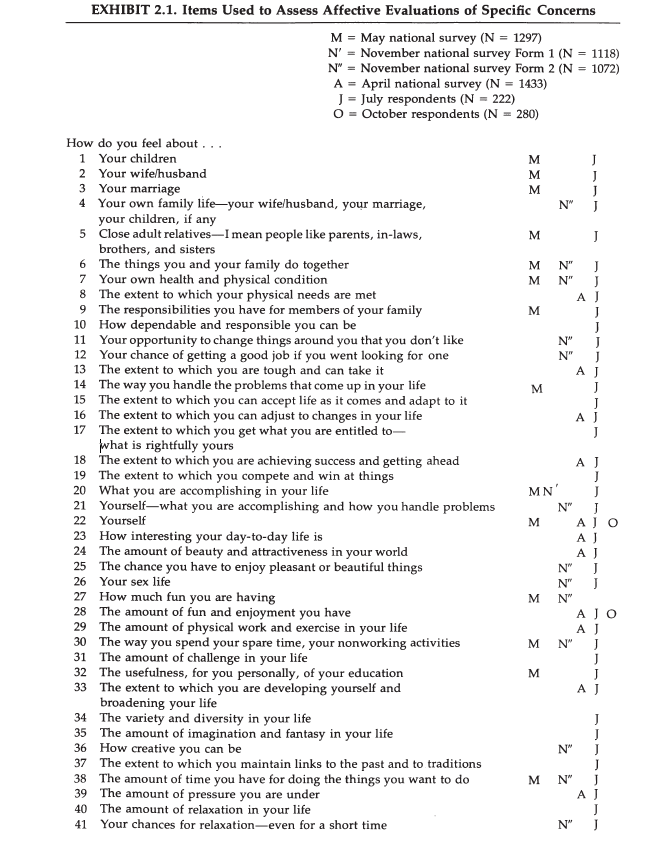
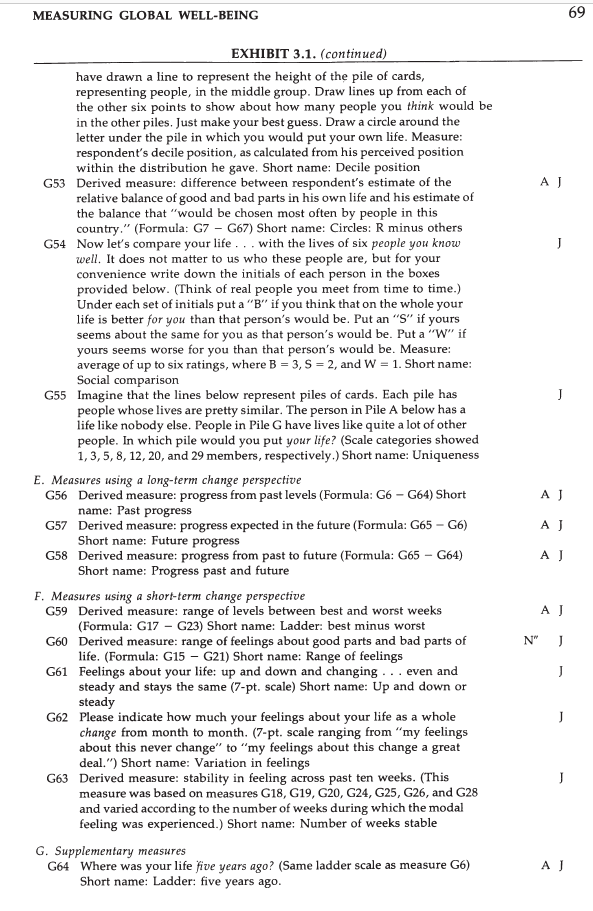
Scattered throughout the July questionnaire was a set of thirty-seven items that, when brought together for the purposes of the present analysis, forms a nearly complete six-by-six multimethod-multitrait matrix; i.e., a matrix in which six different “traits” (aspects of well-being) are assessed by each of six different methods. (p. 183)
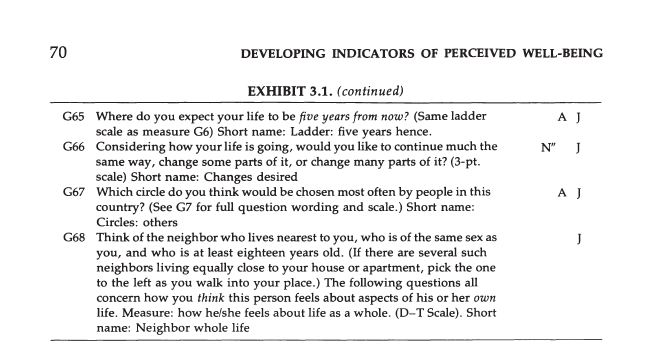
The concerns were chosen to be well spread in the perceptual structure (as shown in Exhibit 2.2) and to include both domains and criteria. The following six aspects of well-being are represented: Life-as-a-whole, House or apartment, Spare-time activities, National government, Standard of living, and Independence or Freedom. The six measurement methods involve: self-ratings on the Delighted-Terrible, Faces, Circles, and Ladder Scales, the Social Comparison technique, and Ratings by others. (The exact wording of each of the concern-level items appears in Exhibit 2.1; see items 3D, 44, 85, 87, and 105. For descriptions of the six methods used to assess life-as-a-whole, see Exhibit 3.1, measures G1, G5, G6, G7, G13, and G54, these same methods were also used to assess the concern-level aspects. (p. 184).
Exhibit 6.2 shows the partial structural equation model for the global ratings and two domains. The key finding is that the correlations between residuals of the same rating scale tend to be rather small, while the validity coefficients are high. This seems to suggest that most of the reliable variance in global and domain measures is valid variance rather than systematic measurement error.

As much as I like Andrews and Withey’s work and recognize their contribution to well-being science in its infancy, I am disappointed by their discussion of the model.
Because the model shown in Exhibit 6.2 incorporates our theoretical expectations about how various phenomena influenced the validity and error components of the observed measures, because serious alternative theories have not come to our attention, and because the model in fact fits the data rather well (as will be described shortly), it seems reasonable to use it to estimate the validity and error components of the measures (p. 187)
On the basis of these results we infer that single item measures using the D-T, Faces, or Circles Scales to assess any of a wide range of different aspects of perceived well-being contain approximately 65 percent valid variance (p. 189).
Their own discussion of halo bias suggests that their model fails to account for systematic measurement error that is shared by different rating formats (Schimmack, , Böckenholt, & Reisenzein, 2002). It is well known that response sets have a negligible influence on ratings, but halo bias has a stronger influence.
It is important that the model actually includes measures that are based on the aggregated ratings of three informants that knew the respondent well (others’ rating). This makes the study a multi-method study that not only varies the response format, but also the rater. Other research has shown that halo bias is rather unique to a single rater (Anusic et al., 2009). Thus, halo bias cannot inflate correlations between respondents’ self-ratings and ratings by others. The problem is that a model with two-methods is unstable. It is only identified here because there are multiple self-ratings. In this case, halo bias can be hidden in higher loadings of the self-ratings on the true well-being factor than the other’ ratings. This is clearly the case. The loading for the informant ratings , as ratings by others’ are typically called, for global well-being is only .40, despite the fact that it is an average of three ratings and averaging increases validity. Based on the factor loadings, we can infer that the self-informant correlations are .4 * .8 = .32, which is in line with meta-analytic results from other studies (Schneider & Schimmack, 2009). A&W’s model gives the false impression that self-ratings are much more valid than informant ratings, but models that can test this assumption by using each informant as a separate method show that this is not the case (Zou et al., 2013). Thus, A&W’s work may have given a false impression about the validity of global well-being ratings. While they claimed that two-thirds of the variance is valid variance, other studies suggest it is only one-third, after taking halo bias into account.
A&W’s model shows high residual correlations among the three others’ ratings of life, housing, and freedom. They interpret this finding as evidence that halo bias has a strong influence on informant ratings.
The relatively high method effects in measures obtained from Others’ ratings is notable, but not terribly surprising. Since other people have less direct access to the respondents’ feelings than do the respondents themselves, one would expect substantially more “halo” in the Others’ ratings than in the respondents’ own ratings. This would be a reasonable explanation for the large amount of correlated error in these scores. (p. 189).
However, if these concerns are related to global well-being, but informant ratings have low loadings on the true factors, the model has to find another way to relate informant ratings of related to domains. The model is unable to test whether these correlations reflect bias or valid relationships. In contrast, other studies find no evidence that halo bias is considerably less present in self-ratings than in informant ratings (Anusic et al., 2009; Kim, Schimmack, & Oishi, 2012).
It is unfortunate that A&W and many researchers after them aggregated informant ratings, instead of treating informants as separate methods. As a result, 30 years of research failed to provide information about the amount of valid variance in self-ratings and informant ratings, leaving A&W’s estimate of 65% and 15% unquestioned. It was only in 2013, when Zou et al. (2013) showed that family members are as valid as the self in ratings of global well-being and that the proportions of variance are more equal around 30-40% valid variance for both. Self-ratings are only more valid when informant ratings are obtained from recent friends with less than two years of acquaintance (Schneider et al., 2010).
The low validity of informant ratings in A&W’s model led them to suggest that people are rather private about their true feelings about live.
What is of interest is that even people who the respondents felt knew them pretty well were in fact relatively poor judges of the respondents’ perceptions. This suggests that perceptions of well-being may be rather private matters. While people can-and did-give reasonably reliable answers (and, we estimate reasonably valid answers) regarding their affective evaluations of a wide range of life concerns, it would seem that they do not communicate their perceptions even to their friends and neighbors with much precision (p. 191).
While this may be true for neighbors, it is not true for family members. Moreover, other studies have found stronger correlations when informant ratings were aggregated across more informants and when informants are family members rather than neighbors (Schneider & Schimmack, 2009), and these stronger correlations have been used as evidence for the validity of self-ratings (Diener, Lucas, Schimmack, & Helliwell, 2009). Based on the same logic, A&W results would undermine the use of informant ratings as evidence of convergent validity of self-ratings.
There are several reasons why the modes validity of global well-being ratings has been ignored. First, it seems plausible that self-ratings are more valid because individuals have access to all of the relevant information. They know how things are going in their lives and they know what is important to them. In contrast, it is virtually certain that informants do not have access to all of the relevant information. However, these differences in accessibility of relevant information do not automatically ensure that self-ratings are more valid. This would only be the case if respondents are motivated to engage in an exhaustive search that retrieves all of the relevant information. This assumption has been questioned (Schwarz & Strack, 1999). Thus, we cannot simply assume that self-ratings are valid. The aim of validation research is to test this assumption. A&W’s model was unable to test it because they had several self-ratings and only one aggregated other-rating as indicators.
The second reason may be self-serving interest. The assumption that a single-item happiness rating can be used to measures something as complex and important as an individuals’ well-being makes these ratings very appealing for social scientists. If the assessment of well-being would require a complex set of questions about 20 life-domains with 10 criteria, it would be impossible to survey the well-being of nations and populations. The reason well-being is one of the most widely studied social constructs across several disciplines is that a single happiness item was easy to add to a survey.
DISTRIBUTIONS PRODUCED BY THE MORE VALID METHODS
A&W also examine and care about the distribution of responses. They developed the delighted-terrible scale because they observed that even on a 7-point satisfaction scale responses clustered at the top.
Our data clearly show that the Delighted-Terrible Scale produces greater differentiation at the positive end of the scale than the seven-point Satisfaction Scale (p. 207).
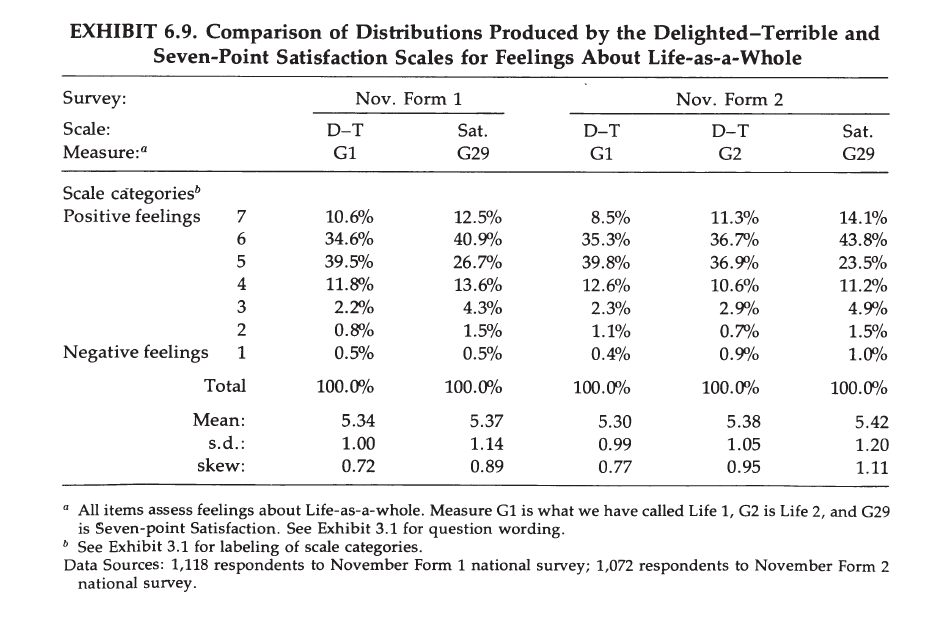
However, the differences that they mention are rather small and both formats produce similar means.
RELATIONSHIPS BETWEEN MEASURES OF PERCEIVED WELL-BEING AND OTHER TYPES OF VARIABLES
a reasonably consistent and not very surprising pattern emerged. Nearly always, relationships were in the “expected” direction, and most were rather weak (p. 214).
However, these weak correlations were systematic and stronger when researchers expected stronger correlations.
“Where concerns had been judged relevant to the other items, the average correlation was .31; where staff members had been uncertain as to the concerns’ relevance, the average correlation was .25; and where concerns had been judged irrelevant the average correlation was .15″ (p. 214).
The problem is that A&W interpreted these results as evidence that perceived well-being is relatively independent of life conditions or actual behaviors.
Our general conclusion is that one will not usually find strong and direct relationships
between measures of perceived well-being and reports of most life conditions or
behaviors (p. 214).
This conclusion is partially based on the false inference that most of the variance in well-being ratings is valid variance. Another problem is that well-being is a broad construct and that a single behavior (e.g., sexual frequency; cf. Muise, Schimmack, & Impett, 2016) will only influence a small slice of the pizza of life. Other designs like twin studies or studies of spouses who are exposed to similar life circumstances are better suited to make claims about the importance of life conditions for well-being (Schimmack & Lucas, 2010). If differences in life circumstances do not explain variation in perceptions of well-being, what else could produce these differences? A&W do not address this question.
It would be naive to think that a person’s feelings about various aspects of life could be
perfectly predicted by knowing only the characteristics of the person’s present
environment. Developing adequate explanations for why people feel as they do
about various life concerns would be a challenging undertaking in its own
right. While we believe this could prove scientifically fruitful, such an investigation
is not part of the work we are presently reporting.
This question became the focus of personality theories of well-being (Costa & McCrae, 1980; Diener, 1984) and it is now well-established that stable dispositions to experience more pleasure (positive affect) and less displeasure (negative affect) contribute to perceptions of well-being (Schimmack, Oishi, & Diener, 2002;
CHAPTER 7: Exploring the Dynamics of Evaluation
Explorations 1 and 2 examine how response categories of different formats correspond to each other.
EXPLORATION 3: HYPOTHETICAL FAMILY INCOMES AND AFFECTIVE EVALUATIONS ON THE D-T SCALE
This exploration examined response options on the delighted-terrible scale in relation to hypothetical income levels.

The dollar amounts would need to be translated into current dollar amounts to be meaningful. Nevertheless, it is surprising how small the gaps are even for the highest, delighted, category.
EXPLORATION 6: AN IMPLEMENTATION OF THE DOMAINS-BY-CRITERIA MODEL

Design of the Analysis and Measures Employed
A&W wrote items for each of the 48 cells in the 6 domains x 8 criteria matrix. They found that all items had small to moderate correlations with the global measure.
“The fortyeight correlations involved range from .13 to .41 with a mean of .20.”
Domain-criterion items were also more strongly correlated with judgments of the same domain than with other domains.
If the model is right, each concern-level variable should tend to have higher relationships with the cell variables that are assumed to influence it than with other cell variables. This expectation also proves to be supported by the data. For the domains, the average of the forty-eight correlations with “relevant” cell variables is .48 (as noted previously) while the average of the 240 correlations with “irrelevant” cell variables is .20 (p. 236).
For the criteria, a similar but somewhat smaller difference exists: The forty-eight correlations with “relevant” cell variables average .37, while the 320 correlations with “irrelevant” cell variables average .27. Furthermore, these differences are not reversed for any of the fourteen concern measures considered individually (p. 236).
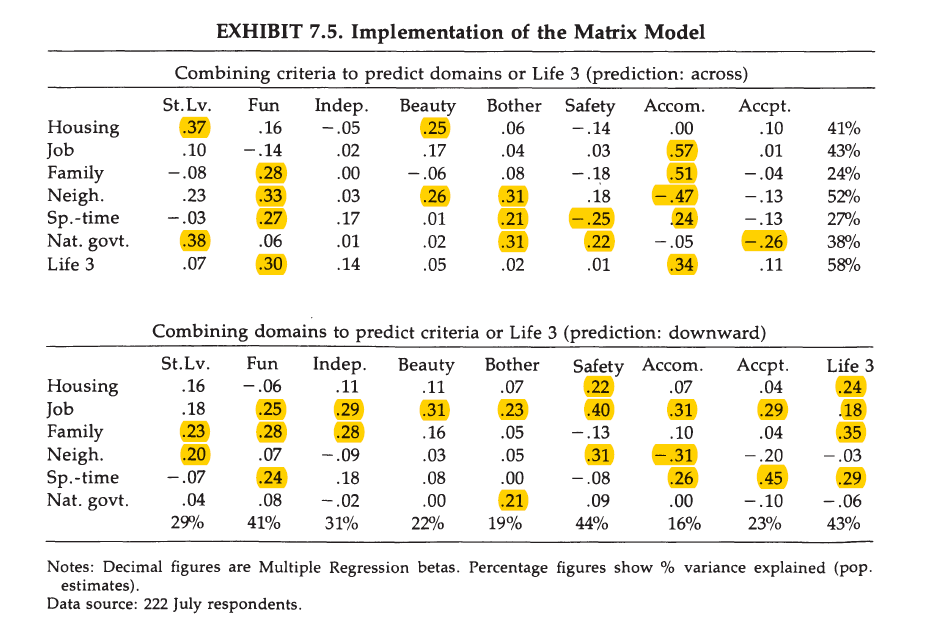
Exhibit 7.5 shows regression weights from a multiple regression with (a) criteria as predictors (top) and with domains as predictors (bottom). At the top, the key criteria are fun and accomplishments. Standard of living matters only for evaluations of housing and national government, beauty for housing and neighbourhood. At the bottom, housing family and free time contribute to fun, and job and free time contribute to accomplishments. Free time probably does so by means of hobbies or volunteering. For life in general, fun and accomplishment (top) and housing, family, free time, and job are the key predictors.
EXPLORATION 7: COMPARISONS BETWEEN ONE’S OWN WELL-BEING AND THAT OF OTHERS
When Life-as-a-whole is being assessed, the consistent finding is that most people think they are better off than either other people in general (“all the adults in the U.S.”) or their nearest same-sexed neighbor. (p. 240).
This finding is probably just the typical better-than-average effect that is obtained for desirable traits. One explanation for it is that people do not overestimate themselves, but rather underestimate others, and do not sufficiently adjust the comparison. After all, if A&W are right we do not know much about the well-being of others, especially when we do not know them well.

Interestingly, the results switch for national government, which receives low ratings. So, here the adjustment problem works in the opposite direction and respondents underestimate how dissatisfied others are with the government.
EXPLORATION 8: JUDGMENTS OF THE “IMPORTANCE” OF CONCERNS
“One of the hypotheses with which we started was that the relative importance a person assigned to various life concerns should be taken into account when combining concern-level evaluations to predict feelings about Life-as-awhole. The hypothesis is based on the expectation that when forming evaluations of overall well-being people would give greater “weight” to those concerns they felt were important, and less weight to those they regarded as less significant. As described in chapter 4, a careful examination of this hypothesis showed it to be untrue.”
In one analysis we looked to see whether the mean importance assigned to a given concern bore any relationship to its association with feelings about Life-as-
a-whole. If our original hypothesis had been correct, one would have expected a high relationship here; feelings about Life-as-a-whole would have had more to do with feelings about the important concerns than with feelings about the others. Using the data from our colleagues’ survey the answer was essentially “no.” Over ten concerns, the rank correlation between mean importance and the size of the simple bivariate relationship (measured by the eta statistic) was – .39: There was a modest tendency for the concerns that had higher relationships to Life-as-a-whole to be judged less important: When we performed the same analysis using a more complex multivariate relationship derived by holding constant the effects of all other nine concerns (measured by the beta statistic from Multiple classification Analysis), the rank correlation was + .15. A similar analysis in the July data produced a rank correlation of + .30 between the importance of concerns and the size of their (bivariate) relationships to the Life 3 measure. It seems clear that the mean importance assigned to a concern has little to do with the relationship between that concern and feelings about Life-as-a-whole (p. 243).
This is a puzzling finding and seems to undermine A&W’s bottom-up model of well-being perceptions. One problem is that Pearson correlations are sensitive to the amount of variance and the distribution of variables. For example, health could be important, but because it is important it is at high levels for most respondents. As a result, the Pearson correlation with perceived well-being would be low, which it actually is. A different kind of correlation coefficient or analysis would be needed for a better test of the hypothesis that more important domains are stronger predictors of well-being perceptions.
Further insight about the meaning of importance judgments emerged when we checked to see whether the importance assigned to a concern has anything to do with the position of the concern in the psychological structure. We compared the importance data for the ten concerns as assessed in our colleagues’ survey with the position of those concerns in the structural maps derived from our own national sample of May respondents (see Exhibit 2.4). There was a distinct tendency for concerns that were closer to Self and Family to
receive higher importance ratings than those that were more remote (rho = .52). When the analysis was repeated using the importance of the concerns as judged by our July respondents, a parallel result emerged (rho = .43). Still a third version of the analysis took the importance of the concerns as judged by the July respondents and checked the location of the concerns in the plot derived from these same respondents (Exhibit 2.2). Here the relationship was somewhat higher (rho = .59). We conclude that importance ratings are substantially linked to the position of the concern in the perceptual structure, and that concerns that are seen as being closely associated with oneself and one’s family tend to be ranked as more important than others. (p. 244)
This is an interesting observation, but A&W do not elaborate further on it. Thus, it remains a mystery why respondents’ rate some domains as more important, but variation in these domains is not a stronger predictor of well-being evaluations.
END OF PART I
Conclusion
A&W provided a groundbreaking and exemplary examination of the construct validity of global well-being ratings. They presented a coherent theory that assumes global well-being judgments are integrative, mostly additive, evaluations of several life domains based on several criteria. Surprisingly, they found that weighing domains by importance did not improve predictions. They also tested a multi-trait-multi-method model to separate valid variance from method variance in well-being ratings. They concluded that two-thirds of the variance in self-ratings is valid, but only 15% of the variance in informant ratings are valid. Based on these results, they concluded that even a single global well-being rating is a valid measure of individuals’ true feelings about their lives, which we would rather call attitudes towards their lives, these days.
It is unfortunate that few well-being researchers have tried to build on A&W’s seminal work. To my knowledge, I am the only one who has fitted MTMM models to self-ratings and informant ratings of well-being to separate valid variance from systematic measurement error. Ironically, A&W’s impressive results may be the reason why further validation research has been neglected. However, A&W made some mistakes in their MTMM model and never explained the inconsistency between the bottom-up theory and their finding that importance weights do not improve prediction. Unfortunately, it is possible that their model was wrong and that a much larger portion of the variance in single-item well-being measures is method variance and that bottom-up effects on these measures are relatively weak and do not reflect the true importance of life circumstances for individuals’ well-being. Health is a particularly relevant domain. According to A&W’s results, variation in health satisfaction has relatively little unique effect on global well-being ratings. Does this really mean that health is unimportant? Does this mean that the massive increase in health spending over the past years is a waste of money? Or does it mean, global life evaluations are not as valid as we think they are and they fail to capture the relative importance of life domains for individuals’ well-being?