In 1984, James J. Conley published one of the most interesting studies of personality stability. However, this important article was published in Personality and Individual Differences and has been ignored. Even today, the article has only 184 citations in WebofScience. In contrast, the more recent meta-analyses of personality stability by Roberts and DelVeccio (2001) has 1,446 citations.

Sometimes more recent and more citations doesn’t mean better. The biggest problem in studies of stability is that random and occasion specific measurement error attenuates observed retest correlations. Thus, observed retest correlations are prone to underestimate the true stability of personality traits. With a single retest-correlation it is impossible to separate measurement error from real change. However, when more then two repeated measurements are observed, it is possible to separate random measurement error from true change, using a statistical approach that was developed by Heise (1969).
The basic idea of Heise’s model is that change accumulates over time. Thus, if traits change from T1 to T2 and from T2 to T3, the trait changed even more from T1 to T3.
Without going into mathematical details, the observed retest correlation from T1 to T3 should match the product of the retest correlations from T1 to T2 and T2 to T3.
For example, if r12 = .8 and r 23 = .8, r13 should be .8 * .8 = .64.
The same is also true if the retest correlations are not identical. Maybe more change occurred from T1 to T2 than from T2 to T3. The total stability is still a function of the product of the two partial stabilities. For example, r12 = .8 and r23 = .5 yields r13 = .8 * .5 = .4.
However, if there is random measurement error, the r13 correlation will be larger than the product of the r12 and r23 correlations. For example, using the above example and a reliability of .8, we get r12 = .8 * .8 = .64, r23 = .4 * .8 = .32 and the product is .64 * .32 = .20, while the actual r13 correlation is .32 * .8 = .256. Assuming that reliability is constant, we have three equations with three unknowns and it is possible to solve the equations to estimate reliability.
(1) r12 = rel*s1; s1 = r12/rel
(2) r23 = rel*s2; s2 = r23/rel
(3) r13 = rel*s1*s2, rel = r13/(s1*s2)
r = (r12*r23)/r13
with r12 = .64, r23 = .32, and r13 = .256, we get (.64*.32)/.256 = .8.
Heise’s model is called an autoregressive model which implies that over time, retest correlations will become smaller and smaller until they approach zero. However, if stability is high, this can take a long time. For example, Conley (1984) estimated that the annual stability of IQ tests is r = .99. With this high stability, the retest correlation over 40 years is still r = .67. Consistent with Conley’s prediction a study found that the retest correlation from age 11 to age 70 of r = .67 (ref), which is even higher than predicted by Conley.
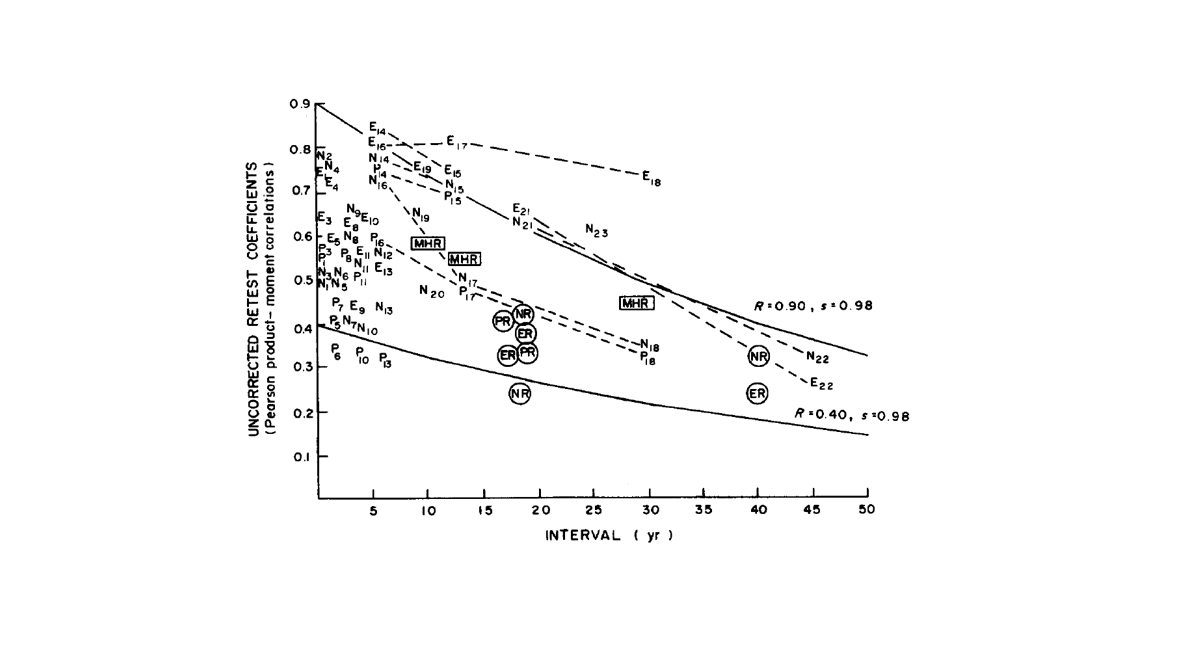
The Figure below shows Conley’s estimate for personality traits like extraversion and neuroticism. The figure shows that reliability varies across studies and instruments from as low as .4 to as high as .9. After correcting for unreliability, the estimated annual stability of personality traits is s = .98.

The figure also shows that most studies in this meta-analysis of retest correlations covered short time-intervals from a few month up to 10 years. Studies with 10 or more years are rare. As a result, Conley’s estimates are not very precise.
To test Conley’s predictions, I used the three waves of the Midlife in the US study (MIDUS). Each wave was approximately 10 years apart with a total time span of 20 years. To analyze the data, I fitted a measurement model to the personality items in the MIDUS. The fit of the measurement model has been examined elsewhere (Schimmack, 2019). The measurement model was constrained for all three waves (see OSF for syntax). The model had acceptable overall fit, CFI = .963, RMSEA = .018, SRMR = .035 (see OSF for output).
The key finding are the retest correlations r12, r23, and r13 for the Big Five and two method factors; a factor for evaluative bias (halo) and acquiescence bias.
| r12 | r23 | r13 | |
| Neuroticism | 0.78 | 0.80 | 0.72 |
| Extraversion | 0.87 | 0.90 | 0.85 |
| Openness | 0.80 | 0.84 | 0.75 |
| Agreeableness | 0.79 | 0.81 | 0.75 |
| Conscientiousness | 0.78 | 0.83 | 0.77 |
| Halo | 0.72 | 0.76 | 0.68 |
| Aquiescence | 0.53 | 0.53 | 0.54 |
For all traits except acquiescence bias, the r13 correlation is lower than the r12 or r23 correlation, indicating some real change. However, for all traits, the r13 correlation is higher than the product of r12 and r23, indicating the presence of random measurement error or occasion specific variance.
The next table shows the decomposition of the retest-correlations into a reliability component and a stability component.
| Reliable | 20Y Stability | 1Y Stability | |
| Neuroticism | 0.87 | 0.83 | 0.99 |
| Extraversion | 0.92 | 0.92 | 1.00 |
| Openness | 0.90 | 0.84 | 0.99 |
| Agreeableness | 0.85 | 0.88 | 0.99 |
| Conscientiousness | 0.84 | 0.92 | 1.00 |
| Halo | 0.80 | 0.85 | 0.99 |
| Aquiescence | 0.52 | 1.04 | 1.00 |
The reliability estimates range from .84 to .92 for the Big Five scales. Reliability of the method factor is estimated to be lower. After correcting for unreliability, 20-year stability estimates increase from observed levels of .72 to .85 to estimated levels of .83 to .1. The implied annual stability estimates are above .99, which is higher than Conley’s estimate of .98.
Unfortunately, three time points are not enough to test the assumptions of Heise’s model. Maybe reliability increases over time. Another possibility is that some of the variance in personality is influenced by stable factors that never change (e.g., genetic variance). In this case, retest correlations do not approach zero, but to a level that is set by the influence of stable factors.
Anusic and Schimmack’s meta-analysis suggested that for the oldest age group, the amount of stable variance is 80, and that this asymptote is reached very quickly (see picture). However, this model predicts that 10-year retest correlations are equivalent to 20-year retest correlations, which is not consistent with the results in Table 1. Thus, the MIDUS data suggest that the model in Figure 1 overestimates the amount of stable trait variance in personality. More data are needed to model the contribution of stable factors to stability of personality traits. However, both models predict high stability of personality over a long period of 20 years.

Conclusion
Science can be hard. Astronomy required telescopes to study the universe. Psychologists need longitudinal studies to examine stability of personality and personality development. The first telescopes were imperfect and led to false beliefs about canals and life on Mars. Similarly, longitudinal data are messy and provide imperfect glimpses into the stability of personality. However, the accumulating evidence shows impressive stability in personality differences. Many psychologists are dismayed by this finding because they have a fixation on disorders and negative traits. However, the Big Five traits are not disorders or undesirable traits. They are part of human diversity. When it comes to normal diversity, stability is actually desirable. Imagine you train for a job and after ten years of training you don’t like it anymore. Imagine you marry a quiet introvert and five year later, he is a wild party animal. Imagine, you never know who you are because your personality is constantly changing. The grass on the other side of the fence is often greener, but self-acceptance and building on one’s true strength may be a better way to live a happy life than to try to change your personality to fit cultural norms or parental expectations. Maybe stability and predictability aren’t so bad after all.
The results also have implications for research on personality change and development. If natural variation in factors that influence personality produces only very small changes over periods of a few years, it will be difficult to study personality change. Moreover, small real changes will be contaminated with relatively large amounts of random measurement error. Good measurement models that can separate real change from noise are needed to do so.
References
Conley, J. J. (1984). The hierarchy of consistency: A review and model of longitudinal findings on adult individual differences in intelligence, personality and self-opinion. Personality and Individual Differences, 84, 11-25.
Heise D. R. (1969) Separating reliability and stability in test-retest correlation. Am. social. Rev. 34, 93-101.
Roberts, B. W., & DelVecchio, W. F. (2000). The rank-order consistency of personality traits from childhood to old age: A quantitative review of longitudinal studies. Psychological Bulletin, 126, 3–25.