Although the replication crisis in psychology is far from over, a new crisis is emerging on the horizon; the validation crisis. Despite a proud tradition of psychological measurement, psychological science has ignored psychological measurement and treated sum scores of ratings or reaction times as valid, without testing this assumption (Schimmack, 2019a, 2019b).
Even when psychometricians examined the validity of psychological measures, these studies are often ignored. For example, there is ample evidence that self-ratings are influenced by a general evaluative bias or halo (Campbell & Fiske, 1959; Thorndike, 1920; Biesanz and West, 2004; deYoung, 2006; Anusic et al., 2009; Kim et al., 2012). Yet, psychometric studies of the Big Five tend to ignore this method factor (Zimprich, Allemand, Lachman, 2012).
This is unfortunate because psychologists now have invaluable datasets that examine personality in large, nationally representative, longitudinal studies such as the German Socio-Economic Panel (Specht et al.) and the Midlife In Da United States (MIDUS) study
(http://midus.wisc.edu/).
The aim of this blog post is to invite psychologists to take advantage of advances in psychometric methods when the analyze these datasets. Rather than computing sum scores with low reliability that are contaminated by method variance, it is preferable to use latent variable models that can test measurement invariance across samples and over time.
To examine age effects on personality in the MIDUS, I developed an open measurement model (https://osf.io/23k8v/). Rather than arguing that this is the best measurement model, I consider it a starting point for further exploration. Exploring different measurement models and examining the theoretical consequences of different specifications is not validity hacking (v-hacking; cf. Schimmack, 2019c). Transparent open debate about specifications of measurement models is open science and necessary for developing better measures.
Using a measurement model for the MIDUS is particularly important because the questionnaire has only few items to represent some Big Five dimensions. Moreover, halo bias inflates factor loadings in models that do not control for halo bias (EFA, CFA without method factors) and results overestimate the validity of Big Five scales in the MIDUS.
The final model had acceptable overall fit and modification indices suggested no major further revisions to the model, CFI = .958, RMSEA = .039, 90%CI = .037 to .040, SRMR = .035.
Table 1 shows the factor loadings of items and scale scores on the latent Big Five factors.
| Item# | N | E | O | A | C | EVB | ACQ | |
| Neuroticism | -0.28 | 0.22 | ||||||
| moody | 3 | 0.39 | -0.19 | -0.16 | -0.25 | 0.20 | ||
| worrying | 7 | 0.66 | -0.12 | -0.26 | 0.20 | |||
| nervous | 12 | 0.67 | 0.23 | -0.14 | 0.28 | 0.22 | ||
| calm | 18 | -0.54 | 0.15 | |||||
| SUM | 0.76 | 0.00 | 0.00 | -0.11 | -0.14 | -0.36 | 0.14 | |
| Extraversion | ||||||||
| outgoing | 1 | -0.08 | 0.72 | 0.29 | 0.22 | |||
| lively | 10 | -0.10 | 0.51 | 0.31 | 0.24 | |||
| assertive | 14 | 0.46 | 0.17 | -0.34 | 0.19 | 0.28 | 0.22 | |
| outspoken | 19 | 0.41 | -0.41 | 0.25 | 0.19 | |||
| talkative | 26 | 0.12 | 0.58 | 0.26 | 0.20 | |||
| SUM | -0.01 | 0.72 | 0.04 | -0.21 | 0.05 | 0.37 | 0.29 | |
| Openness | ||||||||
| creative | 13 | 0.18 | 0.70 | 0.26 | 0.20 | |||
| imaginative | 16 | 0.23 | 0.73 | 0.28 | 0.22 | |||
| curious | 21 | 0.17 | 0.30 | 0.33 | 0.25 | |||
| SUM | 0.00 | 0.24 | 0.73 | 0.00 | 0.00 | 0.35 | 0.28 | |
| Agreeableness | ||||||||
| helpful | 2 | 0.34 | 0.39 | 0.31 | ||||
| friendly | 5 | 0.42 | 0.44 | 0.37 | 0.29 | |||
| warm | 6 | 0.40 | 0.42 | 0.36 | 0.28 | |||
| caring | 11 | 0.16 | 0.47 | 0.40 | 0.32 | |||
| softhearted | 17 | 0.38 | -0.35 | 0.32 | 0.25 | |||
| sympathetic | 25 | 0.42 | -0.23 | 0.35 | 0.28 | |||
| dominant | 29 | 0.10 | 0.30 | -0.56 | 0.25 | 0.20 | ||
| SUM | -0.03 | 0.16 | 0.00 | 0.71 | -0.14 | 0.40 | 0.31 | |
| Conscientiousness | ||||||||
| organized | 4 | 0.42 | 0.28 | 0.22 | ||||
| responsible | 8 | 0.13 | 0.37 | 0.45 | 0.35 | |||
| careless | 23 | -0.21 | -0.40 | -0.32 | 0.25 | |||
| SUM | 0.00 | 0.00 | 0.00 | 0.15 | 0.56 | 0.47 | 0.12 |
Results show several items with notable secondary loadings (e.g., warm), and some primary factor loadings were modest (e.g., curious). Nevertheless, 50% or more of the variance in sum scores can be attributed to the primary content of a scale, except for conscientiousness. All scales also had considerable halo variance. For conscientiousness, halo variance was nearly as high as conscientiousness variance. Given these results, it is preferable to examine substantive questions with the latent factors of a measurement model rather than with manifest scale scores.
Age and Personality
The MIDUS data are some of the best data to examine the influence of age on personality because longitudinal studies with large samples and long retest intervals are rare (see meta-analysis by Anusic & Schimmack, 2016).
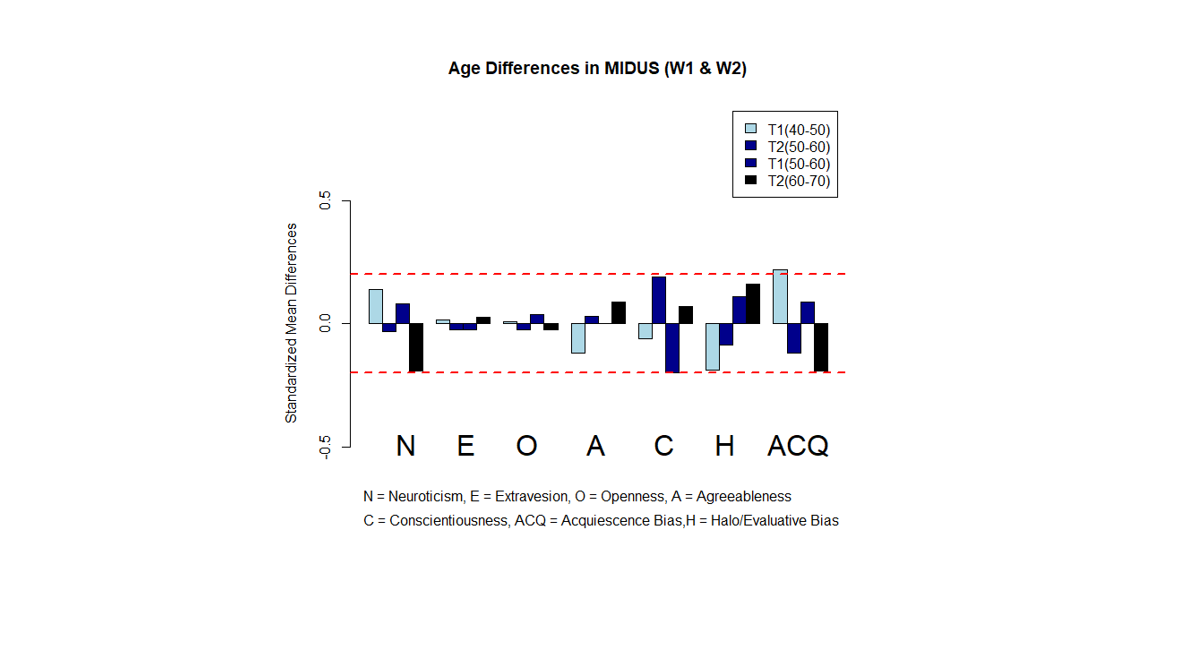
Age effects can be examined cross-sectionally and longitudinally. The problem with cross-sectional studies that age is confounded with cohort effects. The problem of longitudinal studies is that age is confounded with period effects. Stronger evidence for robust age effects is obtained in longitudinal cohort studies. The MIDUS data make it possible to compare participants who are 45 (40 to 50) to participants who are 55 (50 to 60) at time 1 and compare their scores at time 1 to their scores at time 2. The older age group at time 1 corresponds to the younger age group at time 2 (age 50 to 60). Thus, these groups should be similar to each other, but differ from the younger group at time 1 and the older group at time 2, if age influences personality.
To test this hypothesis, I fitted a multi-group model to the MIDUS data at time 1 and time 2. The model assumed metric and scalar invariance four all four groups. This model had good fit to the data, CFI = .957, RMSEA = .026, SRMR = .047.
The mans of the latent Big Five factors and the two method factors were divided by the overall mean of the four groups so that mean differences are presented as deviations from 0 (rather than using one group as an arbitrary reference group).

The results show no notable age effects for extraversion or openness. Neuroticism shows a decreasing trend with a standardized mean difference of .33 from age 40-50 to age 60-70. Agreeableness shows an even smaller increase by .21 standard deviations. The results for conscientiousness are difficult to interpret because the equivalent age groups differ more from each other than from other age groups. Overall, these results suggest that mean levels of personality are fairly stable from age 40 to age 70.
The halo factor shows a trend towards increasing with age. However, the increase is also modest, d = .35. The largest effect is a decrease in acquiescence. This effect is mostly driven by a retest effect, suggesting that acquiescence bias decreases with repeated testing.
These results suggest that most changes in personality may occur during adolescence and early adulthood, but that mean levels of personality are fairly stable through-out mid-life.
The model also provides information about the rank-order consistency of personality over a 10-year period. Consistent with meta-analytic evidence, retest correlations are high: neuroticism, r = .81, extraversion r = .87, openness r = .78, agreeableness r = .84, and conscientiousness, r = .81. A novel finding is that halo bias is also stable over a 10-year period, r = .69. So is acquiescence bias, r = .57. Thus, even time-lagged correlations can be influenced by method factors. Thus, it is necessary to control for halo bias in studies that rely on self-reports.
Gender and Personality
I also fitted a multiple-group model to the data with gender as between-group variable and time (T1 vs. T2). This model examines age differences for groups age 40-50 (T1) and age 50-60 (T2). The model with metric and scalar invariance had acceptable fit, CFI = .952, RMSEA = .027, SRMR = .051. As before, the means of the latent factors were transformed so that the overall mean was zero.

The main finding is a large difference between men and women’s agreeableness of nearly a full standard deviation. This difference was the same in both age groups. This finding is consistent with previous studies, including cross-cultural studies, suggesting that gender differences in agreeableness are robust and universal.
The results also showed consistent gender differences in neuroticism with an effect size of about 50% of a standard deviation. Again, the gender difference was observed in both age groups. This finding is also consistent with cross-cultural studies.
2 thoughts on “Measuring Personality in the MIDUS”