Category Archives: Hierarchical CFA

Goldberg’s Fake Hierarchical Factor Analysis

This is a critique of the unscientific backwards way to study hierarchical structures advocated in Goldberg’s (2006) article “Doing it all Bass-Ackwards: The development of hierarchical factor structures from the top down”

“Bass-ackward” is an informal, euphemistic, and idiomatic term that means in a backward or inept way. It is an anagram of the phrase “ass-backward

The main problem with this article is that it presents a misleading and false way to examine hierarchical structures that has impeded the use of a proper method to do so. Many articles have used this method to presented meaningless results. Goldberg even noted in his original article.

To many factor theorists, the structural representations included in this article are not
truly “hierarchical,” in the sense that this term is most often used in the methodological
literature (e.g., Yung, Thissen, & McLeod, 1999).

However, the proper method requires thinking and some understanding of covariance structures. This is typically not taught in psychology programs and few personality psychologists have the intrinsic motivation or ability to learn these techniques on their own. Moreover, reviewers would not understand these article. Therefore they rather use a backwards method that doesn’t care whether the results actually match the data.

Introduction

One important scientific activity is to find common elements among objects. Well-known scientific examples are the color wheel in physics, the periodic table in chemistry, and the Linnaean Taxonomy in biology. A key feature of these systems is the assumption that objects are more or less similar along some fundamental features. For example, similar animals in the Linnaean Taxonomy share prototypical features because they have a more recent common ancestor.

The prominences of classification systems in mature sciences suggests that psychology could also benefit from classification of psychological objects. A key goal of psychological science is to understand human’s experiences and behaviors. At a very abstract level, the causes of experiences and behaviors can be separated into situational and personality factors (Lewin, 1935). The influence of personality factors can be observed when individuals act differently in the same situation. The influence of situations is visible when the same person acts differently in differently situations.

Personality psychologists have worked on a classification system of personality factors for nearly a century, starting with Allport and Odbert (1936) catalogue of trait words, and Thurstone’s (1934) invention of factor analysis. Factor analysis has evolved and there are many different options to conduct a factor analyses. The most important development was the invention of confirmatory factor analysis (Joreskog, 1969). Confirmatory factor analysis has several advantages over traditional factor analytic models that are called exploratory factor analyses to distinguish them from confirmatory analyses. Confirmatory factor analysis has several advantages over exploratory factor analysis. The most important advantage is the ability to test hierarchical models of personality traits (Marsh & Myers, 1986). The specification of hierarchical models with CFA is called hierarchical factor analysis. Despite the popularity of hierarchical trait models, personality researchers continue to rely on exploratory factor analysis as the method of choice. This methodological choice impedes progress in the search for a structural model of personality traits.

Metaphorical Science

A key difference between EFA and CFA is that EFA is atheoretical. The main goal is to capture the most variance in observed variables with a minimum of factors. This purely data driven criterion implies that the number of factors and the nature of factors is arbitrary. In contrast, CFA models aim to fit the data and it is possible to compare models with different numbers of factors. For example, EFA would have no problem of showing a single first factor, even if feminine and masculine traits were independent (Marsh & Myers, 1986). However, such a model might show bad fit, and model comparison could show that a model with two factors fits the data better. The lack of model fit in traditional EFA applications may explain Goldberg’s attempt to explore hierarchical structures with a series of EFA models that specify different numbers of factors, starting with a single factor and adding one more factor at each step. For all solutions, factors are rotated based on some arbitrary criterion. Goldberg prefers Varimax rotation. As a consequence, factors within the same model are uncorrelated. His Figure 2 shows the results when this approach was used for a large number of personality items.

To reinforce the impression that this method reveals a hierarchical structure, factors at different levels are connected with arrows that point from the higher levels to the lower levels. Furthermore, correlations between factor scores are used to show how strong factors at different levels are related. Readers may falsely interpret the image as evidence for a hierarchical model with a general factor on top. Goldberg openly admits that his method does not hierarchical causal models and that none of the levels may correspond to actual personality factors.

‘To many factor theorists, the structural representations included in this article are not
truly “hierarchical,” in the sense that this term is most often used in the methodological
literature (e.g., Yung, Thissen, & McLeod, 1999). For those who define hierarchies in
conventional ways, one might think of the present procedure in a metaphorical sense” (p. 356).

The difference between a conventional and unconventional hierarchical model is best explained by the meaning of a directed arrow in a hierarchical model. In a conventional model, an arrow implies a causal effect and causal effects of a common cause produce a correlation between the variables that share a common cause (PSY100). For example, in Figure 1 , the general factor correlates r = .79 with the first factor a level 2 and r = .62 with the second factor at level 2. The causal interpretation of these path coefficients would imply that the correlation between the two level-2 factors is .79 x .62 = .49. Yet, it is clear that this prediction is false because factors at the same level were specified to be independent. It therefore makes no sense to draw the arrows in this direction. Goldberg realizes this, but does it anyways.

“While the author has found it useful to speak of the correlations between factor scores at different levels as “path coefficients,” strictly speaking they are akin to part-whole correlations, but again the non-traditional usage can be construed metaphorically” .

It would have been better to draw the arrows in the opposite direction because we can interpret the reversed path coefficients as information about the loss of information when the number of factors is reduced by one. For example, the correlation of r = .79 between the first level 2 factor and the general factor implies that the general factor sill captures .79^2 = 62% of the variance of the first level 2 factor and 38% of the variance is lost in the one-factor model. Goldberg fittingly called his approach ass-backwards and that means the arrows need be interpreted in the reverse direction.

The key advantages of Goldberg’s approach is that researchers did not need to buy additional software before R made CFA free of charge, did no have to learn structural equation modeling, and did not have to worry about model fit. A hierarchical structure with a general factor could always be found, even if the first factor is unrelated to some of the lower factors (see Figure 3 in Goldberg).

There is also no need to demonstrate consistency across datasets. The factors in he two models show different relations to the five factors at the lowest level. This is the beauty of metaphorical science. Every analysis provides a new metaphor that reflects personality without any ambition to reveal fundamental factors that influence human behavior.

Metaphorical Pathological Traits

It would be unnecessary to mention Goldberg’s metaphorical hierarchical models, if personality researchers had ignored his approach and used CFA to test hierarchical models. in fact, there have been no notable applications of Goldberg’s approach in mainstream personality psychology. However, the method has gained popularity among clinical psychologists interested in personality disorders. A highly cited article by Kotov et al. (2017) claims that Goldberg’s method “supported the presence of a p factor, but also suggested
that multiple meaningful structures of different generality exist between the six spectra and a p factor” (p. 463). I do not doubt that meaningful metaphors can be found to describe maladaptive traits, but it is problematic that interpretability is the sole criterion to justify the claim of a hierarchical structure of personality factors that may cause intrapersonal and interpersonal problems. Although Kotov et al. (2017) mention confirmatory factor analysis as a potential research tool, they do not mention that Goldberg’s method is fundamentally different from hierarchical CFA.

The most highly cited application of Goldberg’s method is published in an article by Wright, Thomas, Hopwood, Markon, Pincus, and Krueger (2012). The data are undergraduate (N = 2,461) self-ratings on the 220 items of the Personality Inventory for DSM-5. The 220 items are scored to provide information about 25 maladaptive traits that are correlated with each other. Wright et al. show that the correlations among the 25 scales can be represented with five correlated factors, but they do not provide fit indices of the five-factor solution. Correlations among the five factors ranged from r = .043 to .437.

Figure 1 in Wright et al. (2012 shows Goldberg’s hierarchical structure.

Naive interpretation of the structure and path coefficient seems to suggest the presence of a strong general factor that contributes to personality pathology. This general factor appears to explain a large amount of variance in internalizing and externalizing personality problems. Internalizing and externalizing factors explain considerable variance in four of the five primary factors, but psychoticism appears to be rather weakly related to the other traits and the p-factor. However, this interpretation of the results is only metaphorical.

A proper interpretation of the hierarchy focuses on the variance that is lost when five factors are reduced to fewer factors. For example, by combining the internal and external factors into a single p-factor implies that 72% of the variance in internalizing traits is retrained and 28% are lost. For externalizing traits, only 32% of the variance is retained and 68% is lost. Combined the reduction of two factors to one factors leads to a loss of 96% of the variance. This implies that the two factors are orthogonal because reducing two independent factors to one leads to a loss of 50% of the variance in each and a loss of 100% of the variance in both (200% total). Thus, rather than supporting the presence of a strong p-factor, Figure 1 actually suggests that there is no strong general factor. This is not surprising when we look at the correlations among the factors. Negative affect (internalizing) correlated weakly with the externalizing factors antagonism, r = .04, and disinhibition, r = .09. These correlations suggest that internalizing and externalizing traits are independent, rather than sharing a common influence of a general pathology factor.

Hierarchical Confirmatory Factor Analysis

I used the correlation matrix in Wright et al.’s (2012) Table 1 to build a hierarchical model with CFA. The first model imposed a hierarchical structure with 4 levels and a correlation between the top two factors. It would have been possible to specify a general factor, but the loadings of the two factors on this general factor are not determined. The model had good fit, chi2 (2) = 2.51, CFI = 1.000, RMSEA = .010.

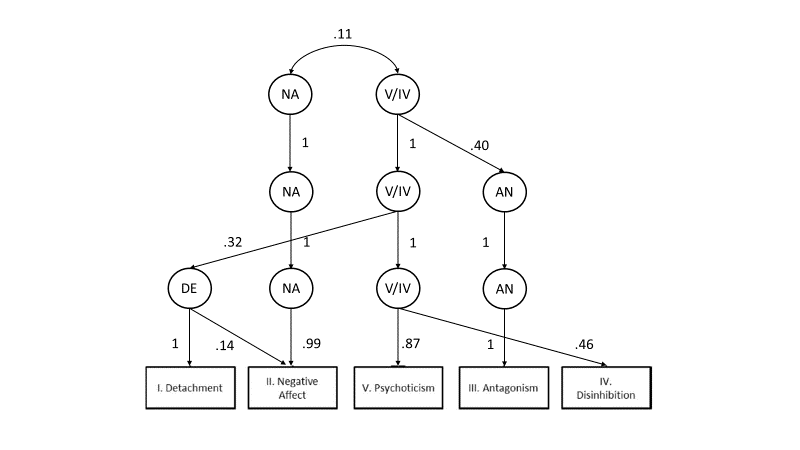
The first observation is that the top two factors are only weakly correlated, r = .11. This supports the conclusion that there is no evidence for a general factor of personality pathology that contributes substantially to correlations among specific PID-5 scales. The second observation is that many factors at higher levels are identical to lower level traits. Thus, the observation that there are factors at all levels is illusory. The NA factor at the highest level is practically identical with the NA factor at the lowest level. The duplication of factors at various levels is unnecessary and confusing. Therefore I built a truly hierarchical CFA model that does not specify the number of levels in the hierarchy a priori. This model also had good fit, chi2(df = 2) = 2.51, CFI = 1.000, RMSEA = .010.

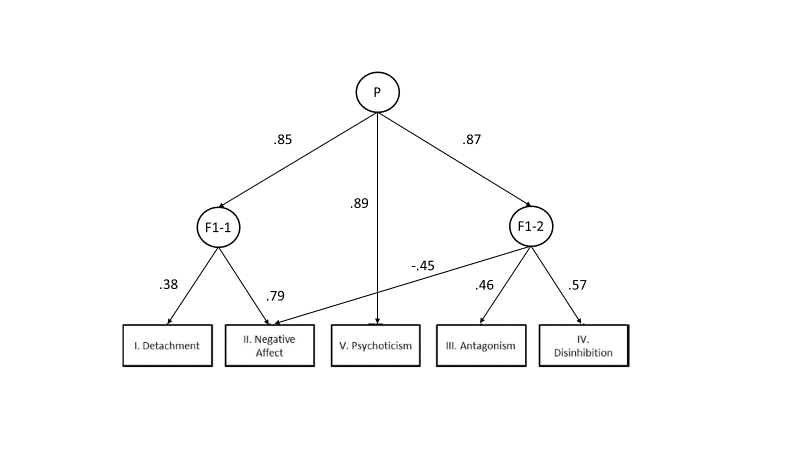
The model shows that detachment and negative affect are related to each other by a shared factor (F1-1) that could be interpreted as internalizing. Similarly, Antagonism and Disinhibition share a common factor (F1-2) that could be labeled externalizing. At a higher level, a general factor relates these two factors as well as psychoticism. The loadings on the general factor are high, suggesting that scores on the PID-5 scales are correlated with each other because they share a single common factor. The low correlations between Negative Affect and externalizing are attributed to a negative relationship of the externalizing factor (F1-2) and Negative Affect.

The good fit of these models does not imply that they capture the true nature of the relationships among PID-5 scales. It is also not clear whether the p-factor is a substantive factor or reflects response styles. However, unlike Goldberg’s method, HCFA can be used to test hierarchical models of personality traits. Thus, researchers who are speculating about hierarchical structures need to subject their models to empirical tests with HCFA. Goldberg’s method is metaphorical, unsuitable, and unscientific. It creates the illusion that it reveals hierarchical structures, but it merely shows which variances are lost in models with fewer factors. In contrast, HCFA can be used to test models that aim to explain variance rather than throwing it away.

Testing Hierarchical Models of Personality with Confirmatory Factor Analysis

Naive and more sophisticated conceptions of science assume that empirical data are used to test theories and that theories are abandoned when data do not support them. Psychological journals give the impression that psychologists are doing exactly that. Journals are filled with statistical hypothesis tests. However, hypothesis tests are not theory tests because only results that confirm a theoretical prediction (by falsifying the null-hypothesis) get published; p < .05 (Sterling, 1959). As a result, psychology journals are filled with theories that have never been properly tested. Chances are that some of these theories are false.

To move psychology towards being a science, it is time to subject theories to empirical tests and to replace theories that do not fit the data with theories that do. I have argued elsewhere already that higher-order models of personality are a bad idea with little empirical support (Schimmack, 2019a). Colin DeYoung responded to this criticism of his work (DeYoung, 2019). In this blog post, I present a new approach to the testing of structural theories of personality with confirmatory factor analysis (CFA). The advantage of CFA is that it is a flexible statistical method that can formalize a variety of competing theories. Another advantage of CFA is that it is possible to capture and remove measurement error. Finally, CFA provides fit indices that make it possible to compare models and to select models that fit the data better. Although CFA celebrates its 50th birthday this year, psychologists still have to appreciate its potential for testing personality theories (Joreskog, 1969).

What are Higher-Order Factors?

The notion of a factor has a clear meaning in psychology. A factor is a common cause that explains, at least in a statistical sense, why several variables are correlated with each other. That is, a factor represents the shared variance among several variables that is assumed to be caused by a common cause rather than by direct causation among the variables.

In traditional factor analysis, factors explain correlations among observed variables such as personality ratings. The notion of higher-order factors implies that first-order factors that explain correlations among items are correlated (i.e., not independent) and that these correlations among factors are explained by another set of factors, which are called higher-order factors.

In empirical tests of higher-order factors it has been overlooked that the Big Five factors are already higher-order factors in a hierarchy of personality traits that explain correlations among more specific personality traits like sociability, curiosity, anxiety, or impulsiveness. Instead ALL tests of higher-order models have relied on items or scales that measure the Big Five. This makes it very difficult to study the higher-order structure of personality because results will vary depending on the selection of items that are used to create Big Five scales.

A much better way to test higher-order models is to fit a hierarchical CFA model to data that represent multiple basic personality traits. A straightforward prediction of a higher-order model is that all or at least most facets that belong to a common higher order factor should be correlated with each other.

For example, Digman (1997) and DeYoung (2006) suggested that extraversion and openness are positively correlated because they are influenced by a common factor, called beta or plasticity. As extraversion is conceived as a common cause of sociability, assertiveness, and cheerfulness and openness is conceived as a common cause of being imaginative, artistic, and reflective, the model makes the straightforward prediction that sociability, assertiveness, and cheerfulness are positively correlated with being imaginative, artistic, and reflective.

Evaluative Bias

One problem in testing structural models of personality is that personality ratings are imperfect indicators of personality. Some of the measurement error in personality ratings is random, but other sources of variance are systematic. Two sources have been reliably identified, namely acquiescence and evaluative bias (Anusic et al., 2009; Biderman et al., 2019). DeYoung (2006) also found evidence for evaluative bias in a multi-rater study. Thus, there is agreement between DeYoung and me that some of the correlations among personality ratings do not reflect the structure of personality, but rather systematic measurement error. It is necessary to control for these method factors when studying the structure of personality traits and to examine the correlation among Big Five traits because method factors distort these correlations in mono-method studies. In two previous posts, I found no evidence of higher-order factors when I fitted hierarchical models to the 30 facets of the NEO-PI-R and another instrument with 24 facets (Schimmack, 2019b, 2019c). Here I take another look at this question by examining more closely the pattern of correlations among personality facets before and after controlling for method variance.

Data

From 2010 to 2012 I posted a personality questionnaire with 303 items on the web. Visitors were provided with feedback about their personality on the Big Five dimensions and specific personality facets. Earlier I presented a hierarchical model of these data with three items per facet (Schimmack, 2019). Subsequently, I examined the loadings of the remaining items on these facets. Here I presents results for 179 items with notable loadings on one of the facets (Item.Loadings.303.xlsx; when you open file in excel, selected items are highlighted in green). The use of more items per facets makes the measurement model of facets more stable and ensures more stable facet correlations that are more likely to replicate across studies with different item sets. The covariance matrix for all 303 items is posted on OSF (web303.N808.cov.dat) so that these results presented below can be reproduced.

Results

Measurement Model

I first constructed a measurement model. The aim was not to test a structural model, but to find a measurement model that can be used to test structural models of personality. Using CFA for exploration seems to contradict its purpose, but reading the original article by Joreskog shows that this approach is entirely consistent with the way he envisoned CFA to be used. It is unclear to me who invented the idea that CFA should follow an EFA analysis. This makes little sense because EFA may not fit some data if there are hierarchical relationships or correlated residuals. So, CFA modelling has to start with a simple theoretical model that then may need to be modified to fit some data, which leads to a new model to be tested with new data.

To develop a measurement model with reasonable fit to the data, I started with a simple model where items had fixed primary loadings and no secondary loadings, while all factors were allowed to be correlated with each other. This is a simple structure model. It is well known that this model does not fit real data. I then modified the model based on modification indices that suggested (a) secondary loadings, (b) relaxed the constraint of a primary loading, or (c) suggested correlated item residuals. This way a model with reasonable fit to the data was obtained, CFI = .775, RMSEA = .040, SRMR = .042 (M0.Measurement.Model.inp on OSF). Although CFI was below the standard criterion of .95, model fit was considered acceptable because the only source of misfit to the model would be additional small secondary loadings (< .2) or correlated residuals that have little influence on the magnitude of the facet correlations.

Facet Correlations

Below I present the correlations among the facets. The full correlation matrix is broken down into sections that are theoretically meaningful. The first five tables show the correlations among facets that share the same Big Five factor.

There are three main neuroticism facets: anxiety, anger/hostility, and depression. A fourth facet was originally intended to be an openness to emotions facet, but it correlated more highly with neuroticism (Schimmack, 2009c). All four facets show positive correlations with each other and most of these correlations are substantial, except the strong emotions and depression facets.

Results for extraversion show that all five facets are positively correlated with each other. All correlations are greater than .3, but none of the correlations are so high as to suggest that they are not distinct facets.

Openness facets are also positively correlated, but some correlations are below .2, and one correlation is only .16, namely the correlation between openness to activities and art.

The correlations among agreeableness facets are more variable and the correlation between modesty and trust is slightly negative, r = -.05. The core facet appears to be caring which shows high correlations with morality and forgiveness.

All correlations among conscientiousness facets are above .2. Self-discipline shows high correlations with competence beliefs and achievement striving.

Overall, these results are consistent with the Big Five model.

The next tables examine correlations among sets of facets belonging to two different Big Five traits. According to Digman and DeYoung’s alpha-beta model, extraversion and openness should be correlated. Consistent with this prediction, the average correlation is r = .16. For ease of interpretation all correlations above .10 are highlighted in grey, showing that most correlations are consistent with predictions. However, the value facet of openness shows lower correlations with extraversion facets. Also, the excitement seeking facet of extraversion is more strongly related to openness facets than other facets.

The alpha-beta model also predicts negative correlations among neuroticism and agreeableness facets. Once more, the average correlation is consistent with this prediction, r = -.15. However, there is also variation in correlations. In particular, the anger facet is more strongly negatively correlated with agreeableness facets than other neuroticism facets.

As predicted by the alpha-beta model, neuroticism facets are negatively correlated with conscientiousness facets, average r = -.21. However, there is variation in these correlations. Anxiety is less strongly negatively correlated with conscientiousness facets than other neuroticism facets. Maybe, anxiety sometimes has similar effects as conscientiousness by motivating people to inhibit approach motivated, impulsive behaviors. In this context, it is noteworthy that I found no strong loading of impulsivity on neuroticism (Schimmack, 2019c).

The last pair are agreeableness and conscientiousness facets, which are predicted to be positively correlated. The average correlation is consistent with this prediction, r = .15.

However, there is notable variation in these correlations. A2-Morality is more strongly positively correlated with agreeableness than other agreeableness facets, in particular trust and modesty which show weak correlations with conscientiousness.

The alpha-beta model also makes predictions about other pairs of Big Five facets. As alpha and beta are conceptualized as independent factors, these correlations should be weaker than those in the previous tables and close to zero. However, this is not the case.

First, the average correlation between neuroticism and extraversion is negative and nearly as strong as the correlation between neuroticism and agreeableness, r = -.14. In particular, depression is strongly negatively related to extraversion facets.

The average correlation between extraversion and agreeableness facets is only r = .07. However, there is notable variability. Caring is more strongly related to extraversion than other agreeableness facets, especially with warmth and cheerfulness. Cheerfulness also tends to be more strongly correlated with agreeableness facets than other extraversion facets.

Extraversion and conscientiousness facets are also positively correlated, r = .15. Variation is caused by stronger correlations for the competence and self-discipline facets of conscientiousness and the activity facet of extraversion.

Openness facets are also positively correlated with agreeableness facets, r = .10. There is a trend for the O1-Imagination facet of openness to be more consistently correlated with agreeableness facets than other openness facets.

Finally, openness facets are also positively correlated with conscientiousness facets, r = .09. Most of this average correlation can be attributed to stronger positive correlations of the O4-Ideas facet with conscientiousness facets.

In sum, the Big Five facets from different Big Five factors are not independent. Not surprisingly, a model with five independent Big Five factors reduced model fit from CFI = .775, RMSEA = .040 to CFI = .729, RMSEA = .043. I then fitted a model that allowed for the Big Five factors to be correlated without imposing any structure on these correlations. This model improved fit over the model with independent dimensions, CFI = .734, RMSEA = .043.

The pattern of correlations is consistent with a general evaluative factor rather than a model with independent alpha and beta factors.

Not surprisingly, fitting the alpha-beta model to the data reduced model fit, CFI = .730, RMSEA = .043. In comparison, a mode with a single evaluative bias factor had better fit, CFI = .732, RMSEA = .043.

In conclusion, the results confirm previous studies that a general evaluative dimension produces correlations among the Big Five factors. DeYoung’s (2006) multi-method study and several other multi-method studies demonstrated that this dimension is mostly rater bias because it shows no convergent validity across raters.

Facet Correlations with Method Factors

To remove the evaluative bias from correlations among facets, it is necessary to model evaluative bias at the item level. That is, all items load on an evaluative bias factor. This way the shared variance among indicators of a facet reflects only facet variance and no evaluative variance. I also included an acquiescence factor, although acquiescence has a negligible influence on facet correlations.

It is not possible to let all facets to be correlated freely when method factors are included in a model because this model is not identified. To allow for a maximum of theoretically important facet correlations, I freed parameters for facets that belong to the same Big Five factor, facets that are predicted to be correlated by the alpha-beta model, and additional correlations that were suggested by modification indices. Loadings on the evaluative bias factor were constraint to 1 unless modification indices suggested that items had stronger or weaker loadings on the evaluative bias factor. This model fitted the data as well as the original measurement model, CFI = .778 vs. 775, RMSEA = .040 vs. .040. Moreover, modification indices did not suggest any further correlations that could e freed to improve model fit.

The main effect of controlling for evaluative bias is that all facet correlations were reduced. However, it is particularly noteworthy to examine the correlations that are predicted by the alpha-beta model.

The average correlation for extraversion and openness facets is r = .07. This average is partially driven by stronger correlations of the excitement seeking facet with openness facets than other excitement facets. There are only four other correlations above .10, and 9 of the 25 correlations are negative. Thus, there is little support for a notable general factor that produces positive correlations between extraversion and openness facets.

The average correlation for neuroticism and agreeableness is r = -.06. However, the pattern shows mostly strong negative correlations for the anger facet of neuroticism with agreeableness facets. In addition, there is a strong positive correlation between anxiety and morality, r = .20. This finding suggests that anxiety may also serve the function to inhibit immoral behavior.

The average correlation for neuroticism and conscientiousness is r = -.07. While there are strong negative correlations, r = -.30 for anger and deliberation, there is also a strong positive correlation, r = .22 for self-discipline and anxiety. Thus, the relationship between neuroticism and conscientiousness facets is complex.

The average correlation for agreeableness and conscientiousness facets is r = .01. Moreover, none of the correlations exceeded r = .10. This finding suggests that agreeableness and conscientiousness are independent Big Five factors, which contradicts the prediction by the alpha-beta model.

The finding also raises questions about the small but negative correlations of neuroticism with agreeableness (r = -.06) and conscientiousness (r = -.07). If these correlations were reflecting the influence of a common factor alpha that influences all three traits, one would expect a positive relationship between agreeableness and conscientiousness. Thus, these relationships may have another origin, or there is some additional negative relationship between agreeableness and conscientiousness that cancels out a potential influence of alpha.

Removing method variance also did not eliminate relationships between facets that are not predicted to be correlated by the alpha-beta model. The average correlation between neuroticism and extraversion facets is r = -.05, which is small, but not notably smaller than the predicted correlations (r = .01 to .07).

Moreover, some of these correlations are substantial. For example, excitement seeking is negatively related to anxiety (r = -.24) and warmth is negatively related to depression (r = -.22). Any structural model of personality structure needs to take these findings into account.

A Closer Examination of Extraversion and Openness

There are many ways to model the correlations among extraversion and openness facets. Here I demonstrate that the correlation between extraversion and openness depends on the modelling of secondary loadings and correlated residuals. The first model allowed for extraversion and openness to be correlated. It also allowed for all openness facets to load on extraversion and for all extraversion facets to load on openness. Residual correlations were fixed to zero. This model is essentially an EFA model.

Model fit was as good as for the baseline model, CFI = .779 vs. 778, RMSEA = .039 vs. .040. The pattern of secondary loadings showed two notable positive loadings. Excitement seeking loaded on openness and open to activities loaded on E. In this model the correlation between extraversion and neuroticism was .08, SE = .17. Thus, the positive correlation in the model without secondary loadings was caused by not modelling the pattern of secondary loadings.

However, it is also possible to fit a model that produces a strong correlation between E and O. To do so, the loadings excitement seeking and openness to actions can be set to zero. This pushes other secondary loadings to be negative, which is compensated by a positive correlation between extraversion and openness. This model has the same overall fit as the previous model, both CFI = .779, both RMSEA = .039, but the correlation between extraversion and openness jumps to r = .70. The free secondary loadings are all negative.

The main point of this analysis is to show the importance of facet correlations for structural theories of personality traits. In all previous studies, including my own, the higher-order structure was examined using Big Five scales. However, the correlation between an Extraversion Scale and an Openness Scale provides insufficient information about the relationship between the Extraversion Factor and the Openness Factor because scales always confound information about secondary loadings, residual correlations, and factor correlations.

The goal for future research is to find ways to test competing structural models. For example, the second model suggests that any interventions that increase extraversion would decrease openness to ideas, while the first model does not make this prediction.

Conclusion

Personality psychologists have developed and tested structural models of personality traits for nearly a century. In the 1980s, the Big Five factors were identified. The Big Five have been relatively robust in future replication attempts and emerged also in this investigation. However, there has been little progress in developing and testing hierarchical models of personality that explain what the Big Five are and how they are related to more specific personality traits called facets. There have also been attempts to find even broader personality dimensions. An influential article by Digman (1997) proposed that a factor called alpha produces correlations among neuroticism, agreeableness, and conscientiousness, while a beta factor links extraversion and openness. As demonstrated before, Digman’s results could not be reproduced and ignored evaluative bias in personality ratings (Anusic et al., 2009). Here, I show that empirical tests of higher-order models need to use a hierarchical CFA model because secondary loadings create spurious correlations among Big Five scales that distort the pattern of correlations among the Big Five factors. Based on the present results, there is no evidence for Digman’s alpha and beta factors.