Conclusion: A meta-analysis of clinical trials in Western nations that compare psychotherapy to treatment as usual shows an average effect size of half a standard deviation with 95% of effects ranging from a quarter to three-quarters of a standard deviation. Thus, psychotherapy is an important component of treatment for depression.
Introduction
Psychotherapy works, .
However, a statistically significant result alone does not really help practitioners and patients assess the benefits of psychotherapy. The important question is not “Is the effect greater than zero?” but “How much does psychotherapy help?”
A single study cannot answer this question precisely because psychotherapy studies tend to have relatively small samples and therefore substantial sampling error. Meta-analysis was developed to address this problem. A simple meta-analysis combines the effect-size estimates from individual studies while taking their sampling error (standard errors) into account to obtain a more precise estimate of the average effect. As the number of studies increases, sampling error in the average estimate can become practically negligible.
The headline estimate of psychotherapy effectiveness is about 70% of a standard deviation on a measure of clinical depression such as the Beck Depression Inventory (), with very little sampling error (; Plessen et al., 2023). This suggests that psychotherapy has a substantial positive effect. However, although the average effect can be estimated very precisely, two other sources of uncertainty undermine the usefulness of this estimate: (a) publication bias and (b) variation in true effect sizes across populations, treatments, control conditions, and other study characteristics.
Publication Bias
One problem is publication bias. Studies that show that psychotherapy is effective may be more likely to be published than studies that fail to show an effect. If so, the published literature will exaggerate effectiveness. Plessen et al. (2023) therefore included PET–PEESE, a statistical method designed to estimate the effect after accounting for a possible relationship between effect size and sampling error.
The method exploits the fact that small studies need larger estimated effects to achieve statistical significance, whereas large studies can achieve significance with smaller estimated effects. If statistically significant findings are preferentially published, this creates a relationship between sampling error and observed effect sizes. PET–PEESE uses this relationship to estimate what the effect would be as sampling error approaches zero. Across the PET–PEESE analyses in Plessen et al.’s multiverse, the estimated effect averaged only .
The problem is that publication bias is not the only reason why effect sizes might be related to study size. Small and large studies may differ systematically in other ways. For example, smaller studies might provide more intensive and costly treatments, whereas larger trials might use briefer or online interventions. Control groups, patient populations, and other study characteristics may also differ with study size. If these characteristics genuinely influence treatment effects, PET–PEESE can mistake real differences in treatment effectiveness for publication bias and adjust the effect downward too strongly.
We are therefore left with remarkably different answers to a seemingly simple question. A conventional meta-analysis suggests an effect of , whereas PET–PEESE suggests an effect closer to . Is psychotherapy highly effective, only modestly effective, or somewhere in between?
Fortunately, other methods can help distinguish publication bias from genuine variation in treatment effects. The first aim of this blog post is to use these methods to obtain a more credible estimate of the effectiveness of psychotherapy.
Heterogeneity
The second problem is heterogeneity. The effectiveness of psychotherapy may vary across populations, types of treatment, control conditions, and other study characteristics. In other words, there may be no single effect size that describes the effectiveness of psychotherapy under all conditions. An average can still be calculated, but it may not provide a useful prediction for any particular treatment setting.
In meta-analysis, variation in the true effect sizes across studies is called heterogeneity. In Plessen et al.’s full three-level meta-analysis, the average effect was g = .72, but the between-study variance was tau² = .364, corresponding to tau = .60. Thus, although the average effect was estimated very precisely, the true effects varied substantially from study to study.
Assuming a normal distribution of true effects, approximately 95% of study-level effects would be expected to fall between g = -.46 and g = 1.90. Thus, the same meta-analysis that estimates the average effect very precisely also allows for true effects ranging from moderately favoring the control condition to extremely large benefits of psychotherapy.
This wide range shows why a precisely estimated average does not necessarily answer the question, “How effective is psychotherapy?” An average of g = .72 tells us that psychotherapy is beneficial on average, but it provides little guidance about the effect we should expect in a particular population, treatment, or comparison condition.
To obtain more informative estimates, we need to understand why treatment effects vary across studies. The second aim of this blog post is therefore to identify one or more groups of studies with reasonably similar true effect sizes and to estimate how effective psychotherapy is under more specific conditions.
This goal may seem counterintuitive because a general rule in statistics is that larger samples are more informative. This is clearly true within an individual study: larger samples reduce random sampling error and produce more precise estimates. In meta-analysis, however, simply adding more studies does not necessarily make the answer more informative. Adding studies reduces sampling error in the average effect, but it can also increase heterogeneity if the added studies examine different populations, treatments, countries, or control conditions.
In this sense, less can be more. A meta-analysis of a smaller but more comparable set of studies may provide a more useful estimate than a much larger meta-analysis that averages over systematically different conditions. For example, an estimate of the effectiveness of cognitive behavioral therapy for adults within a particular healthcare setting and relative to a particular control condition may be more informative than a single average that combines different countries, therapies, populations, and comparison groups.
The goal is therefore not to make the meta-analysis as large as possible, but to define groups of studies for which an average effect has a clear and useful interpretation.
Munder et al.’s Meta-Analysis
The Study
I used Munder et al.’s (2022) meta-analysis because it examined a particularly plausible moderator: the treatment received by patients in the control group. In psychotherapy trials, the control condition plays a role similar to the comparison condition in a drug trial. Some patients are assigned to a waitlist and may receive little or no treatment during the study. In other trials, patients in the control group receive treatment as usual (TAU), and psychotherapy is added only for the treatment group. For example, both groups may receive antidepressant medication, while only the treatment group also receives psychotherapy.
Treatment as usual can also vary substantially in intensity and effectiveness. The more effective the treatment received by the control group, the smaller the additional benefit of psychotherapy is likely to be. This means that an average effect size that combines waitlist controls with different forms of treatment as usual may obscure meaningful differences in effectiveness.
Another plausible moderator is the country in which the study was conducted. Even without a specific hypothesis about cultural differences in the treatment of depression, psychological effects often vary across countries and cultures. Country can therefore serve as a useful proxy for differences in culture, healthcare systems, recruitment practices, and other contextual factors that may influence treatment effects.
A third possible moderator is the type of psychotherapy. Although meta-analyses suggest that many forms of psychotherapy are effective, it remains possible that some treatments produce larger effects than others.
The goal is not only to determine whether these moderators predict effect sizes. Even more important is to determine how much heterogeneity remains after accounting for them. If control condition, country, and treatment type explain a substantial portion of the variation across studies, we can obtain more informative estimates for specific sets of conditions—for example, the expected effect of CBT in U.S. studies compared with a waitlist control group.
Random Effects Meta-Analysis
I first analyzed the data with a standard random-effects meta-analysis using the R package metafor. This model estimates the average effect size and the amount of heterogeneity while assuming that the observed studies are not distorted by publication bias. The analysis produced an average effect of g = .72, SE = .08, together with substantial heterogeneity, tau = .67. These results closely replicate the findings of Plessen et al. (2023): psychotherapy appears highly effective on average, but treatment effects vary greatly across studies.
PET
I next applied PET, one of the regression-based methods used by Plessen et al. (2023) to address publication bias. PET tests whether effect-size estimates are related to their standard errors and extrapolates this relationship to a hypothetical study with no sampling error.
The analysis showed a strong relationship between effect sizes and sampling error, b = 3.29, SE = .57. The estimated intercept at zero sampling error was slightly negative, g = -.07, SE = .15, and not significantly different from zero. Taken literally, PET would therefore suggest that there is no convincing evidence for an average psychotherapy effect after correcting for publication bias.
However, this interpretation depends critically on the assumption that the relationship between effect size and sampling error is caused by publication bias. Moreover, substantial heterogeneity remained even after fitting PET, tau = .57. Thus, the model still allows for large positive effects in some studies while simultaneously estimating an average effect close to zero.
zcurve3
To examine publication bias with fewer assumptions about the relationship between effect size and study size, I also analyzed the data with zcurve3. Z-curve converts each effect size and its standard error into a z-value. A two-sided z-value greater than 1.96 is statistically significant. Z-curve uses the distribution of statistical evidence, particularly the significant z-values, to estimate the underlying distribution of evidential strength and to predict how many significant and non-significant results should be observed.
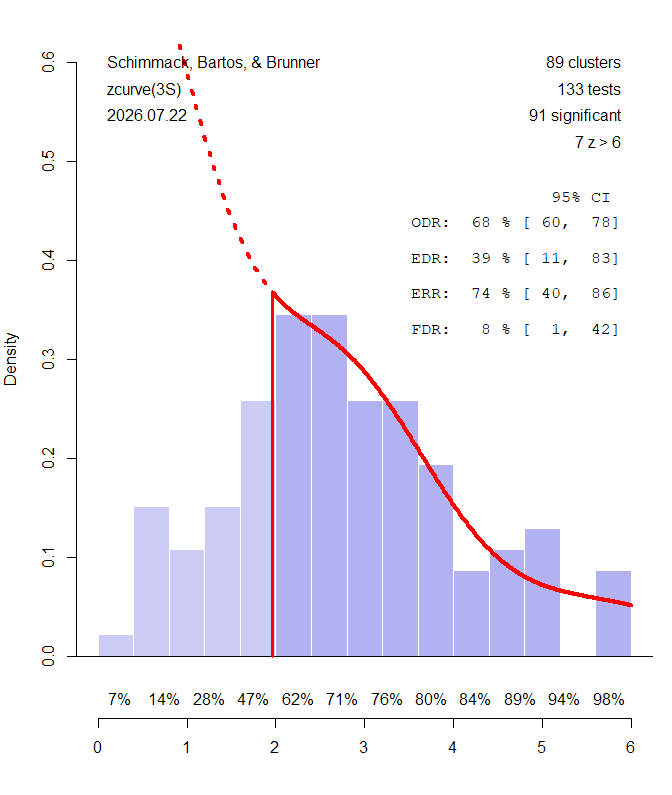
Figure 1 shows that the fitted distribution predicts somewhat more non-significant results than were actually observed. The expected discovery rate—the proportion of statistically significant findings predicted by the model—is only 39%, whereas the observed discovery rate is higher. This pattern is consistent with some selection for statistical significance. However, unlike PET, z-curve is very uncertain about the magnitude of this bias. The 95% confidence interval for the expected discovery rate extends as high as 83%, so the data are also compatible with little or no excess of significant findings.
Z-curve also reveals substantial variation in the strength of evidence across studies. Studies with non-significant z-values have low estimated power, whereas many of the statistically significant studies have moderate to high power, ranging from approximately 62% to 98%. The average estimated power of the significant studies—the Expected Replication Rate—is 74%. Z-curve also estimates the maximum proportion of statistically significant findings that could be false positives. Although the upper bound of the 95% confidence interval reaches 42%, even this conservative bound implies that the majority of statistically significant findings are unlikely to be false positives.
Zcurve3 can also provide estimates on the effect-size scale. The estimated overall mean effect is g = .33, with a wide 95% confidence interval ranging from g = .12 to g = .90. This interval contains both the small PET estimate and substantially larger conventional random-effects estimates. Rather than forcing the data toward one of these answers, zcurve3 makes the uncertainty about publication bias explicit, rather than assuming that bias is large (PET) or that there is no bias (RMA).
Making Sense of Heterogeneity
The z-curve plot shows heterogeneity in the strength of evidence below the x-axis. These values are estimates of local statistical power for studies with z-values in the corresponding ranges. Studies with small z-values have low estimated power and therefore provide little information about the magnitude of the underlying true effect. In the present data, local power is below 50% throughout the non-significant range. Around z = 2, however, estimated local power rises above 50%, reaching 62% for results just above the conventional significance thresho ld and increasing further for larger z-values.
This provides a principled way to distinguish relatively informative from highly uncertain effect-size estimates. Importantly, the criterion is not statistical significance itself. The criterion is estimated local power. In these data, the point at which local power exceeds 50% happens to coincide approximately with the conventional significance threshold. Thus, focusing on the statistically significant results in this particular dataset amounts to focusing on the subset for which zcurve3 estimates that there is more signal than noise.
zcurve3 also estimates the maximum false-positive rate. The upper bound of the 95% confidence interval is 39%. Thus, even under a conservative interpretation, the majority of results in this more informative subset are estimated to reflect a genuine positive treatment effect.
The main advantage of zcurve3 is that it is designed to examine heterogeneity. There are two types of heterogeneity to consider. Heterogeneity in the strength of evidence and heterogeneity in effect sizes.
The z-curve plot shows heterogeneity in the strength of evidence below the x-axis. These values are local power estimates for the corresponding ranges of z-values. Average power is low for non-significant results. These are mostly studies with small samples and large sampling error, and they provide little information about the magnitude of the underlying true effects. In contrast, studies with z-values greater than about 2 have considerably greater evidential strength. For results just above the conventional significance threshold, estimated local power is already 62% and increases further for larger z-values.
zcurve3 also estimates the maximum false-positive rate. The upper limit of the 95% confidence interval is 39%. Thus, even under this conservative estimate, the majority of the significant results are expected to reflect a genuine positive treatment effect. It is therefore possible to identify a subset of studies that provides substantially stronger evidence about treatment effectiveness.
zcurve3 also provides effect-size estimates for subsets of studies defined by their observed z-values. For the statistically significant results, the estimated mean effect size is g = 1.41, but uncertainty is substantial, 95% CI [.56, 2.21]. Heterogeneity among these effects is also very large, tau = .98, with a wide 95% CI [.21, 1.67]. Thus, focusing on studies with stronger evidence does not solve the heterogeneity problem. We still need to ask why some studies produce much larger effects than others. This requires examining potential moderators—that is, study characteristics that explain variation in effect sizes—with the goal of identifying one or more groups of studies for which an average effect size has a meaningful interpretation.
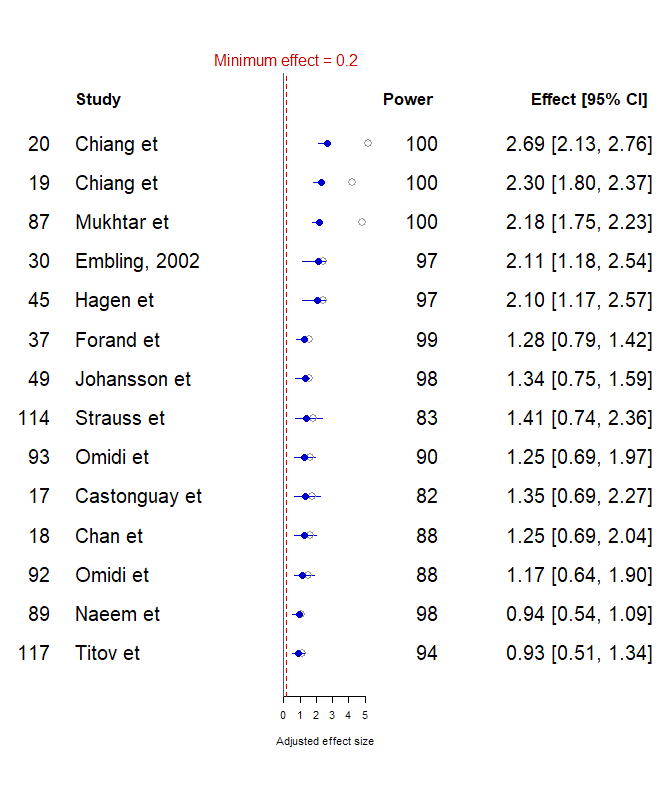
It therefore makes sense to examine studies with strong evidence more closely. A complication is that unusually large observed effects may partly reflect sampling error or selection. zcurve3 addresses this problem by using empirical-Bayes shrinkage to produce adjusted effect-size estimates that pull unusually large observed effects toward more plausible underlying values. Figure 2 shows these adjusted estimates.
The first five effects, representing four studies, still appear unusually large even after this adjustment. These studies may be scientifically interesting and deserve careful examination and replication, but they are not necessarily informative about the average effect in the broader group of studies. Instead, if their unusually large effects arise from study characteristics that are not shared by the remaining studies, combining them with the rest simply increases unexplained heterogeneity.
Chiang et al. provides a useful example. It is the only study from Taiwan in this meta-analysis. Consequently, its exceptionally large effect is perfectly confounded with the individual study: with only one Taiwanese study, we cannot determine whether the effect reflects Taiwan, some other feature of the study, or sampling variation. The study is informative about that particular Taiwanese sample, but it cannot establish a general Taiwanese treatment effect and it contributes little to estimating the effect for a population of Western studies. For that purpose, including it mainly adds heterogeneity that cannot be explained or generalized.
To produce a more homogeneous and interpretable set of studies, I applied several additional restrictions. First, I removed five studies with unique characteristics or questionable reporting that made their unusually large effects difficult to interpret or generalize. Second, I removed studies with large sampling error (SE > .30). This is actually a relatively modest restriction compared with Stanley, Jarrell, and Doucouliagos (2010), who proposed estimating meta-analytic effects from only the most precise 10% of published estimates when publication selection is a concern. Their argument is that highly imprecise studies can contribute more noise than useful information.
I also removed the small number of studies with negative effect-size estimates because there were too few to estimate directional selection bias separately. Finally, I excluded samples from non-Western countries. Previous research has shown that psychological effects often vary across countries and cultures, and the present data also suggested substantial country differences. Combining isolated studies from very different populations into a single average would therefore increase unexplained heterogeneity without producing an estimate that clearly applies to either population.
The following analyses therefore focus on a smaller and more homogeneous set of studies and ask a more specific question: How effective is psychotherapy for depression under reasonably comparable conditions in Western countries?
Refined Sample
Random Effects Meta-Analysis
The average effect-size estimate decreased from g = .72 to g = .50. More importantly, heterogeneity decreased dramatically, from tau = .67 to tau = .22. The corresponding 95% prediction interval ranges from approximately g = .06 to g = .94. Thus, although treatment effects still vary substantially, nearly the entire predicted distribution of true effects is now positive.
I next examined study country, waitlist versus treatment-as-usual (TAU) control groups, and type of treatment as moderators. Individual differences associated with country and treatment type were generally modest. The clearest moderator was the control condition: studies using a waitlist produced effects approximately g = .23 larger (SE = .06) than studies using TAU controls.
More important than any individual moderator coefficient, however, was their combined ability to explain heterogeneity. After accounting for country, control condition, and treatment type, residual heterogeneity decreased further to tau = .13. Centered around an overall effect of approximately g = .50, this corresponds to a range of true effects of roughly g = .24 to g = .76.
This is a much more informative answer to the question of psychotherapy effectiveness. Instead of an average surrounded by effects ranging from negative to extremely large, the refined analysis suggests that under reasonably comparable conditions psychotherapy produces effects ranging from about one-quarter to three-quarters of a standard deviation, with an average of about half a standard deviation.
PET
The PET regression again showed a strong relationship between effect-size estimates and their standard errors, b = 2.23, SE = .52. In PET, this relationship is typically interpreted as evidence that effect-size estimates are increasingly inflated as sampling error increases.
However, when country, control condition, and treatment type were added to the regression, the coefficient for sampling error was reduced by about half, from b = 2.23 to b = 1.10, and was no longer statistically significant (SE = .57).
This result illustrates a fundamental limitation of regression-based tests of publication bias. A correlation between effect-size estimates and standard errors does not reveal why the correlation exists. PET attributes this pattern to publication bias, but the same pattern can arise when small and large studies differ systematically in ways that genuinely affect treatment outcomes.
In these data, much of what initially looked like publication bias could be explained by study characteristics. In other words, the apparent bias signal was partly heterogeneity in disguise.
zcurve3
zcurve3 does not yet allow moderators to be specified directly in the model. However, there are two ways to combine zcurve3 with moderator analyses. One approach is to first fit a random-effects meta-regression, remove the variation explained by the moderators, and then analyze the resulting moderator-adjusted effect sizes with zcurve3. To preserve the overall treatment effect, I added the overall mean effect back to the residuals. Thus, the adjusted effects retain the average psychotherapy effect while removing systematic variation associated with country, control condition, and treatment type.
A second approach is to use the bias-corrected study-level effect-size estimates produced by zcurve3 and analyze these estimates in a conventional meta-regression. Here, I used the first approach.
The z-curve plot of the moderator-adjusted effects shows no evidence of excess significance. The observed discovery rate was 79%, almost identical to the expected discovery rate of 78%. If publication selection had produced a large excess of significant findings, the observed discovery rate should have been substantially higher than the rate predicted from the evidential strength of the studies. Instead, the two estimates differ by only one percentage point.
Visual inspection leads to the same conclusion. The fitted z-curve closely reproduces the observed distribution, including the non-significant results to the left of the significance threshold. Thus, after removing systematic variation associated with the moderators, the strong publication-bias signal suggested by PET is no longer apparent.
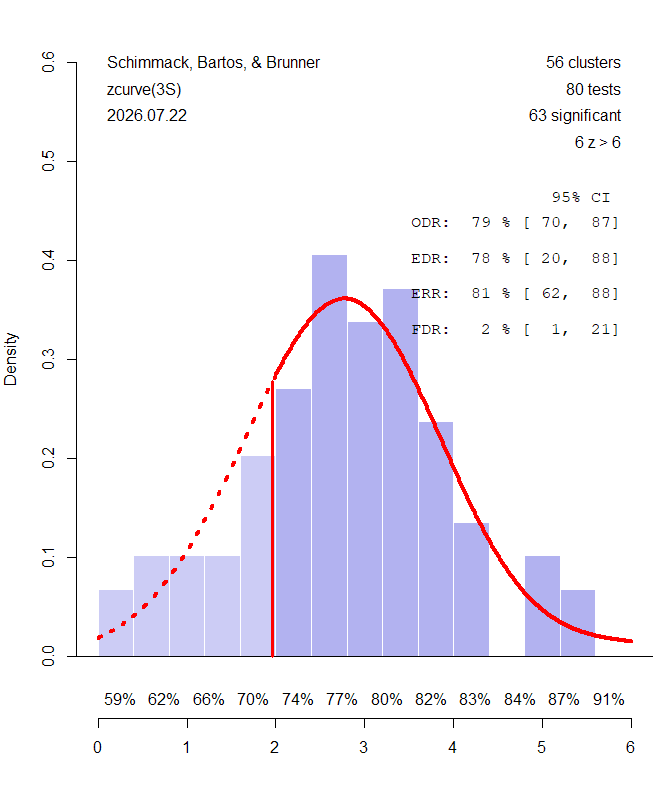
The overall mean effect is estimated to be g = .53, 95%CI [.09, .59], but the confidence interval remains relatively wide because zcurve3 continues to allow for the possibility of publication selection. In this model, some non-significant results are inferred rather than directly observed, which creates additional uncertainty about the overall mean. If the model were respecified under the assumption that there is no publication bias and all observed results were analyzed directly, the confidence interval would become much narrower—but the analysis would then essentially reduce to another conventional random-effects meta-analysis.
More informative is the convergence of the point estimates across models with very different assumptions. The conventional random-effects model and the selection model both estimate an average effect of approximately half a standard deviation. The mean among the significant results is similarly estimated at g = .52, and the median is g = .54. Heterogeneity is also small, tau = .09, 95% CI [.06, .21] compared to the heterogeneity for all studies (.98, 95%CI [.21, 1.66]. Thus, the smaller dataset does produce a more informative average estimate.
The agreement between the RMA results and these results with a selection model provides an important robustness check. A model that assumes the observed literature is unbiased and a model that explicitly allows for missing non-significant results arrive at essentially the same estimate of psychotherapy effectiveness.
Step-Function Selection Model
To further examine the robustness of the results, I analyzed the data with a step-function selection model (Hedges & Vevea, 1996; Vevea & Hedges, 1995). Unlike PET, this model does not infer publication bias from a correlation between effect sizes and standard errors. Instead, it allows the probability that a result is observed to differ across ranges of p-values.
I specified selection steps at p = .025, corresponding to statistical significance at p = .05 for a two-sided test, and at p = .50, which separates positive from negative effect-size estimates. Because negative effect-size estimates had already been excluded from this analysis, the estimated weight for this final interval is necessarily close to zero and is not substantively informative.
The selection model estimated an average effect of g = .45, SE = .03, with little remaining heterogeneity, tau = .10, 95% CI [.00, .17]. The model did find some evidence of preferential selection of statistically significant results. The relative weight for non-significant positive results was .54, 95% CI [.27, .99]. In other words, the model estimates that non-significant positive results may have been only about half as likely to be observed as statistically significant results, although there is considerable uncertainty about the magnitude of this selection.
Most importantly, allowing for this degree of publication selection had little effect on the estimated treatment effect. Because most results in this refined sample were statistically significant, the estimated mean was largely determined by studies in the region receiving full selection weight.
Thus, a second selection model, based on very different assumptions from zcurve3, reaches essentially the same conclusion: some publication selection may be present, but correcting for it does not materially change the estimated effect of psychotherapy or the amount of remaining heterogeneity.
Robust Bayesian Model Averaging (RoBMA)
A final robustness analysis used Robust Bayesian Model Averaging (RoBMA). RoBMA is useful here because it does not require us to decide in advance whether publication bias should be modeled with PET–PEESE, a step-function selection model, or not at all. Instead, it simultaneously fits a large set of models—including conventional random-effects models, PET–PEESE models, and several step-function selection models—and gives greater weight to models that are better supported by the data.
In the present data, the PET-type models received little support, whereas the selection models received considerably more weight. Thus, when RoBMA was allowed to choose among competing explanations of publication bias, the data favored the step-function approach rather than the PET interpretation.
The posterior probability that the average treatment effect is different from zero was essentially 1.00. There was also strong evidence for remaining heterogeneity, with a posterior inclusion probability of .94, and some evidence for publication bias, with a posterior inclusion probability of .72. These probabilities tell us whether these components are likely to be present, but not how large they are.
RoBMA reports both unconditional estimates, which average across models that include and exclude a particular component, and conditional estimates based only on models in which that component is present. In this analysis, the estimates were essentially identical because the evidence for a treatment effect was overwhelming. The model-averaged effect size was g = .46, SE = .04, and residual heterogeneity was small, tau = .10, 95% interval [.05, .17].
Most importantly, RoBMA independently reproduced the result obtained with the step-function model: some publication selection may be present, but accounting for it leaves the estimated psychotherapy effect at roughly half a standard deviation, with little remaining heterogeneity.
Discussion
What Have We Learned About Meta-Analysis?
This reanalysis illustrates two problems that can make meta-analytic estimates misleading even when sampling error is very small.
First, evidence of a relationship between effect sizes and standard errors should not automatically be interpreted as publication bias. Regression-based methods such as PET can mistake systematic differences between studies for selective publication. In the present data, PET initially suggested that the psychotherapy effect was close to zero. However, the relationship between effect sizes and standard errors was substantially reduced after country, control condition, and treatment type were included as moderators. What initially looked like publication bias was therefore, at least in part, heterogeneity in disguise.
Selection models that do not rely on this correlation produced a very different conclusion. zcurve3 found no clear evidence of excess significance, while the step-function selection model and RoBMA suggested that some publication selection may nevertheless be present. Importantly, correcting for this possible selection had little effect on the estimated treatment effect. Across these different models, estimates converged at approximately half a standard deviation.
The standard recommendation is therefore to use multiple methods and to include selection models. More importantly, discrepancies need to be examined in terms of the different assumptions that models make. Here this analysis showed that one model with different assumptions led to different results because the assumption was false.
Second, meta-analysis should not simply maximize the number of studies and then report heterogeneity as an unfortunate side effect. A precise average of studies that estimate systematically different effects may have little practical meaning. The goal should be to identify moderators that explain these differences and, where necessary, define more homogeneous groups of studies for which an average effect has a meaningful interpretation.
This sometimes means that less is more (Cohen, 1990). A small number of reasonably comparable studies can provide a more useful estimate than a much larger collection of studies that differ substantially in populations, treatments, control conditions, and settings. Unique studies remain scientifically valuable, but a study representing a population or treatment found nowhere else in the meta-analysis cannot tell us whether its unusual effect generalizes beyond that individual study.
The goal is therefore not to eliminate heterogeneity for its own sake. It is to explain heterogeneity well enough that the resulting average describes a meaningful population of studies.
What Have We Learned About Psychotherapy for Depression?
The substantive conclusion is considerably clearer than the original range of meta-analytic estimates from approximately g = .18 to g = .72 suggested.
For reasonably comparable studies conducted in Western countries, psychotherapy produces an average improvement in depression of approximately half a standard deviation compared with treatment as usual. After accounting for country, control condition, and treatment type, remaining heterogeneity was relatively small. The distribution of true study-level effects was approximately g = .2 to g = .8, suggesting that psychotherapy generally produces effects ranging from small to large rather than effects ranging from harmful to extremely large.
The clearest moderator was the control condition. Effects in studies using a waitlist were approximately .2 standard deviations larger than effects in studies comparing psychotherapy with treatment as usual. Country and treatment type also explained some variation, although their individual differences were generally smaller.
Thus, the best answer to the question “How effective is psychotherapy for depression?” is not a single universal number. For the types of studies examined here, a reasonable estimate is about g = .5 compared with treatment as usual, with somewhat larger effects against waitlist controls and modest variation across countries and treatment types.
These findings also point to the limits of further small psychotherapy trials. Small studies were sufficient to establish that psychotherapy works. They are much less useful for determining whether one therapy works slightly better than another or which patients benefit most. Detecting these smaller differences requires much larger samples in which other study characteristics are held reasonably constant.
The next step therefore is not simply to accumulate more small studies. It is to conduct large, coordinated, multi-site studies that can estimate treatment effects precisely enough to determine which treatments work best, under which conditions, and for which patients.
Conclusion
Psychotherapy works, p<.05, is not a scientific conclusion, even when it is based on a meta-analysis of hundreds of studies. Here I showed that the existing evidence allows for a more informative answer, at least for the conditions represented by studies conducted in Western countries. Compared with treatment as usual, psychotherapy reduces depression symptoms by about half a standard deviation on average. This is a clinically meaningful effect, but it is still an average. Across reasonably comparable studies, typical treatment effects appear to range from roughly one-quarter to three-quarters of a standard deviation. Variation across individual patients is likely to be considerably larger.
Thus, how much psychotherapy will help a particular patient remains uncertain. What the evidence does show is that, under the conditions examined here, true study-level effects that favor the control condition appear to be uncommon. Given the substantial average benefit of psychotherapy for patients with depression, psychotherapy should be offered as a core treatment option.