
Last year, Maria Soto, and I published a z-curve analysis of emotion research in Cognition and Emotion (Soto & Schimmack, 2024). During the review process, we received critical comments from Reviewer A (A = anonymous or A = %$#%^). Critical comments are the main point of peer-review, but these comments misrepresented z-curve. In the second round of reviews, Reviewer A used simulations with sample sizes of N = 2 to question our findings that were based on real samples with sample sizes typical in psychology, not N = 2. Not surprisingly, our results held up when we conducted sensitivity analyses (Questionable Reviewer Practices). I am (not) pleased to report that Reviewer A (actually a team of authors) are back with new simulations that gaslight readers who do not have the time or motivation to delve deeply into z-curve. Fortunately, this time they are trying to publish a commentary, and their identity is known. To maintain confidentiality during the review process, I am going to continue to call them Reviewer A.
All of the simulations presented in this manuscript serve only the purpose to motivate the foregone conclusion that z-curve results should not be trusted. I will show that z-curve results are not perfect, but they provide credible information. Rather Reviewer A should not be trusted.
“To date, we have only examined a limited set of scenarios. Yet, we have found relatively few instances in which estimates from the typical use of the 𝑍-curve approach (i.e., analyzing only 𝑝-values < .05) have performed well. As a result, conclusions based on a 𝑍-curve analysis should currently be taken with caution, especially given that the extent and form of publication bias is likely to remain unknown in most application settings.”
This statement implies that z-curve lacks proper validation with simulation studies. Reviewer A does not tell readers that z-curve has been tested with hundreds of scenarios in Brunner and Schimmack (2020), Bartos and Schimmack (2022), and Schimmack and Bartos (2023). They also do not mention that it performs better than other selection models that try to correct for bias (Brunner & Schimmack, 2020). When Jerry and I developed z-curve, he would create simulations where he would know the true results and I did not. I would then use z-curve and send him the results. We only proceeded to develop the method because it did well in these blind simulation tests.
So, the question is who is more trustworthy: reviewer A or z-curve?
Now let’s examine the simulations that Reviewer A presented to support the claim that it is difficult to find situations where z-curve performs well. There are essentially three scenarios, all equally unlikely to match any real data.
Scenario 1: 10% of studies test a true null hypothesis, 90% of studies test a true alternative hypothesis; all with 80% power (no two studies have exactly the same power).
Scenario 2: 50% of studies have low power (all 17%) and 50% of studies have very high power (94%).
Scenario 3: 50% of studies have low power (all 17%) and 50% of studies have even higher power (99%).
I will not bore you with the results of these simulation studies because they are irrelevant for the evaluation of publications in psychology journals. None of these scenarios are even close to real datasets. Also, z-curve handles these scenarios well.
Selection Bias
The real reason why the authors are able to show bias in z-curve estimates is that they simulate a gradual selection bias for non-significant and significant results. For non-significant results, this implies that p-values of .4 are more likely to be reported than p-values of .8. This is as ridiculous as it is irrelevant because z-curve does not use the distribution of non-significant results that are often absent. It is well known that focal hypothesis tests have a 90% success rate, and that most of the non-significant results are missing. Thus, the simulation of gradual bias for non-significant results is irrelevant (see Figure 1).
So, let us examine the one relevant and well-known fact about selection models. All selection models, z-curve included (but also p-curve, the random effects selection model, etc.) assume that selection is based on the dichotomous criterion of statistical significance. Results that do not support a hypothesis (p > .05 or sometimes p > .10) are not reported and p-values that support a hypothesis are reported (p < .05). When this assumption is not true, a selection model will produce biased results. It is true that this has not been sufficiently examined, so we can use Reviewer A’s simulation as a first step towards examining how gradual selection of significant results influence z-curve estimates.
It is plausible that researchers may be reluctant to report a p-value of .04 or even .02. They may use some additional p-hacking to get the p-value below .01. However, Reviewer A’s simulation is based on the assumption that selection bias extends all the way to z-scores of 4 that correspond to p-values of .00006. Accordingly, researchers would still p-hack or not publish results with a p-value of .005 or even .001. The only reason to make such an implausible assumption is to exaggerate the bias in z-curve estimates. However, let’s examine the consequences of this assumption with a realistic scenario that reproduces the observed distribution of z-values in hand-coded focal tests in the emotion literature.
I focus on the hand-coded focal tests because Reviewer A also dismissed our results based on automatically extracted test statistics. To further evaluate the trustworthiness of Reviewer A, you need to know that Reviewer A simply ignored that we also published the results of these hand-coded data. They simply do not exist in the commentary.
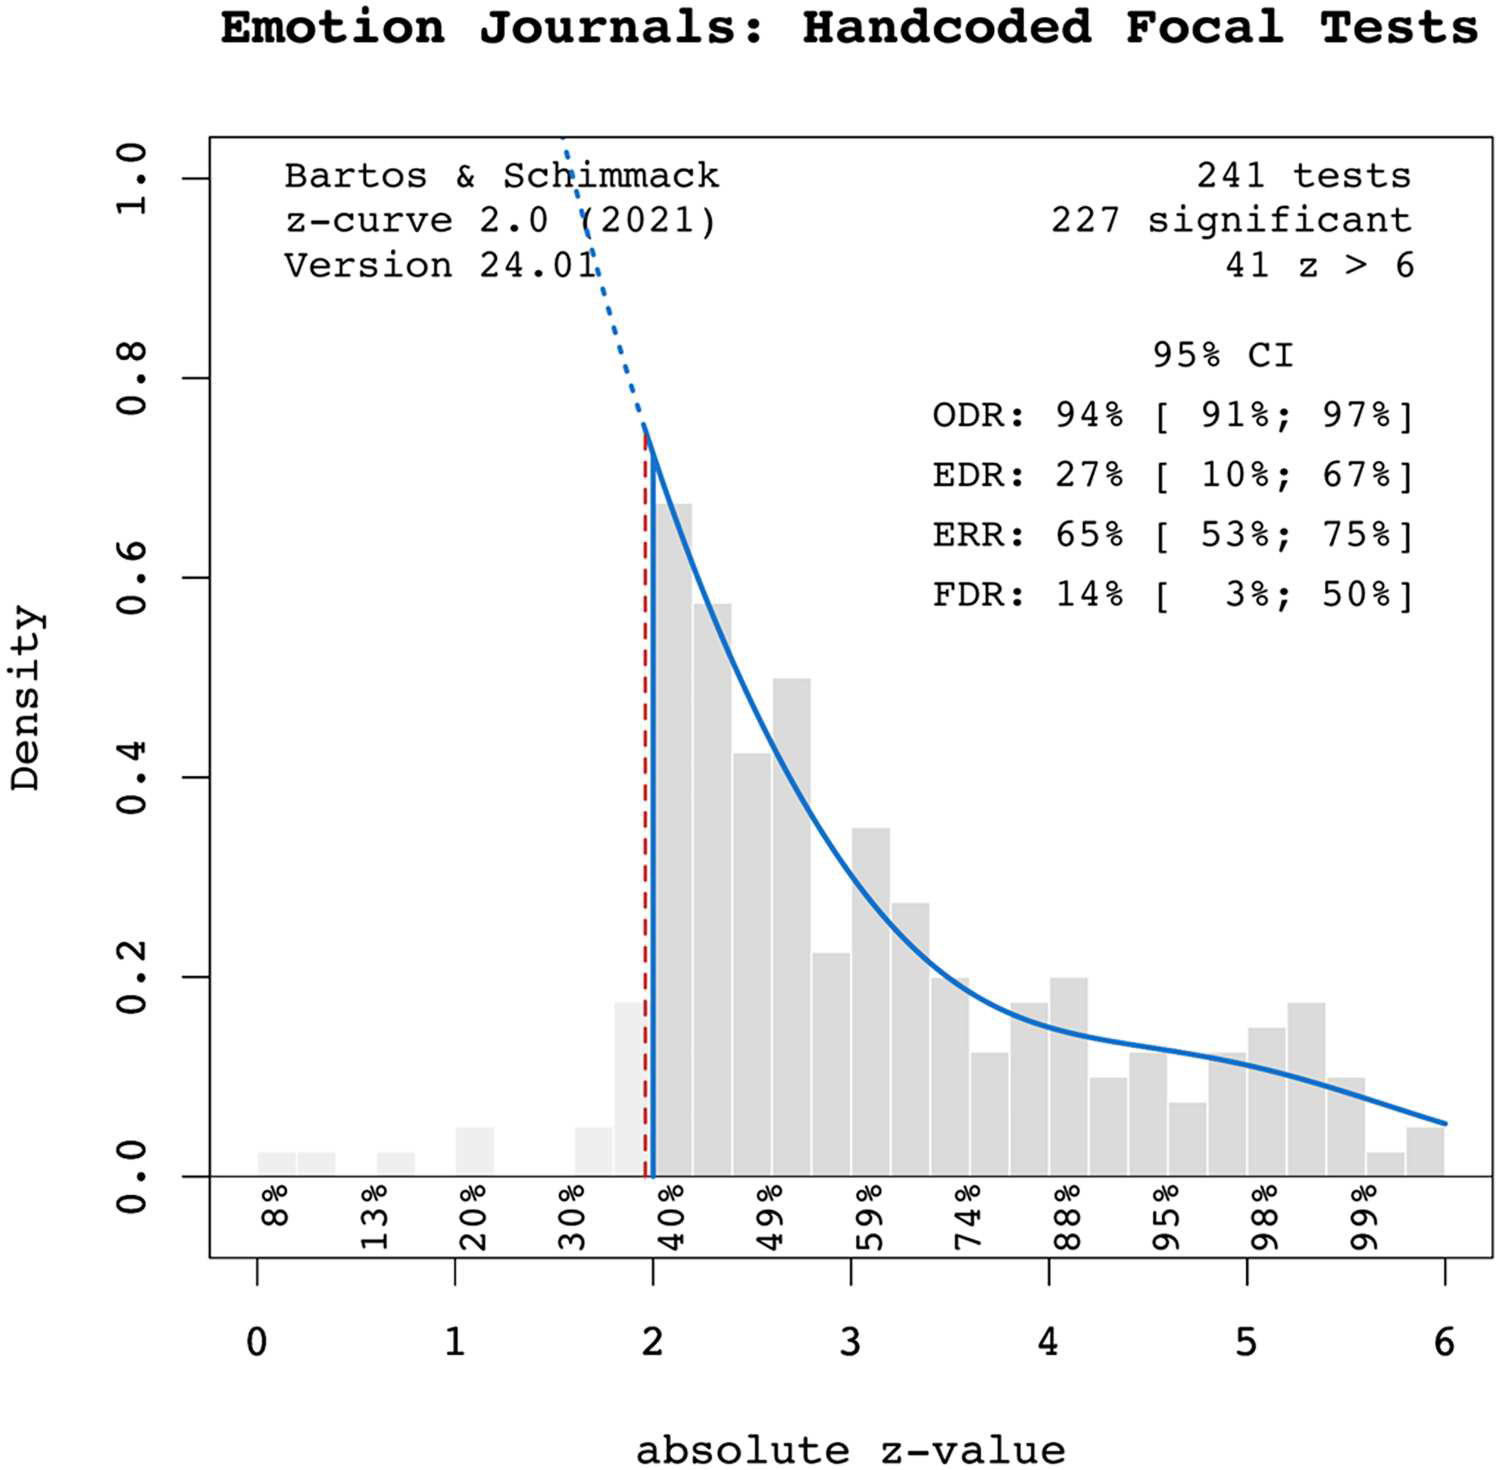
Take a look at the plot. What looks strange in this plot? Yes, observed z-scores disappear as soon as we look at z-values below 1.96 that are not significant at p < .05. Even marginally significant results (.10 > p > .05) that are often used to reject a null hypothesis are rare. So, there is no evidence of gradual bias for non-significant results. They are just not reported or p-hacked to be significant. We do not need a formal bias test to notice that bias is present.
We also see that the frequency of z-scores above 1.96 decreases quickly. This decrease implies that the mode (peak) of the distribution of all results (including unpublished non-significant results) is in the range of non-significant results. So, it is clearly not a value of 2.8, 3.5, or 4.5 which was used in the useless simulations of Reviewer A.
The assumption that z-values between 2 and 4 have gradual selection bias cannot be tested because this biases merely flattens the slop in the histogram. That is, if this bias is present in these data, data without this bias would show an even steeper decline in z-values between 2 and 4. As a result, a model that does not correct for the gradual selection bias will overestimate the expected discovery rate (average power of all studies), the Expected Replication Rate (ERR), and underestimate the False Positive Risk (FDR; the maximum percentage of false positive results).
I used Reviewer A’s simulation code to create data that produce similar results to the ones in the emotion literature AFTER the selection bias was applied.
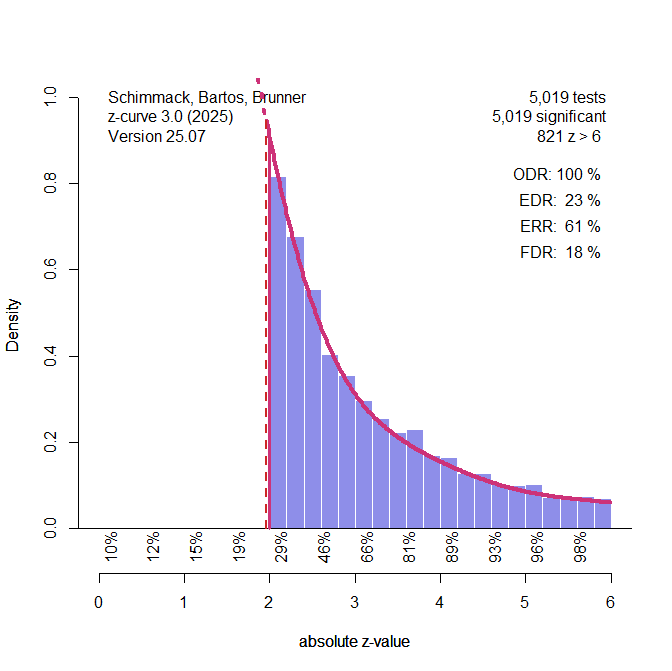
The EDR is 23% rather than 27%, the ERR is 61% rather than 65%, and the FDR is 18% rather than 14%. Close enough, in my opinion.
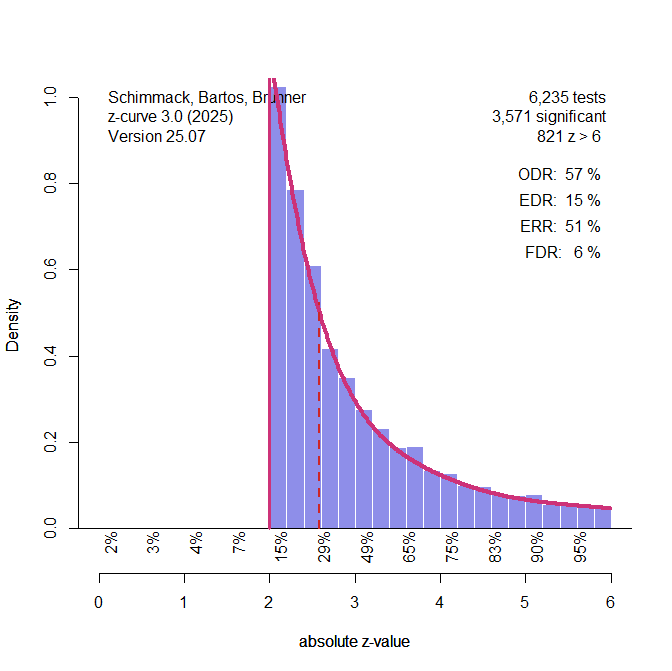
Then, I fitted the model to the data BEFORE the selection. These results tell us how much selection bias that matches the simulation could have biased our published z-curve results. As we do not know the actual biases, this is considered a sensitivity analysis.

The results show that the EDR could be 15%, the ERR could be 51%, and the FDR could be 30%. Thus, our published results MAY underestimate the risk of false positive results by 16 percentage points and overestimate the replicability of published results by 10 percentage points. This does not mean that our published results were wrong. We just do not know how researchers produced significant results.
One of our recommendations based on our FDR estimate of 14% was to lower alpha to maintain a relatively low false discovery risk. We recommended alpha = .01, as it produced an FDR below 5%. When we use alpha = .01 with these simulated data, the FDR is 6%, a bit above 5%, but as a famous statistician once pointed out, God likes .04 just as much as .06. To get below .05, we could lower alpha to .005.
Conclusion
We published a z-curve analysis of results in two leading emotion journals to provide emotion researchers with some empirical information about the false positive risk and replicability of results in these journals.
Reviewer A claims that these results provide no meaningful information about the credibility of emotion research. They also do not offer results based on a better model. Apparently, they prefer that emotion researchers either trust all results or assume that most significant results are false positives. As Kuhn noted in his work on scientific paradigms, this message is not going to have an impact on the field because paradigms only shift when a new paradigm gives researchers something else to do.
In the world of empirical meta-analysis, selection models are the way forward. We can improve them or replace them with something better, but we cannot go back to the good old days that assumed publication bias is not a problem.
Reviewer A made a valid observation. Selection models will produce biased estimates when the actual selection process differs from the assumptions of the selection model. All selection models assume a simple step function and equal probabilities for all significant results. This is clearly an oversimplification and future applications of z-curve and other selection models should conduct sensitivity analyses to examine how estimates change under various biases (see Carter et al., 2019, for a study of effect size meta-analyses). We are actually working on this issue right now.
Here I presented a sensitivity analysis for the emotion literature, using Reviewer A’s simulation of selection bias. While the results change notably, a key recommendation remains. The false positive risk with alpha = .05 is too high, but it can be reduced dramatically by lowering alpha to .01. While meta-scientists have argued over the best alpha level based on theoretical assumptions, we provided an empirical answer to this question. The answer remains valid even when we allow for gradual selection up to z = 4. The reason is that power is heterogenous and the pile of just significant results between .05 and .01 stems from studies with low power. In contrast, the long tail and the 20% of results with z > 6 stem from high powered studies. Alpha = .01 is a reasonable value to separate these two populations of studies.
On a final note, it is still true that you should trust the science, even if science does not provide simple TRUE vs. FALSE statements. This does not mean that you should trust scientists. It would be foolish for me to claim that I am unbiased. Fortunately, you do not have to trust me. You can download the data and z-curve, write your own simulation of selection bias, and conduct sensitivity analyses. Just don’t make the mistake to trust Reviewer A’s claim that meta-analyses of published studies are useless because we do not know how the sausage was made (i.e., researchers p-hacked their data). Forensic meta-analysis is not perfect and not as conclusive as detection of data fabrication or manipulation, but it can help to identify a subset of credible studies, if they exist.
P.S. We have indirectly communicated with Reviewer A with responses to their reviews and in public blog posts that reveal the flaws in their arguments. So far, Reviewer A has shown no willingness to engage directly with us and simply continue to write misinformed and misleading articles about z-curve. This blog post is just another open and transparent response to their criticism. If only there were a bade for open exchange of arguments. 🙂