Each year, I am working with undergraduate students on the coding of research articles to examine the replicability and credibility of psychological science (ROP2020). Before students code test-statistics from t-tests or F-tests in results sections, I provide a crash course on inferential statistics (null-hypothesis significance testing). Although some students have taken a basic stats course, the courses often fail to teach a conceptual understanding of statistics and distract students with complex formulas that are treated like a black box that converts data into p-values (or worse starts that reflect whether p < .05*, p < .01**, or p < .001***).
In this one-hour lecture, I introduce the basic principles of null-hypothesis significance testing using the example of the t-test for independent samples.
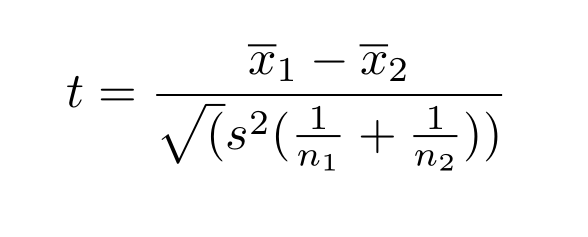
I explain that a t-value is conceptual made up of three components, namely the effect size (D = x1 – x2), a measure of the natural variation of the dependent variable (the standard deviation (s), and a measure of the amount of sampling error (simplified se = 2/sqrt (n1 + n2)).
Moreover, dividing the effect size D by the standard deviation provides the familiar standardized effect size, Cohen’s d = D/s. This means that a t-value corresponds to the ratio of the standardized effect size (d) over the amount of sampling error (se), t = d/se
It follows that a t-value is influenced by two quantities. T-values increase as the standardized (unit-free) effect sizes increase and as the sampling error decreases. The two quantities are sometimes called signal (effect size) and noise (sampling error). Accordingly, the t-value is the signal to noise ratio. I compare the signal and noise to an experiment where somebody is throwing rocks into a lake and somebody has to tell whether a rock was thrown based on the observation of a splash. A study with a small effect and a lot of noise is like trying to detect the splash of a small pebble on a very windy, stormy day where waves are creating a lot of splashes that make it hard to see the small splash made by a pebble. However, if you throw a big rock into the lack, you can see the big splash from the rock even when the wind creates a lot of splashing. If you want to see the splash of a pebble, you need to wait for a calm day without wind. These conditions correspond to a study with a large sample and very little sampling error.
Have a listen and let me know how I am doing. Feel free to ask questions that help me to understand how I can make the introduction to statistics even easier. Too many statistics books and lecturers intimidate students with complex formulas and Greek symbols that make statistics look hard, but in reality it is very simple. Data always have two components. The signal you are looking for and noise that makes it hard to see the signal. The bigger the signal to noise ratio is, the more likely it is that you saw a true signal. Of course, it can be hard to quantify signals and noise and statisticians work hard in getting good estimates of noise, but that does not have to concern users of statistics. As users of statistics we just trust statisticians that they have good (the best) estimates to see how good our data are.