The hallmark of a science is progress. To demonstrate that psychology is a science therefore requires evidence that current evidence, research methods, and theories are better than those in the past. Historic reviews are also needed because it is impossible to make progress without looking back once in a while.
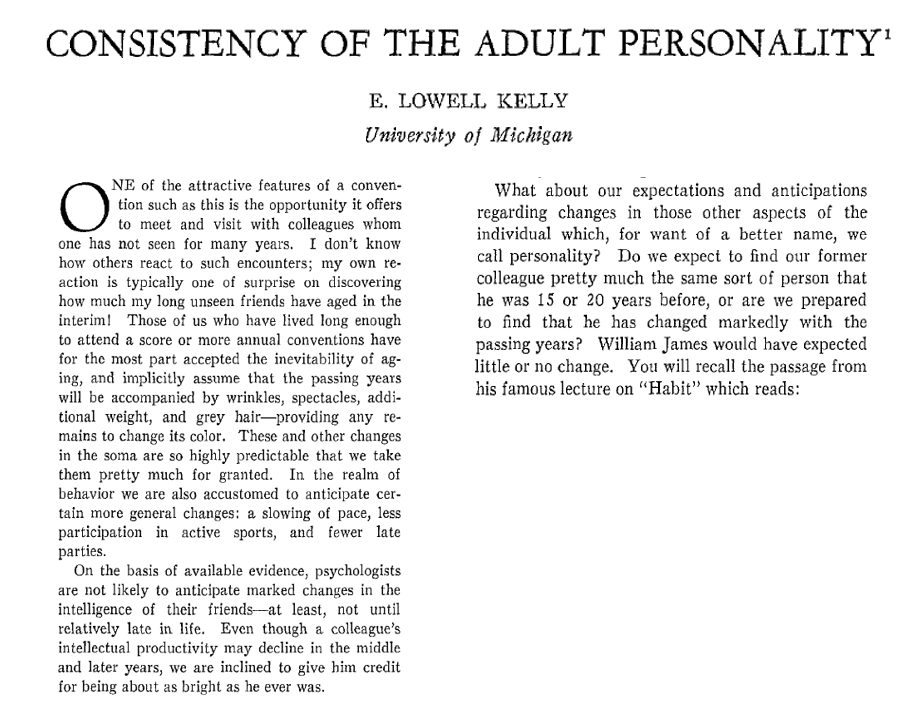
Research on the stability or consistency of personality has a long history that started with the first empirical investigations in the 1930s, but a historic review of this literature is lacking. Few young psychologists interested in personality development may be familiar with Kelly, his work, or his American Psychologist article on “Consistency of the Adult Personality” (Kelly, 1955). Kelly starts his article with some personal observations about stability and change in traits that he observed in colleagues over the years.
Today, we call traits that are neither physical characteristics, nor cognitive abilities, personality traits that are represented in the Big Five model. What have we learned about the stability of personality traits in adulthood from nearly a century of research?
Kelly (1955) reported some preliminary results from his own longitudinal study of personality that he started in the 1930s with engaged couples. Twenty years-later, they completed follow-up questionnaires. Figure 6 reported the results for the Allport-Vernon value scales. I focus on these results because they make it possible to compare the retest-correlations to retest-correlations over a one-year period.
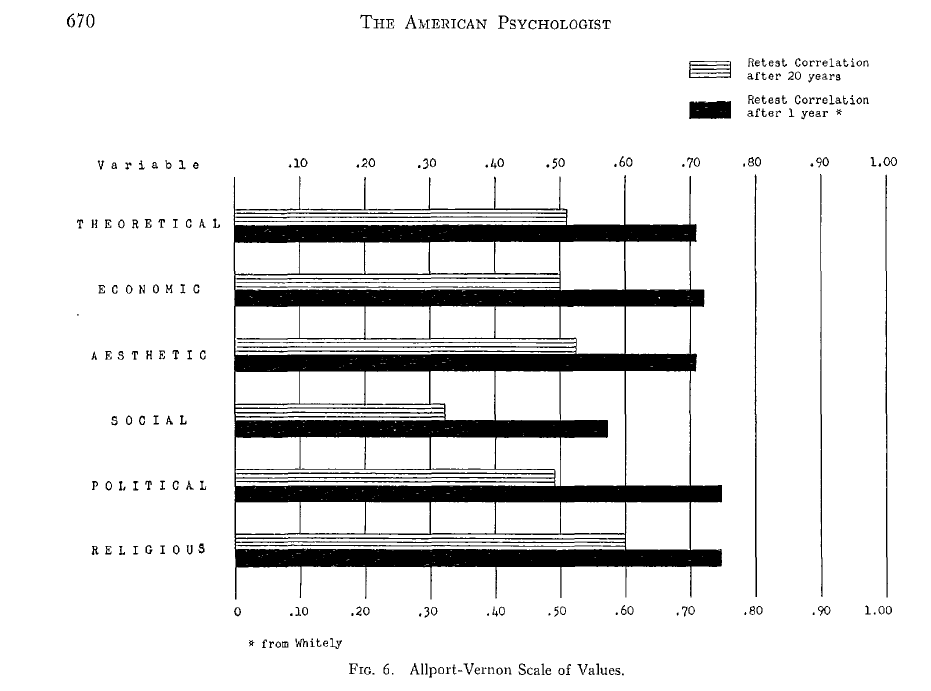
Figure 6 shows that personality, or at least values, are not perfectly stable. This is easily seen by a comparison of the one-year retest correlations with the 20-year retest correlations. The 20-year retest correlations are always lower than the one-year retest correlations. Individual differences in values change over time. Some individuals become more religious and others become less religious, for example. The important question is how much individuals change over time. To quantify change and stability it is important to specify a time interval because change implies lower retest correlations over longer retest intervals. Although the interval is arbitrary, a period of 1-year or 10-year can be used to quantify and compare stability and change of different personality traits. To do so, we need a model of change over time. A simple model is Heise’s (1969) autoregressive model that assumes a constant rate of change.
Take religious values as an example. Here we have two observed retest correlations, r(y1) = .60, and r(y20) = .75. Both correlations are attenuated by random measurement error. To correct for unreliability, we need to solve two equations with two unknowns, the rate of change and reliability.
.75 = rate^1 * rel
.60 = rate^20 * rel
With some rusty high-school math, I was able to solve this equation for rate
rate = (.60/.75)^(1/(20-1) = .988
The implied 10-year stability is .988^10 = .886.
The estimated reliability is .75 / .988 = .759.
Table 1 shows the results for all six values.
| Value | 1-year | 20-year | Reliability | 1-Year Rate | 10-Year Rate |
| Theoretical | 0.71 | 0.51 | 0.72 | 0.983 | 0.840 |
| Economic | 0.72 | 0.50 | 0.73 | 0.981 | 0.825 |
| Aesthetic | 0.71 | 0.52 | 0.72 | 0.984 | 0.849 |
| Social | 0.68 | 0.32 | 0.71 | 0.961 | 0.673 |
| Political | 0.75 | 0.49 | 0.77 | 0.978 | 0.799 |
| Religious | 0.75 | 0.60 | 0.76 | 0.988 | 0.889 |
Stability and Change of Allport-Vernon Values
The results show that the 1-year retest correlations are very similar to the reliability estimates of the value measure. After correcting for unreliability the 1-year stability is extremely high with stability estimates ranging from .96 for social values to .99 for religious values. The small differences in 1-year stabilities become only notable over longer time periods. The estimated 10-year stability estimates range from .68 for social values to .90 for religious values.
Kelly reported results for two personality constructs that were measured with the Bernreuter personality questionnaire, namely self-confidence and sociability.
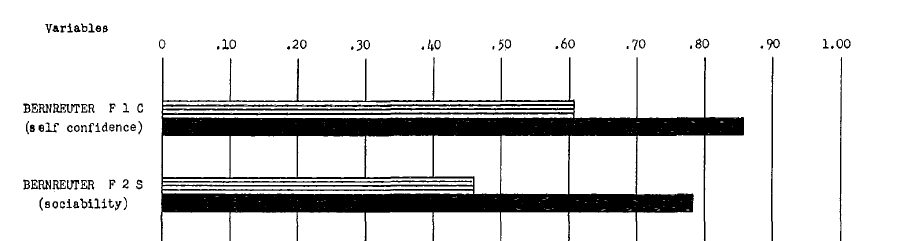
The implied stability of these personality traits is similar to the stability of values.
| Personality | 1-year | 20-year | Reliability | 1-Year Rate | 10-Year Rate |
| Self-Confidence | 0.86 | 0.61 | 0.88 | 0.982 | 0.835 |
| Sociability | 0.78 | 0.45 | 0.80 | 0.971 | 0.749 |
Kelly’s results published in 1955 are based on a selective sample during a specific period of time that included the second world war. It is therefore possible that studies with other populations during other time periods produce different results. However, the results are more consistent than different across different studies.
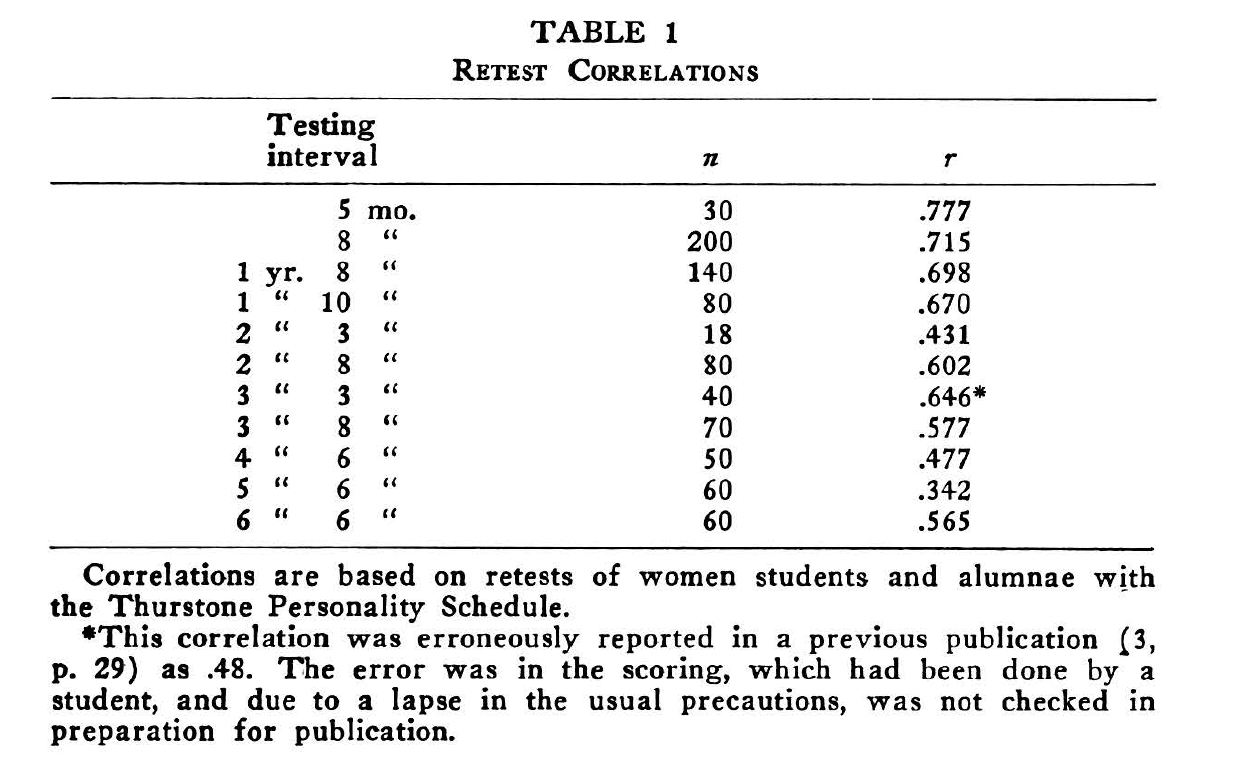
The first article with retest correlations for different time intervals of reasonable length was published in 1941 by Mason N. Crook. The longest retest interval was 6-years and six months. Figure 1a in the article plotted the retest correlations as a function of the retest interval.
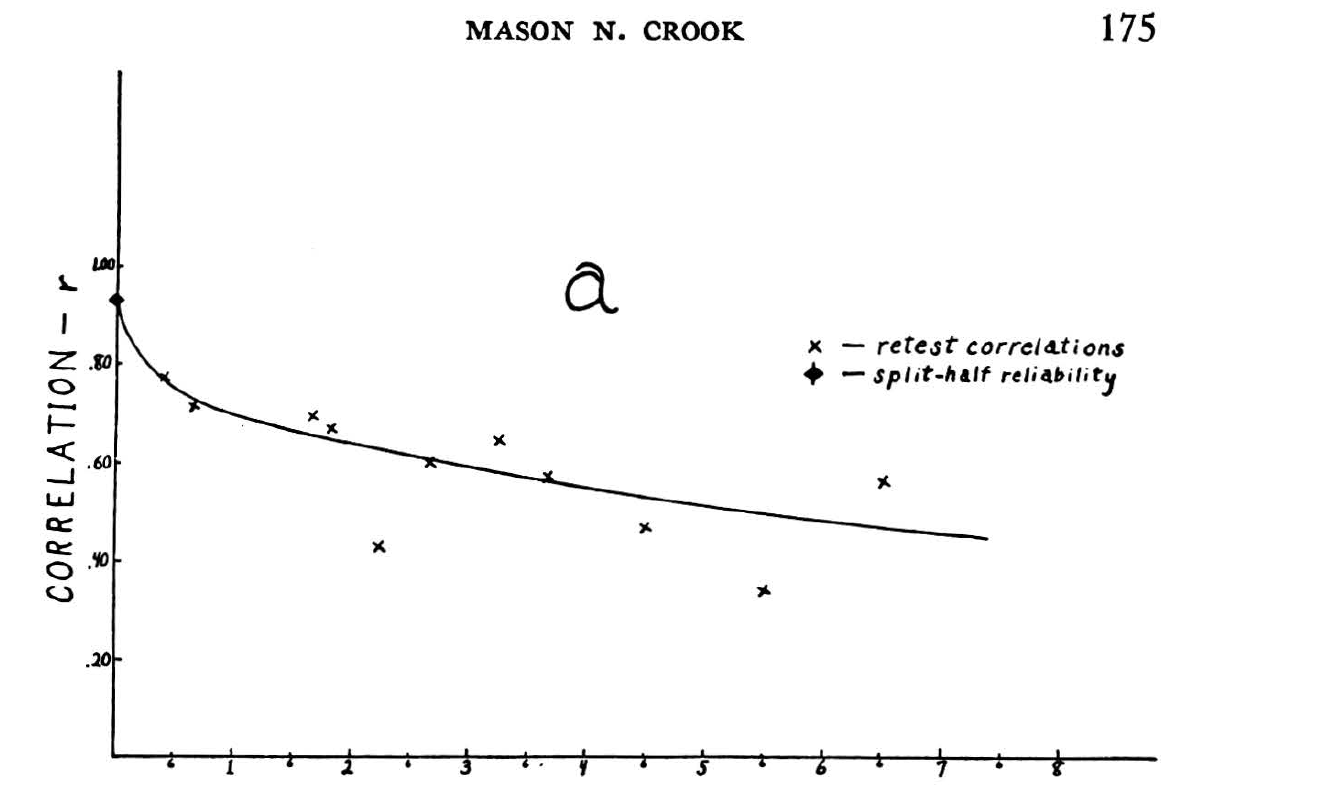
Table 2 shows the retest correlations and reveals that some of them are based on extremely small sample sizes. The 5-month retest is based on only 30 participants whereas the 8 months retest is based on 200 participants. Using this estimate for the short-term stability, it is possible to estimate the 1-year rate and 10-year rates using the formula given above.
| Sample Size | Months | retest | Reliability | 1-Year Rate | 10-Year Rate |
| 140 | 20 | 0.698 | 0.72 | 0.990 | 0.908 |
| 80 | 22 | 0.670 | 0.73 | 0.977 | 0.789 |
| 18 | 27 | 0.431 | 0.83 | 0.861 | 0.223 |
| 80 | 32 | 0.602 | 0.75 | 0.958 | 0.650 |
| 40 | 39 | 0.646 | 0.73 | 0.979 | 0.812 |
| 70 | 44 | 0.577 | 0.74 | 0.962 | 0.677 |
| 50 | 54 | 0.477 | 0.76 | 0.942 | 0.549 |
| 60 | 66 | 0.342 | 0.78 | 0.914 | 0.409 |
| 60 | 78 | 0.565 | 0.73 | 0.976 | 0.785 |
| Weighted Average | – | – | 0.75 | 0.958 | 0.651 |
The 1-year stability estimates are all above .9, except for the retest correlation that is based on only N = 18 participants. Given the small sample sizes, variability in estimates is mostly random noise. I computed a weighted average that takes both sample size and retest interval into account because longer time-intervals provide better information about the actual rate of change. The estimated 1-year stability is r = .96, which implies a 10-year stability of .65. This is a bit lower than Kelley’s estimates, but this might just be sampling error. It is also possible that Crook’s results underestimate long-term stability because the model assumes a constant rate of change. It is possible that this assumption is false, as we will see later.
Crook also provided a meta-analysis that included other studies and suggested a hierarchy of consistency.
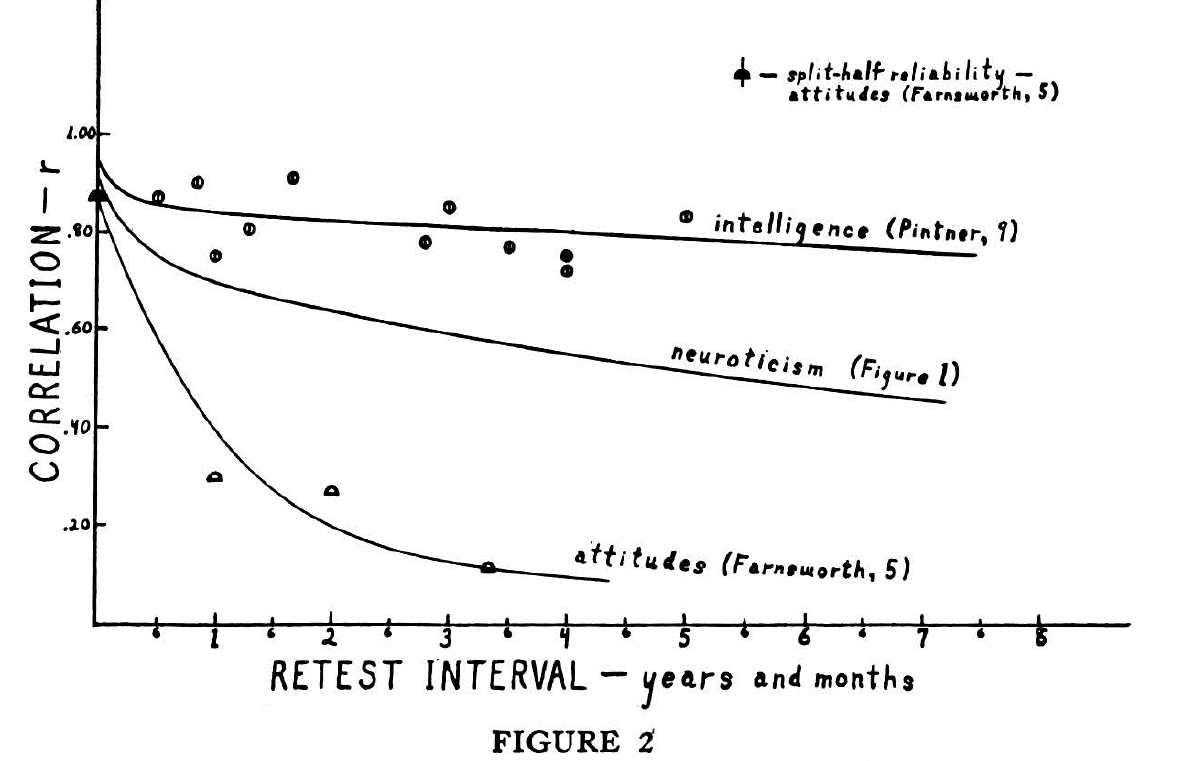
Accordingly, personality traits like neuroticism are less stable than cognitive abilities, but more stable than attitudes. As the Figure shows, empirical support for this hierarchy was limited, especially for estimates of the stability of attitudes.
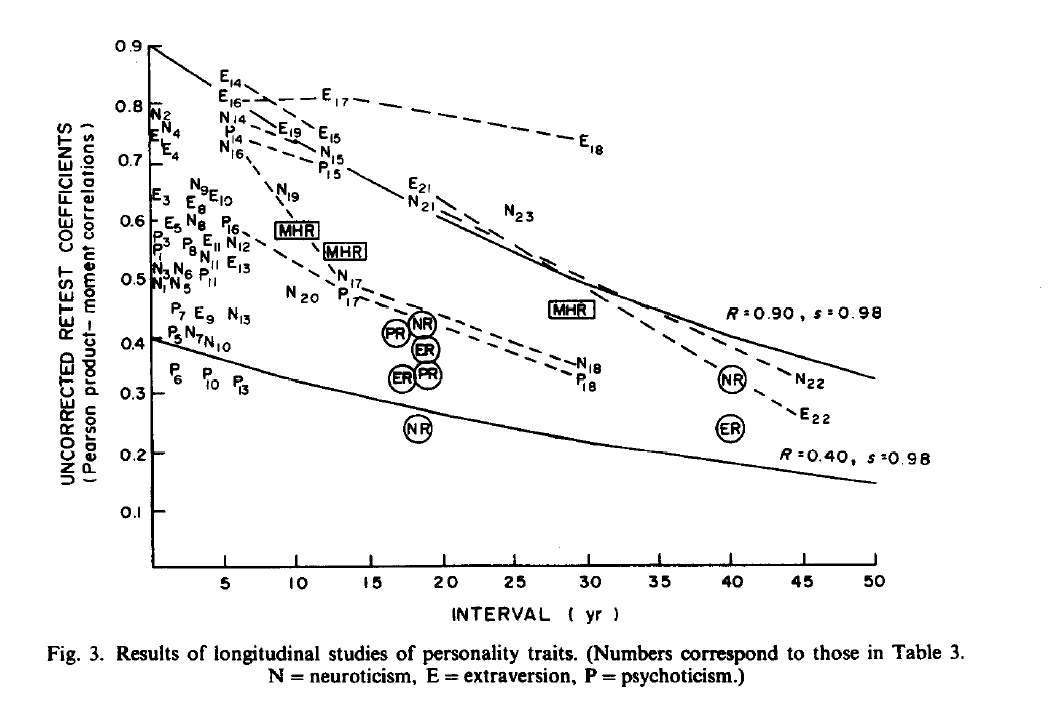
Several decades later, Conley (1984) reexamined this hierarchy of consistency with more data. He was also the first, to provide quantitative stability estimates that correct for unreliability. The meta-analysis included more studies and, more importantly, studies with long retest intervals. The longest retest interval was 45 years (Conley, 1983). After correcting for unreliability, the one-year stability was estimated to be r = .98, which implies a stability of r = .81 over a period of 10-years and r = .36 over 50 years.
Using the published retest correlations for with sample sizes greater than 100, I obtained a one-year stability estimate of r = .969 for neuroticism and r = .986 for extraversion. These differences may reflect differences in stability or could just be sampling error. The average reproduces Conley’s (1984) estimate of r = .98 (r = .978).
| Sample Size | Years | retest | Reliability | 1-Year Rate | 10-Year Rate |
| 239 | 2 | 0.41 | 0.97 | 0.734 | 0.046 |
| 636 | 4 | 0.54 | 0.78 | 0.918 | 0.426 |
| 460 | 6 | 0.27 | 0.85 | 0.842 | 0.178 |
| 917 | 9 | 0.65 | 0.73 | 0.983 | 0.841 |
| 211 | 10 | 0.48 | 0.75 | 0.955 | 0.632 |
| 460 | 12 | 0.71 | 0.72 | 0.994 | 0.945 |
| 446 | 19 | 0.62 | 0.72 | 0.989 | 0.898 |
| 383 | 45 | 0.33 | 0.73 | 0.982 | 0.831 |
| Weighted Average | – | – | 0.74 | 0.969 | 0.730 |
| Sample Size | Years | retest | Reliability | 1-Year Rate | 10-Year Rate |
| 239 | 2 | – | – | – | – |
| 636 | 4 | 0.56 | 0.77 | 0.926 | 0.466 |
| 460 | 6 | 0.84 | 0.70 | 1.017 | 1.182 |
| 917 | 9 | 0.76 | 0.72 | 1.000 | 1.000 |
| 211 | 10 | – | – | – | – |
| 460 | 12 | 0.75 | 0.72 | 0.999 | 0.989 |
| 446 | 19 | 0.65 | 0.72 | 0.992 | 0.921 |
| 383 | 45 | 0.26 | 0.73 | 0.976 | 0.788 |
| Weighted Average | – | – | 0.73 | 0.986 | 0.868 |
To summarize, decades of research had produced largely consistent findings that the short-term (1-year) stability of personality traits is well above r = .9 and that it takes long time-periods to observe substantial changes in personality.
The next milestone in the history of research on personality stability and change was Roberts and DelVeccio’s (2000) influential meta-analysis that is featured in many textbooks and review articles (e.g., Caspi, Roberts, & Shiner, 2005; MacAdams & Olson, 2010).
Roberts and DelVeccio’s literature review mentions Conley’s (1984) key findings. “When dissattenuated, measures of extraversion were quite consistent, averaging .98 over a 1-year period, approximately .70 over a 10-year period, and approximately .50 over a 40-year period” (p. 7).
The key finding of Roberts and DelVeccio’s meta-analysis was that age moderates stability of personality. As shown in Figure 1, stability increases with age. The main limitation of Figure 1 is that the figure shows average retest correlations without a specific time interval that are not corrected for measurement error. Thus, the finding that retest correlations in early and middle adulthood (22-49) average around .6 provides no information about the stability of personality in this age group.

Most readers of Roberts and DelVeccio (2000) fail to notice a short section that examines the influence of time interval on retest correlations.
“On the basis of the present data, the average trait consistency over a 1-year
period would be .55; at 5 years, it would be .52; at 10 years, it would be .49; at 20 years, it would be .41; and at 40 years, it would be .25” (Roberts & DelVeccio, 2000, p. 16).
Using the aforementioned formula to correct for measurement error shows that Roberts and DelVeccio’s meta-analysis replicates Conley’s results, 1-year r = .983.
| Years | retest | Reliability | 1-Year Rate | 10-Year Rate |
| 5 | 0.52 | 0.72 | 0.989 | 0.894 |
| 10 | 0.49 | 0.72 | 0.989 | 0.891 |
| 20 | 0.41 | 0.73 | 0.985 | 0.863 |
| 40 | 0.25 | 0.73 | 0.980 | 0.821 |
| Weighted Average | – | 0.73 | 0.983 | 0.842 |
Unfortunately, review articles often mistake these observed retest correlations as estimates of stability. For example, Adams and Olson write “Roberts & DelVecchio (2000) determined that stability coefficients for dispositional traits were lowest in studies of children (averaging 0.41), rose to higher levels among young adults (around 0.55), and then reached a plateau for adults between the ages of 50 and 70 (averaging 0.70)” (p. 521) and fail to mention that these stability coefficients are not corrected for measurement error, which is a common mistake (Schmidt, 1996).
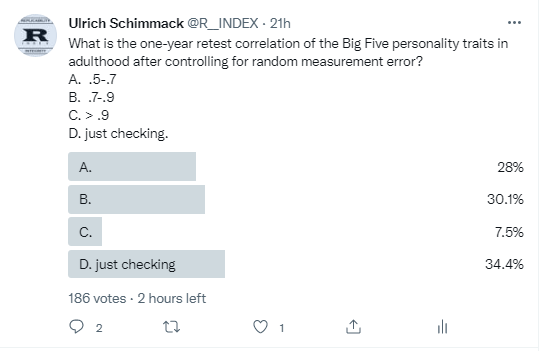
Roberts and DelVeccio’s (2000) article has shaped contemporary views that personality is much more malleable than the data suggest. A twitter poll showed that only 11% of respondents guessed the right answer that the one-year stability is above .9, whereas 43% assumed the upper limit is r = .7. With r = 7 over a 1-year period, the stability over 10-years would only be r = .03 over a 10-year period. Thus, these respondents essentially assumed that personality has no stability over a 10-year period. More likely, respondents simply failed to take into account how high short-term stability has to be to allow for moderately high long-term stability.
The misinformation about personality stability is likely due to vague, verbal statements and the use of effect sizes that ignore the length of the retest interval. For example, Atherton, Grijalva, Roberts, and Robins (2021) published an article with a retest interval of 18-years. The abstract describes the results as “moderately-to-high stability over a 20-year period” (p. 841). Table 1 reports the observed correlations that control for random measurement error using a latent variable model with item-parcels as indicators.

The next table shows the results for the 4-year retest interval in adolescence and the 20-year retest interval in adulthood along with the implied 1-year rates. Consistent with Roberts and DelVeccio’s meta-analysis, the 1-year stability in adolescence is lower, r = .908, than in adulthood, r = .976.
| Trait | Years | Retest | 1-Year Rate | Retest | Retest | 1-Year Rate |
| Extraversion | 4 | 0.69 | 0.911 | 20 | 0.66 | 0.979 |
| Agreeabelness | 4 | 0.70 | 0.915 | 20 | 0.61 | 0.976 |
| Conscientiousness | 4 | 0.68 | 0.908 | 20 | 0.57 | 0.972 |
| Neuroticism | 4 | 0.57 | 0.869 | 20 | 0.46 | 0.962 |
| Openness | 4 | 0.77 | 0.937 | 20 | 0.81 | 0.990 |
| Average | 4 | 0.68 | 0.908 | 20 | 0.62 | 0.976 |
However, even in adolescence the 1-year stability is high. Most important, the 1-year rate for adults is consistent with estimates in Conley’s (1984) meta-analysis and the first study in 1941 by Crook, and even Roberts and DelVeccio’s meta-analysis when measurement error is taken into account. However, Atherton et al. (2021) fail to cite historic articles and fail to mention that their results replicate nearly a century of research on personality stability in adulthood.
Stable Variance in Personality
So far, I have used a model that assumes a fixed rate of change. The model also assumes that there are no stable influences on personality. That is, all causes of variation in personality can change and given enough time will change. This model implies that retest correlations eventually approach zero. The only reason why this may not happen is that human lives are too short to observe retest correlations of zero. For example, with r = .98 over a 1-year period, the 100-year retest correlation is still r = .13, but the 200-year retest correlation is r = .02.
With more than two retest intervals, it is possible to see that this model may not fit the data. If there is no measurement error, the correlation from t1 to t3 should equal the product of the two lags from t1 to t2 and from t2 to t3. If the t1-t3 correlation is larger than this model predicts, the data suggest the presence of some stable causes that do not change over time (Anusic & Schimmack, 2016; Kenny & Zautra, 1995).
Take the data from Atherton et al. (2021) as an example. The average retest correlation from t1 (beginning of college) to t3 (age 40) was r = .55. The correlation from beginning to end of college was r = .68, and the correlation from end of college to age 40 was r = .62. We see that .55 > .68 * .62 = .42.

Anusic and Schimmack (2016) estimated the amount of stable variance in personality traits to be over 50%. This estimate may be revised in the future when better data become available. However, models with and without stable causes differ mainly in predictions over long-time intervals where few data are currently available. The modeling has little influence on estimates of stability over time periods of less than 10-years.
Conclusion
This historic review of research on personality change and stability demonstrated that nearly a century of research has produced consistent findings. Unfortunately, many textbooks misrepresent this literature and cite evidence that does not correct for measurement error.
In their misleading, but influential meta-analysis, Roberts and DelVeccio concluded that “the average trait consistency over a 1-year period would be .55; at 5 years, it would be .52; at 10 years, it would be .49; at 20 years, it would be .41; and at 40 years, it would be .25” (p. 16).
The correct (ed for measurement error) estimates are much higher. The present results suggest consistency over a 1-year would be .98, at 5 years it would be .90, at 10-years it would be .82, at 20-years it would be .67, and at 40 years it would be .45. Long-term stability might even be higher if stable causes contribute substantially to variance in personality (Anusic & Schimmack, 2016).
The evidence of high stability in personality (yes, I think r = .8 over 10-years warrants the label high) has important practical and theoretical implications. First of all, stability of personality in adulthood is one of the few facts that students at the beginning of adulthood may find surprising. It may stimulate self-discovery and taking personality into account in major life decisions. Stability of personality also means that personality psychologists need to focus on the factors that cause stability in personality, but psychologists have traditionally focused on change because statistical tools are designed to focus on differences and deviations rather than invariances. However, just because the Earth is round or the speed of light is constant, natural sciences do not ignore these fixtures of life. It is time for personality psychologists to do the same. The results also have a (sobering) message for researchers interested in personality change. Real change takes time. Even a decade is a relatively short period to observe notable changes which is needed to find predictors of change. This may explain why there are currently no replicable findings of predictors of personality change.
So, what is the stability of personality over a one-year period in adulthood after taking measurement error into account. The correct answer is that it is greater than .9. You probably didn’t know this before reading this blog post. This does of course not mean that we are still the same person after one year or 10 years. However, the broader dispositions that are measured with the Big Five are unlikely to change in the near future for you, your spouse, or co-workers. Whether this is good or bad news depends on you.
Ulrich, thanks very much for this excellent summary of a central issue in personality studies. You might also mention Allport’s thoughts on this “hierarchy” issue and the findings by Converse and others of a similar “hierarchy” in political orientations. Once again, many thanks for your insight and clarity of expression.
Thank you. Do you have a specific reference to Allport. I hope I can find it online.