The first five parts built a model that related personality traits with well-being. Part six added sex (male/female) to the model. It may not come as a surprise that part 7 adds age to the model because sex and age are two commonly measured demographic variables.

Age and Wellbeing
Diener et al.’s (1999) review article pointed out that early views of old age as a period of poor health and misery was not supported by empirical studies. Since then, some studies with national representative samples have found a U-shaped relationship between age and well-being. Accordingly, well-being decreases from young adulthood to middle age and then increases again into old age before well-being declines at the end of life. Thus, there is some evidence for a mid-life crisis (Blanchflower, 2021).
The present dataset cannot examine this U-shaped pattern because data are based on students and their parents, but the U-shaped pattern would predict that students have higher well-being than their middle-aged parents.
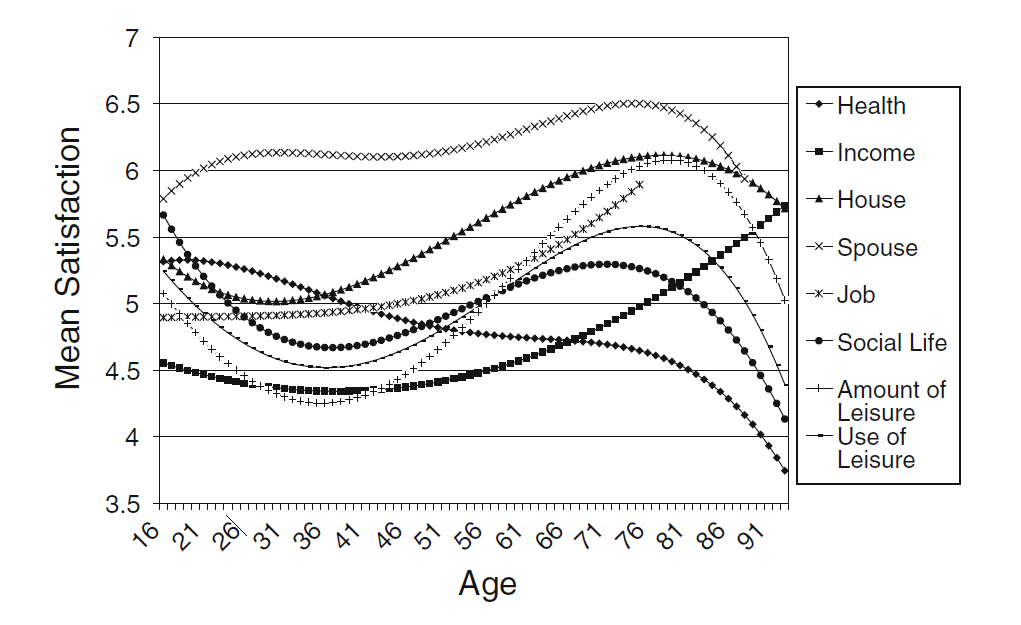
McAdams, Lucas, and Donnellan (2012) found that the relationship between age and life-satisfaction was explained by effects of age on life-domains. According to their findings in a British sample, health satisfaction decreased with age, but housing satisfaction increased with age. The average trend across domains mirrored the pattern for life-satisfaction judgments.
Based on these findings, I expected that age was a negative predictor of life-satisfaction and that this negative relationship is mediated by domain satisfaction. To test this prediction I added age as a predictor variable. As for sex, age is an exogeneous variable because age can influence personality and well-being, but personality cannot influence (biological) age. Although age was added as a predictor for all factors in the model, overall model fit decreased, chi2(1478) = 2198, CFI = .973, RMSEA = .019. This can happen when a new variable is also related to the unique variances of indicators. Inspection of the modification indices showed some additional relationships with self-ratings that suggested older respondents have a positive bias in their self-ratings. To allow for this possibility, I allowed all self-ratings to be influenced by age. This modification substantially increased model fit, chi2(1462) = 1970, CFI = .981, RMSEA = .016. I will further examine this positivity bias in the next model. Here I focus on the findings for age and well-being.
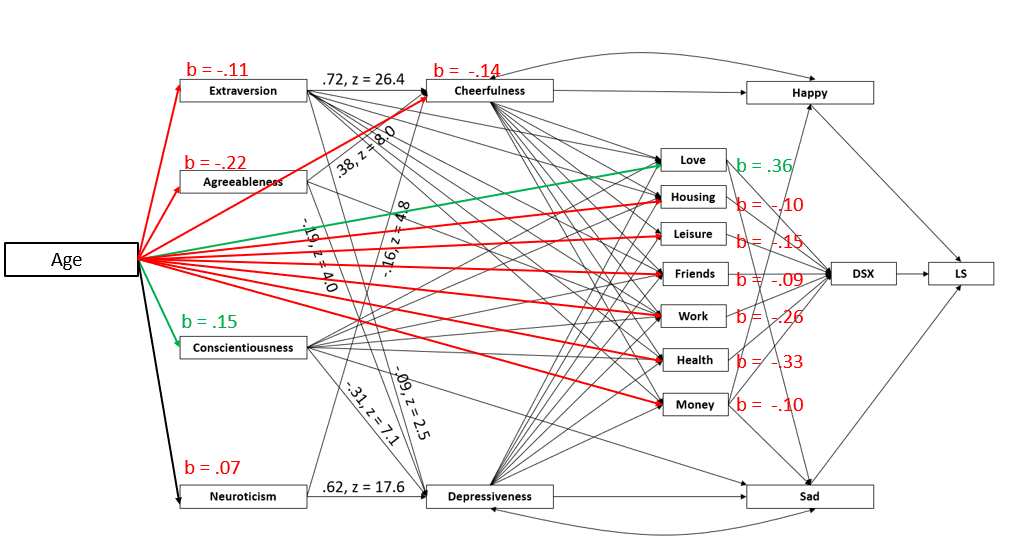
As expected, age was a negative predictor of life-satisfaction, b = -.21, se = .04, Z = 5.5. This effect was fully mediated. The direct effect of age on life-satisfaction was close to zero and not significant, b = -.01, se = .04, Z = 0.34. Age also had no direct effect on positive affect (happy), b = .00, se = .00, Z = 0.44, and only a small effect on negative affect (sadness), b = -.03, se = .01, Z = 2.5. Yet, the sign of this relationship shows lower levels of sadness in middle age, which does not explain the lower level of life-satisfaction. In contrast, age was a negative predictor of average domain satisfaction (DSX) and the effect size was close to the effect size for life-satisfaction, b = -.20, se = .05, Z = 4.1. This results replicates McAdams et al.’s (2012) finding that domain satisfaction mediates the effect of age on life-satisfaction.
However, the monster model shows that domain satisfaction is influenced by personality traits. Thus, it is possible that some of the age effects on domain satisfaction are not only influenced by objective domain aspects, but also by top-down effects of personality traits. To examine this, I traced the indirect effects of age on average domain satisfaction.
Age was a notable negative predictor of cheerfulness, b = -.29, se = .04, Z = 7.5. This effect was partially mediated by extraversion, b = -.07, se = 02, Z = 3.5 and agreeableness, b = -.08, se = .02, Z = 4.5, while some of the effect was direct, b = -.14, se = .03, Z = 4.4. There was no statistically significant effect of age on depressiveness, b = .07, se = 04, Z = 1.9.
Age also had direct relationships with some life domains. Age was a positive predictor of romantic satisfaction, b = .36, se = .04, Z = 8.2. Another strong relationship emerged for health satisfaction, b = -.36, se = .04, Z = 8.4. Another negative relationship was observed for work, b = -.26, se = .04, Z = 6.4, reflecting the difference between studying and working. Age was also a negative predictor of housing satisfaction, b = -.10, se = .04, Z = 2.8, recreation satisfaction, b = -.15, se = .05, Z = 3.4, financial satisfaction, b = -.10, se = .05, Z = 2.1, and friendship satisfaction, b = -.09, se = .04, Z = 2.1. In short, age was a negative predictor of satisfaction with al life domains even after controlling for the effects of age on cheerfulness.
The only positive effect of age was an increase in conscientiousness, b = .15, se = .04, Z = 3.7, which is consistent with the personality literature (Roberts, Walton, & Viechtbauer, 2006). However, the indirect positive effect on life-satisfaction is small, b = .04
In conclusion, the present results replicate that well-being decreases from young adulthood to middle age. The effect is mainly explained by a decrease in cheerfulness and decreasing satisfaction with a broad range of life domains. The only exception was a positive effect on romantic satisfaction. These results have to be interpreted in the context of the specific sample. Younger participants were students. It is possible that young adults who already join the workforce have lower well-being than students. The higher romantic satisfaction for parents may also be due to the recruitment of parents who remained married with children. Singles and divorced middle-aged individuals show lower life-satisfaction. The fact that age effects were fully mediated shows that studies of age and well-being can benefit from the inclusion of personality measures and the measurement of domain satisfaction (McAdams et al., 2012).
1 thought on “How to Build a Monster Model of Well-Being: Part 7”