The first five parts of this series built a model that related the Big Five personality traits as well as the depressiveness facet of neuroticism and the cheerfulness facet of extraversion to well-being. In this model, well-being is conceptualized as a weighted average of satisfaction with life domains and experiences of happiness and sadness (Part 5).

Part 6 adds sex/gender to the model. Although gender is a complex construct, most individuals identify as either male or female. As sex is frequently assessed as a demographic characteristic, the simple correlations of sex with personality and well-being are fairly well known and were reviewed by Diener et al. (1999).
A somewhat surprising finding is that life-satisfaction judgments show hardly any sex differences. Diener et al. (1999) point out that this finding seems to be inconsistent with findings that women report higher levels of neuroticism (neuroticism is a technical term for a disposition to experience more negative affects and does not imply a mental illness), negative affect, and depression. Accordingly, gender could have a negative effect on well-being that is mediated by neuroticism and depressiveness. To explain the lack of a sex difference in well-being, Diener et al. proposed that women also experience more positive emotions. Another possible mediator is agreeableness. Women consistently score higher in agreeableness and agreeableness is a positive predictor of well-being. Part 5 showed that most of the positive effect of agreeableness was mediated by cheerfulness. Thus, agreeableness may partially explain higher levels of cheerfulness for women. To my knowledge, these mediation hypotheses have never been formally tested in a causal model.
Adding sex to the monster model is relatively straightforward because sex is an exogeneous variable. That is causal paths can originate from sex, but no causal path can be pointed at sex. After all, we know that sex is determined by the genetic lottery at the moment of conception. It is therefore possible to add sex as a cause to all factors in the model. Despite adding all causal pathways, model fit decreased a bit, chi2(1432) = 2068, CFI = .976, RMSEA = .018. The main reason for reduced fit would be that sex predicts some of the unique variances in individual indicators. Inspection of modification indices showed that sex was related to higher student ratings of neuroticism and lower ratings of neuroticism by mothers’ as informants. While freeing these parameters improved model fit, the effect on sex differences in neuroticism were opposite. Assuming (!) that mothers’ underestimate neuroticism, increased sex differences in neuroticism from d = .69, se = .07 to d = .81, se = .07. Assuming that students’ overestimate neuroticism resulted in a smaller sex difference of d = .54, se = .08. Thus, the results suggest that sex differences in neuroticism are moderate to large (d = .5 to .8), but there is uncertainty due to some rating biases in ratings of neuroticism. A model that allowed for both biases had even better fit and produced the compromise effect size estimate of d = .67, se = .08. Overall fit was now only slightly lower than for the model without sex, chi2(1430) = 2024, CFI = .978, RMSEA = .017. Figure 2 shows the theoretically significant direct effects of sex with effect sizes in units of standard deviations (Cohen’s d).
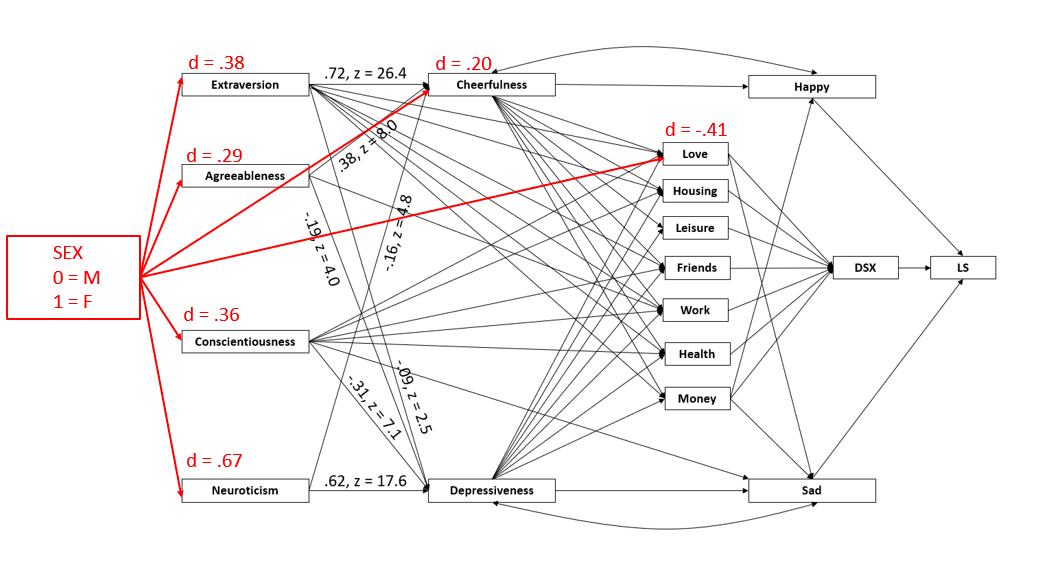
The model not only replicated sex differences in neuroticism. It also replicated sex differences in agreeableness, although the effect size was small, d = .29, se = .08, Z = 3.7. Not expected was the finding that women also scored higher in extraversion, d = .38, se = .07, Z = 5.6, and conscientiousness, d = .36, se = .07, Z = 5.0. The only life domain with a notable sex difference was romantic relationships, d = -.41, se = .08, Z = 5.4. The only other statistically significant difference was found for recreation, d = -.19, se = .08, Z = 2.4. Thus, life domains do not contribute substantially to sex differences in well-being. Even the sex difference for romantic satisfaction is not consistently found in studies of marital satisfaction.
The model indirect results replicated the finding that there are no notable sex differences in life-satisfaction, total effect d = -.07, se = .06, Z = 1.1. Thus, tracing the paths from sex to life-satisfaction provides valuable insights into the paradox that women tend to have higher levels of neuroticism, but not lower life-satisfaction.
Consistent with prior studies, women had higher levels of depressiveness and the effect size was small, d = .24, se = .08, Z = 3.0. The direct effect was not significant, d = .06, se = .08, Z = 0.8. The only positive effect was mediated by neuroticism, d = .42, se = .06, Z = 7.4. Other indirect effects reduced the effect of sex on depressiveness. Namely, women’s higher conscientiousness (in this sample) reduced depressiveness, d = -.14, as did women’s higher agreeableness, d = -.06, se = .02, Z = 2.7, and women’s higher extraversion, d = -.04, se = .02, Z = 2.4. These results show the problem of focusing on neuroticism as a predictor of well-being. While neuroticism shows a moderate to strong sex difference, it is not a strong predictor of well-being. In contrast, depressiveness is a stronger predictor of well-being, but has a relatively small sex difference. This small sex difference partially explains why women can have higher levels of neuroticism without lower levels of well-being. Men and women are nearly equally disposed to suffer from depression. Consistent with this finding, men are actually more likely to commit suicide than women.
Consistent with Diener et al.’s (1999) hypothesis, cheerfulness also showed a positive relationship with sex. The total effect size was larger than for depressiveness, d = .50, se = .07, Z = 7.2. The total effect was partially explained by a direct effect of sex on cheerfulness, d = .20, se = .06, Z = 3.6. Indirect effects were mediated by extraversion, d = .27, se = .05, Z = 5.8, agreeableness d = .11, se = .03, Z = 3.6, and conscientiousness, d = .05, se = .02, Z = 3.2. However, neuroticism reduced the effect size by d = -.12, se = .03, Z = 4.4.
The effects of gender on depressiveness and cheerfulness produced corresponding differences in experiences of NA (sadness) and PA (happiness), without additional direct effects of gender on the sadness or happiness factors. The effect on happiness was a bit stronger, d = .35, se = .08, Z = 4.6 than the effect on sadness, d = .28, se = .07, Z = 4.1.
Conclusion
In conclusion, the results provide empirical support for Diener et al.’s hypothesis that sex differences in well-being are small because women have higher levels of positive affect and negative affect. The relatively large difference in neuroticism is also deceptive because neuroticism is not a direct predictor of well-being and gender differences in depressiveness are weaker than gender differences in neuroticism or anxiety. In the present sample, women also benefited from higher levels of agreeableness and conscientiousness that are linked to higher cheerfulness and lower depressiveness.
The present study also addresses concerns that self-report biases may distort gender differences in measures of affect and well-being (Diener et al., 1999). In the present study, well-being of mothers and fathers was not just measured by their self-reports, but also by students’ reports of their parents’ well-being. I have also asked students in my well-being course whether their mother or father has higher life-satisfaction. The answers show pretty much a 50:50 split. Thus, at least subjective well-being does not appear to differ substantially between men and women. This blog post showed a theoretical model that explains why men and women have similar levels of well-being.
Continue here to Part 7.
How is the data for this model sampled?
The data came from the Mississauga Family Study. In this study, students who lived with their biological parents participated in a Round-Robin family study. Thus, there were three targets (students, mothers, fathers). In addition, there were three informants (students, mothers, fathers). These data can be analzyed with a model with planned missing data and four measures (self, student informant, mother informant, father informant), where data are missing for the informant ratings of the same target (informant ratings of student by students).
see Zou, Schimmack, Gere (2013) or Schimmack & Kim (2020) for more information.
https://doi.org/10.1037/a0033902
https://doi.org/10.1016/j.jrp.2019.103888